This paper has been accepted for publication in Journal of Cognitive Neuroscience.
Sex effects on development of brain structure and
executive functions: greater variance than mean effects
Wierenga, L.M.1,2, Bos, M.G.N.1,2, van Rossenberg, F.1,2, Crone, E.A.1,2
1Institute of Psychology; Leiden University; Leiden; PO Box 9600, 2300 RB Leiden, The
Netherlands
2 Leiden Institute for Brain and Cognition, Leiden, The Netherlands
*Correspondence to: Lara M. Wierenga ([email protected]), Brain and
Development Research Center; Leiden University; Leiden; PO Box 9600, 2300 RB Leiden,
The Netherlands
Number of pages: 30
Number of figures and tables: 6 Figures, 6 Tables
Number of words abstract: 324
Number of words Introduction: 988
Number of words Discussion: 1923
Abstract: Although male brains have consistently reported to be 8-10% larger than female
brains, it remains not well understood whether there are differences between sexes
(average or variance) in developmental trajectories. Furthermore, if sex differences in
average brain growth or variance are observed, it is unknown whether these sex
differences have behavioural relevance. The present longitudinal study aimed to unravel
sex effects in cortical brain structure, development and variance, in relation to the
development of educationally relevant cognitive domains and executive functions (EF).
This was assessed with three experimental tasks including working memory, reading
comprehension and fluency. In addition, real-life aspects of EF were assessed with self and
parent reported BRIEF scores. The full dataset included 271 participants (54% females)
aged between 8 and 29 years old of which three waves were collected at two-year intervals
resulting in 680 T1-weighted MRI scans and behavioural measures. Analyses of average
trajectories confirmed general age-related patterns of brain development, but did not
support the hypothesis of sex differences in brain development trajectories, except for left
banks superior temporal sulcus where boys had a steeper decline in surface area than girls.
Also, our brain age prediction model (including 270 brain measures), did not indicate
delayed maturation in boys compared to girls. Interestingly, support was found for greater
variance in male brains than female brains in both structure and development, consistent
with prior cross-sectional studies. Behaviourally, boys performed on average better on a
working memory task with a spatial aspect and girls performed better on a reading
comprehension task, but there was no relation between brain development and cognitive
performance, neither for average brain measures, brain age, or variance measures. Taken
structures compared to females but these were not related to EF. The sex differences
observed in EF were not related to brain development, possibly suggesting that these are
related to experiences and strategies rather than biological development.
1. Introduction
Many prior studies have reported mean sex differences in brain structure, but the
directionality and size of regional effects have been inconsistent (Ruigrok et al., 2014). An
initial and well-cited neurodevelopmental study suggested that there are developmental
differences in brain structure development between the sexes showing delayed brain
development in boys relative to girls (Lenroot et al., 2007), but this effect has not been
consistently replicated (Tamnes, 2013; Lebel & Beaulieu, 2011; Aubert-Broche et al., 2013;
Wierenga et al., 2014). Recently, it was demonstrated that inconsistencies between prior
studies are possibly related to the way studies have accounted for global brain volume and
other scanning parameters (Mills and Tamnes, 2014). Importantly, our work and that of
others suggest differences in brain structure between males and females at the variance
rather than mean group level: males show greater variance in brain structure compared to
females (Ritchie et al., 2017a; Wierenga et al., 2017). This would potentially bias average
group level models.
Moreover, the relation between brain structure development and cognitive development
remains poorly understood. If sex differences in brain structure emerge during
development, an important question concerns whether individual differences in brain
volume are related to cognitive outcomes (Foulkes and Blakemore, 2018). This is especially
important in the context of emerging educational implications of differences in brain
development, where results may be too quickly translated to the classroom, which may
result in neuromyths and unbiased conclusions (Howard-Jones, 2014). The goal of this
study was therefore to examine in a three-wave accelerated longitudinal brain imaging
observed in average and variance measures, and whether potential differential
developmental trajectories are correlated with individual differences in cognitive
performance.
An important educational skill concerns our ability to control our thoughts and actions in
order to obtain a future goal, also referred to as executive functioning (EF) (Satterthwaite
et al., 2015; Diamond, 2013). EF is an umbrella term for a variety of subdomains including
working memory, inhibition, cognitive flexibility, and error monitoring (Diamond, 2000),
which each showed to have different developmental trajectories. For example, attentional
control emerges in infancy showing relative stability in early adolescence, while working
memory showed protracted development till early adulthood (Anderson, 2010; Huizinga et
al., 2006). Even though marginal sex differences have been identified on specific EF tasks,
these findings have not been consistently replicated (Hyde, 2016; Miller and Halpern,
2014). EF domains in which girls, on average, have been reported to outperform boys
include verbal fluency, information processing and spatial organization (Anderson, 2001;
Anderson et al., 2000, 2001; Kakavetsis & Vlachos, 1997; Levin et al., 1991). In contrast,
boys on average showed better performance than girls on a spatial working memory task
(Krikorian & Bartok, 1998).
These different domains of EF are thought to be related to separate but overlapping brain
circuitries in the prefrontal cortex (PFC) (Crone and Steinbeis, 2017). Moreover, the
relative protracted development of the PFC has been associated with development of EF
(Bunge and Zelazo, 2006). However, it is currently not known whether and how individual
differences in EF relate to the development of brain. It also remains unclear whether sex
(Gunzenhauser and Suchodoletz, 2015) over the course of development, and whether this
is accounted for by developmental differences in brain development.
The goal of this study was to examine the relation between sex effects in structural brain
development and cognitive (EF) development, and unravel the ongoing debate about the
possible differences between boys and girls in brain development and associated
performance. Advances in supervised learning models allow us to model the brain as
dynamic, multimodal, circuit-based system, rather than snapshots of individual brain
regions in isolation. More specifically, these models are able to accurately predict an
individual’s developmental stage (e.g. ‘brain age’), which allows us to test developmental
trajectories per individual in more detail, as has been previously done for functional
imaging data (Dosenbach et al., 2010) as well as structural imaging data (Ball et al., n.d.;
Brown et al., 2012; Khundrakpam et al., 2015). In addition to studying average differences
and variance differences, we will also examine individual development relative to the
reference group (e.g. males or females). It was previously demonstrated that deviations
between predicted ‘brain age’ and chronological age were indicative of cognitive
performance in elderly individuals (Erus et al., 2015). As such these models may help us to
better understand whether sex differences in brain development relate to sex differences
in cognition.
In this 3-wave longitudinal cohort of 299 typically developing children, adolescents, and
young adults between ages 8-29 years (680 assessments), participants performed a battery
of cognitive tasks that were designed for their relation with educational outcomes: working
Verhelst, Kamphuis, & Kleintjes, 2010; Huizinga et al., 2006). In addition to these
laboratory task based assessments of cognition, we also include self- and parent-reported
“real-life” EF assessments as these may provide more ecological-valid measures of EF
because they allow assessment of integrated, multidimensional, complex relativistic,
priority-based decision-making that is demanded in real-world situations (Burgess, 1997;
Goldberg and Podell, 2000; Shallice and Burgess, 1991). The level of agreement between
such questionnaires and well-established EF tasks is at best, modest (Anderson, Anderson,
Jacobs, Northam, & Mickiewicz, 2002), which suggests that each form of assessment
provides unique information on EF functioning. Using this combined brain-behaviour
assessment, we sought to i) examine whether boys and girls show mean and/or variance
differences in developmental brain patterns across the cortical mantle, ii) test sex effects
on performance-based and “real-life” cognitive measures across development and examine
their relation to brain development measures. In addition, we used ‘brain age’ prediction
models, to assess the brain as a circuit based system and test whether iii) ‘brain age’
predictions differed between the sexes, and iv) whether ‘brain age’ is predictive of
individual differences in cognition.
2. Methods and materials
2.1 Participants
The data in the present study are part of a large accelerated longitudinal research project,
BrainTime (e.g., Becht et al., 2018; Peters and Crone, 2017; Schreuders et al., 2018;
Wierenga et al., 2018). At enrolment 299 participants were included (51% females), data
demographics). Based on self-report neurological, endocrinological, mental health illnesses
or use of psychotropic medication at time point 1 were excluded. Note that we did not
exclude participants that showed these problems at follow-up time points, because from a
population science perspective it is important to include a representative sample from the
community. Written informed consent was obtained from all participants at each time
point. For participants younger than 18 years old, additional consent from their parents
was acquired. An independent clinical neuroradiologist evaluated all Magnetic Resonance
Imaging (MRI) - scans. No gross abnormalities were reported for any of the participants.
The study was approved by the Institutional Review Board at Leiden University Medical
Centre. A financial reimbursement was granted for participation in the study. IQ was
estimated at the first two time points with two subtests (similarities and block design) of
the WISC-III (participants under 16 years of age) or WAIS-III (participants 16 years of age
and older) (Stinissen et al., 1970; Wechsler, 2000; Kort et al., 2005; Van Haasen et al.,
1986).
2.2 Neuroimaging measures
Good quality MRI scans were collected of 271 participants (53% females) aged between 8
and 26 years. Of these 271 participants, 237 were scanned on time point 1, 245 were
scanned on time point 2 and 198 were scanned on time point 3 (see average number of
scans per participant in Table 1). Cognitive assessment and MRI scans were acquired at the
same day.
MRI scans were acquired on a single 3 Tesla Philips Achieve whole body scanner, using a 6
Medical Centre. For definition of all brain measures, a whole brain T1-weighted anatomical
scan was acquired (TR=9.8 ms, TE = 4.6 ms, flip angle = 8°, 140 slices, 0.875 mm x 0.875
mm x 1.2 mm, and FOV = 224 x 177 x 168 mm). Scan time for this sequence was 4 min 56 s.
MRI scans were analysed on the local computer network at the Leiden University Medical
Centre. T1 scans were processed using FreeSurfer 5.3, through which volumetric
segmentations were estimated. This software suite is well validated and widely used, it is
documented and freely available online (http://surfer.nmr.mgh.harvard.edu/). The
technical details of the automated reconstruction scheme are described in detail elsewhere
(Dale et al. 1999; Fischl et al. 1999a; 1999b; 2002).
In order to reduce within subject scan session variability, a longitudinal stream was
developed for FreeSurfer (Reuter and Fischl 2011, Reuter et al., 2012). This method
increases repeatability and statistical power (Reuter et al., 2010). All scans were processed
using this procedure. This process includes the creation of an unbiased within-subject
template space and image (“base”) using robust, inverse consistent registration (Reuter et
al. 2010). The automated processing steps, including skull stripping, atlas registration and
parcellations are next initialized using the common information from the within-subject
template. Thickness and surface area measures of the Desikan-Killiany atlas were included
(34 cortical regions per hemisphere). Before quantitative analyses could be performed,
output require qualitative inspection (Dewey et al., 2010). Post-processing QC was
performed using an in-house developed semi-automatic quality assessment tool (Klapwijk
et al., 2018). This resulted in the exclusion of 113 scans from 76 participants, resulting in a
2.3 Cognitive measures
2.3.1 Reading Comprehension
Reading performance was assessed using a maze-selection task at all three time points
(time point 1 n = 295, time point 2 n = 281 and time point 3 n = 216). The maze-selection
task consists of a passage in which every seventh word is deleted and replaced with three
words: the correct word and two distracters. Participants read the text silently for 2 min
and circle the words that restore meaning to the text. The final score is reported as the
number of correct selections. The maze-selection task is typically used as a part of a
progress-monitoring system referred to as Curriculum-Based Measurement (CBM; Deno,
1985). CBM is designed to be used to monitor the progress of children and youth in
academic areas such as reading. Research has supported the reliability and validity of
scores from maze-selection task as general indicators of reading performance and
progress; that is, higher scores on the maze-selection task are indicative of higher levels of
reading performance, and increases in scores on the maze-selection task are indicative of
improvements in general reading performance (see Chung, Espin, & Stevenson, 2017;
Espin, Wallace, Lembke, Campbell, & Long, 2010; Tichá, Espin, & Wayman, 2009; Wayman,
Wallace, Wiley, Tichá, & Espin, 2007;).
2.3.2 Reading Fluency
Reading fluency was assessed using a subtest of the Dutch “Three-Minute-Test” (Krum,
Jongen, Verhelst, Kamphuis, & Kleintjes, 2010). This task aims to asses technical reading
received a list of words and were instructed to read aloud as many words as possible in 1
min. The total score is defined as the number of correct words read minus the number of
incorrect words. This test showed high internal consistency (Cronbach’s alpha, dependent
on age group >.91 Krom et al., 2010).
2.3.3 Mental Counters Working Memory
Working memory capacity was measured with the Mental Counters task (Huizinga et al.,
2006), this task includes a spatial aspect as the stimuli are presented at different locations
(see an example of the task sequence in Peters et al, 2016). This task was assessed at all
three time points. The task was completed by 288 participants at time point 1, 279
participants at time point 2 and 213 participants at time point 3.
In this task participants are instructed to keep numerical information online. A computer
screen showed two independent “counters”, which were represented by two horizontal
bars on the left and right of the screen. The value of each counter was updated if a square
appeared above (+1) or below (-1) the bar. The square appeared rapidly and in random
order above or below one of the counters. The participants were explicitly instructed to use
a verbal counting strategy, updating the values of both counters (e.g., 0-1, 1-1, 1-2, etc.). As
soon as one of the counters reached a criterion value (3 or 5), the participants could
indicate this with a left or right button press. There were two blocks consisting of 15 series
each. Within each series 5 or 7 stimuli were presented (blocks that appeared randomly and
equiprobably above one of the counters). The interval between the squares varied from
when the criterion was reached. The main dependent variable was the proportion of
correct trials.
2.3.4 Behaviour Rating Inventory of Executive Function
Two versions of the Behaviour Rating Inventory of Executive Function (BRIEF) were
assessed: in participants younger than 18 years old, a parent assessment was completed in
62% of the time points; in participants older than 18 years, a self-report questionnaire was
assessed. This self-report questionnaire was completed in 60% of the visits where
participants were 18 years or older. The BRIEF questionnaire is developed to assess
everyday manifestations of executive control functions (Gioia et al., 2000a; Gioia et al.,
2002b). It includes eight subscales: Inhibit (inhibiting distractions and interference);
Emotional Control (emotional regulation); Shift (flexibly shifting to new actions); Working
Memory (short-term memory); Initiate (initiating action at an appropriate time/context);
Plan/Organization (anticipating, planning); Organization of Materials (getting the materials
necessary for the planned actions); and Monitor (monitoring the action process through
internal and external feedback). These executive functions refer to a collection of abilities
that direct and control goal-oriented cognitive, behavioural and emotional function. It is
thought to be of high ecologically validity that allows for a “real-world” snapshot of
executive function that includes aspects of complex, everyday problem-solving demands. A
higher score on these subscales indicates more difficulties/problems. The BRIEF has
demonstrated good reliability, with high test-retest reliability (0.82 for parent report), high
2.4 Analysis
2.4.1 Intra-class correlations
To test the intra-individual variation for each behavioural measure we tested for
homogeneity of the data in this longitudinal sample using intra class correlations (ICC)
after controlling for age using generalized additive mixed modelling (described in the next
section). Residual values were used to compute ICC values by estimating a null model
including a random intercept for each participant. The variance of the intercept is divided
by the sum of the variance in intercept and residual variance. The interpretation of high
values were ICC > .75, moderate values .50 - .75, and small ICC values < .50 (Koo and Li,
2016). Task based reading measures showed moderate variation, where mental counter
working memory showed small ICC (see Table 2A). All parent report real-life EF
assessments had moderate ICC values. Self report real-life EF assessment had small
(shifting and emotional control) to moderate ICC values (see Table 2B).
In addition, correlation analysis between different sets of variables were performed. This
allowed us to investigate how the task based measures relate to real-life assessments of EF
using questionnaire data.
2.4.2 Generalized additive mixed modeling
To assess age and sex effects on brain and EF measures, generalized additive mixed
modelling (gamm) was used using the mgcv R package (Wood 2004; 2017). See also
(Wierenga et al., 2018). In short, three models were compared: 1) A model including age as
a smooth function (model 1); 2) a model including a main effect of both age and sex (model
denote !"#of the individual $ at time point &. Each cognitive measure is modelled as a
smooth function of !"#plus a random person effect 'iplus error:
(ij = *++ -. !"#ij + 'i + #//0/ij (model 1)
(ij = *++ *. 1#2i + -. !"#ij + 'i + #//0/ij (model 2)
(ij = *++ *. 1#2i + -. !"#ij + -3 !"#ij 1#2 + 'i + #//0/ij (model 3)
here -.is the essential arbitrary smooth functions, where the linear combination of
piecewise cubic 4-spline functions 5 is set to 4. In addition, *+ denotes the random
interecepts and *. denotes the parameter estimate of sex. In model 3 we tested whether
there was an effect of sex by age, where -6 allows to test whether the smooth functions for
males and females differ. These three models were compared using the Bayesian
Information Criterion (BIC), the model with the smallest BIC value was selected as the
best-fit model.
2.4.3 Computation of Subject-based Cortical Maturation index
For each subject that had data of three time points (N = 168) for each region of interest
789: (max $ = 68), we defined the maturational index (;9:) as the average slope values for
that 789: between time points <
. and <3 and between time points <3 and <=. In brief, this
holds the following steps:
Let us consider cortical thickness values between time points <. and <3 for 789:. The slope
for the straight line joining cortical thickness values for 789: between time points <
. and <3
is computed as
where @ℎ$B5.: and @ℎ$B5
3: correspond to the average cortical thickness for 789: for time
points <. and <3 respectively.
We repeat the above procedure for time points <3 and <= to obtain ->0?#3=: . And next
compute ;9: of 789: as the average of the two slopes
;9: = ->0?#.3: + ->0?#3=: 2
2.4.5 Variance ratio
To test for sex differences in variance ratio, behavioural measures were averaged across all
time points. Also, mean brain measures (cortical thickness and surface area) were averaged
across three time points. Next, measures were age adjusted for mean age, using random
forest regression modelling, see Bremen (2001) and Wierenga et al., (2017). Note that
maturation Index measures were not adjusted for age.
The differences in variance between males and females was examined where letting
denote the observed outcome observation number i and its predicted outcome, the
residuals were then formed:
.
The standard deviations and were computed separately for males and
females, and used to form the test statistic
.
i
y
ˆi y
ˆ
i i i
r = y -y
males
SD SDfemales
/
males females
For each outcome, a permutation test of the hypothesis that the sex specific standard
deviations were equal was performed. This was done by random permutation of the sex
variable among the residuals. Using B permutations, the p-value for the k-th outcome was
computed as
,
where is an indicator function that is 1 when , and 0 otherwise. Thus, the
p-value is the proportion of permuted test statistics ( ) that were greater than the
observed value T of the test statistic above. Here B was set to 10 000.
The number of comparisons were taken into account by an additional combined test across
all outcomes. This was performed for cortical mean surface area and thickness measures
and MI measures, using the test statistic
with the permutation distribution of T constructed as described in Pesarin (2001).
2.4.6 Effect Size and Bayes factor
The effect size of sex differences in behavioural measures were assessed by including age
corrected values (random forest regression modelling) averaged across all time points.
Cohen’s D was used to assess the size of the sex difference in EF. Small effect sizes were in
the range of .11- .35, moderate effect sizes are between .36 and .65, and large effect sizes
are within .66-1.00 range.
In addition, we performed Bayesian analysis of the mean difference. To do so we used the
BayesFactor package for R (Morey & Rouder, 2015). This package computes BF10 values
1
( ) /
B
k b
b
p I T T B
=
=
å
³( b )
I T ³T Tb ³T
b
T
log( )k k
from a Bayesian t-test, where values >1 may be interpreted as stronger support for the alternative than NULL hypothesis.
2.4.7 Mediation analysis
To test whether sex differences in brain development mediate sex differences in EF, a
bootstrapped multiple mediation analysis were performed in R using the lavaan package
(Preacher and Hayes, 2004, 2008; Roseel, 2012). The data is recurrently sampled to
estimate indirect effect in each resampled dataset (B = 1000). Cortical brain estimates
(surface area and thickness measures) that showed sex differences in developmental
trajectories were included as potential mediators of the effects between sex and cognition.
For these brain estimates we used MI in as a potential mediator. Cognitive measures that
showed significant sex effects were included in the model, and were averaged across all
time points and age adjusted using random forest regression modelling.
2.4.8 Brain age prediction modeling
Brain age predictions are estimated using random forest modelling, this machine learning
algorithm is based on model aggregation introduced by Breiman (2001). The principle of
random forests is to combine many binary decision trees using several bootstrap samples
coming from a learning sample G and choosing randomly at each node a subset of
explanatory variables. At each node, a given number (denoted by H</() of input variables
are randomly chosen and the best split is calculated only within this subset. Model fits were
In this model we aim to predict age at time point 3 (follow-up), this allowed us to compare
models including static brain measures in addition to measures of development. As such,
input variables included cortical surface area and cortical thickness measures at time point
3, for both lobes and all 68 regions of the Desikan-Killiany atlas (DK-atlas) (Desikan et al.,
2006; Klein & Tourville, 2012). In addition, developmental trajectories (assessed by MI as
described above) of each of the ROIs were included. We first explored whether an
increased resolution improved model fit by comparing the 4 lobe division to the DK atlas.
We next studied whether cortical thickness, cortical surface area or a combined model
would better predict age. Next, we investigated whether adding information on
developmental trajectories (MI) would improve model fit, by comparing mean absolute
error (MAE) estimates, averaged over the 2 folds.
Sex difference in brain age error were assessed using variance ratio, effect sizes and Bayes
factor as described above. Furthermore, we tested whether brain age predictions explain
individual variation in cognitive measures, to do so we used gam modelling to relate age
corrected average cognition scores to brain age error (predicted brain age minus
chronological age).
3.
Results
3.1 Sex effects on cortical brain development
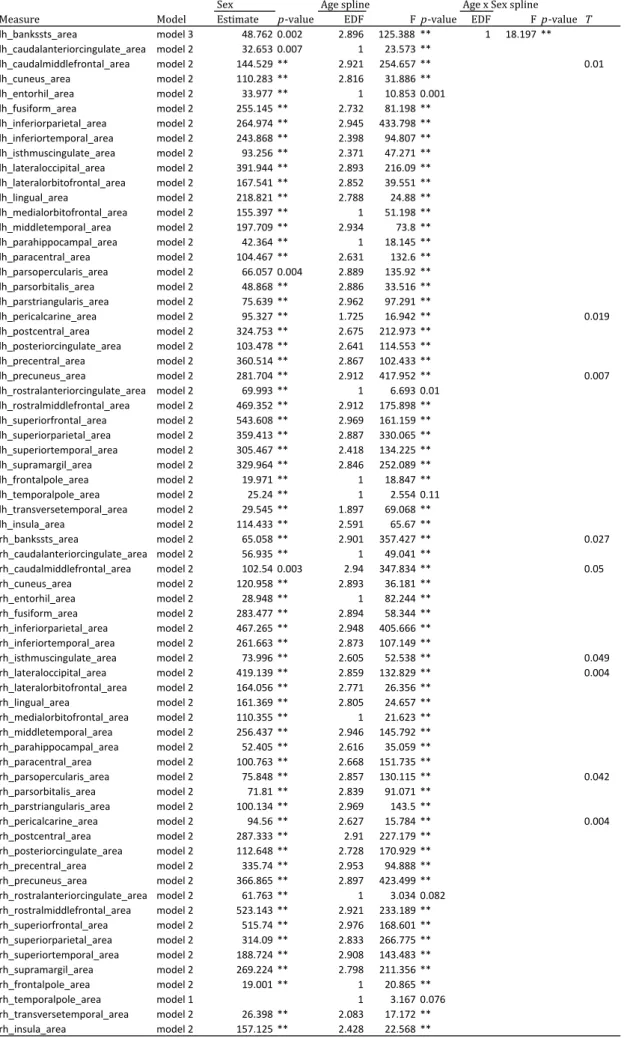
3.1.1 Developmental and sex effects. As expected, almost all age effects were significant with exception of the rostral anterior cingulate surface area and thickness of the pericalcarine
curvilinear age-related declines. Main effects of sex on surface area were observed in all
cortical regions, where males showed larger surface area. For most regions, there was no
main effect of sex on thickness values, with exception of the left pars triangularis, bilateral
rostral middle frontal region, right inferior and superior parietal regions, with greater male
than female thickness.
The next question we examined was whether boys and girls showed differences in
developmental patterns across the cortical mantle. Model 3 (including the age by sex
interaction effect) was never the best fitting model with the exception of one structure: the
surface area of the left banks superior temporal gyrus. This region showed a steeper
decline in boys than girls (see Figure 1 and Table 3A). For the following regions, we
observed significant age by sex interaction effects showing steeper declines for boys than
girls, but this was not the best fitting model: surface area of the bilateral caudal middle
frontal gyrus, left pericalcarine gyrus, left precuneus, right banks superior temporal gyrus,
right isthmus cingulate gyrus, right lateral occipital cortex, right pars opercularis, right
pericalcarine region (see Table 3A). Thickness showed significant age by sex interaction
effects (but not best model fits) for the bilateral posterior cingulate gyrus, bilateral rostral
anterior cingulate gyrus, left medial orbitofrontal gyrus, right inferior parietal gyrus, right
middle temporal gyrus, and right frontal pole (see Table 3B).
3.1.2 Sex effects in variance. Next, we assessed sex differences in variance for mean surface area and mean thickness (averaged across three time points). Mean surface area did not
show significant sex differences in overall variance (? = .0617). However, regional effects
variance in surface area: right caudal anterior cingulate gyrus, left precentral region, left supra marginal region, right banks superior temporal gyrus, left middle temporal gyrus and
right inferior parietal gyrus (see Figure 2A). Cortical thickness did not show a significant
difference in overall variance between boys and girls (? = .299). However, regional average
thickness effects showed variance differences favoring males in the following regions: right temporal pole, left superior frontal gyrus, left insula, right isthmus cingulate gyrus, and left
pars opercularis. In addition, there were regions that showed significant greater female
than male variance in cortical thickness including the right superior parietal gyrus, right
middle temporal gyrus left lateral occipital gyrus and right rostral middle frontal gyrus (see
Figure 2B).
As a next step, we compared variance of boys and girls for cortical brain development,
using the maturation index (MI). Separate analyses were performed for cortical surface
area and thickness development. A combined ?-value did not show sex differences in
overall variance of surface area MI (? = .073) or thickness MI (? = .126). However, regional
variance effects again showed greater male than female variance in maturation in surface
area of the left insula, right posterior cingulate gyrus, and right precentral gyrus and
thickness of the left medial orbitofrontal gyrus, right lateral occipital gyrus, right precentral gyrus, right temporal pole. In addition, significant greater female than male variability was
observed for surface area of the rostral anterior cingulate gyrus and supra marginal gyrus,
3.2 Sex effects on ‘Brain age’ predictions
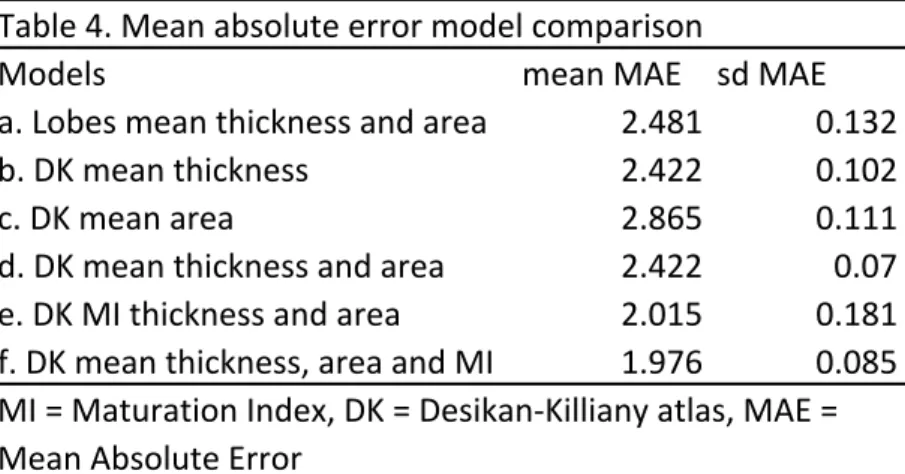
3.2.1 Model selection. Results show that the DK atlas (d) yielded better age predictions than a parcellation based on the four lobes (a). This indicates that regional heterogeneity in
cortical measures led to improved prediction performance (see Table 4). Cortical thickness
(b) showed better performance than surface area (c) yet a combined model (d) had the
best model fit (mean MAE = 2.422, sd MAE = .070). A model including information on
developmental trajectories (MI) (e) showed even better model fit than models including
brain measures at time point 3 only (follow-up) (mean MAE = 2.015, sd MAE = .181).
Nevertheless, a combined model (f) including both information on maturation (MI) and
follow-up estimates showed the best performance (mean MAE = 1.976, sd MAE = .085).
This indicates that MI holds additional information on developmental stage. As such, model
f was used for further analysis.
3.2.2 Sex effects. Model f included 270 brain estimates of mean cortical thickness and surface area in addition to maturational index of 68 cortical brain regions. This model
accounted for almost 80% of the individual differences in brain structure and variability
(Rho = .7964, Adjusted R-squared = .7952, see Figure 4). There was significant greater
male variance in brain age error (?-value = .013). Note that this was significant in the
absence of a mean sex difference in brain age error (?-value = .159).
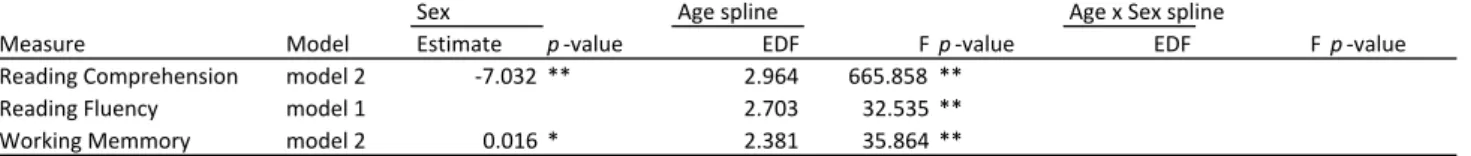
3.3 Sex effects and age effects in EF
3.3.1 Developmental and sex effects. Mental counter working memory, reading
(see Table 5A and Figure 5A). In addition, main effects of sex were observed (model 2).
Girls performed significant better than boys on reading comprehension and boys
performed better than girls on the mental counters working memory task. Reading fluency
showed no differences between boys and girls. There were no significant age by sex
interaction effects.
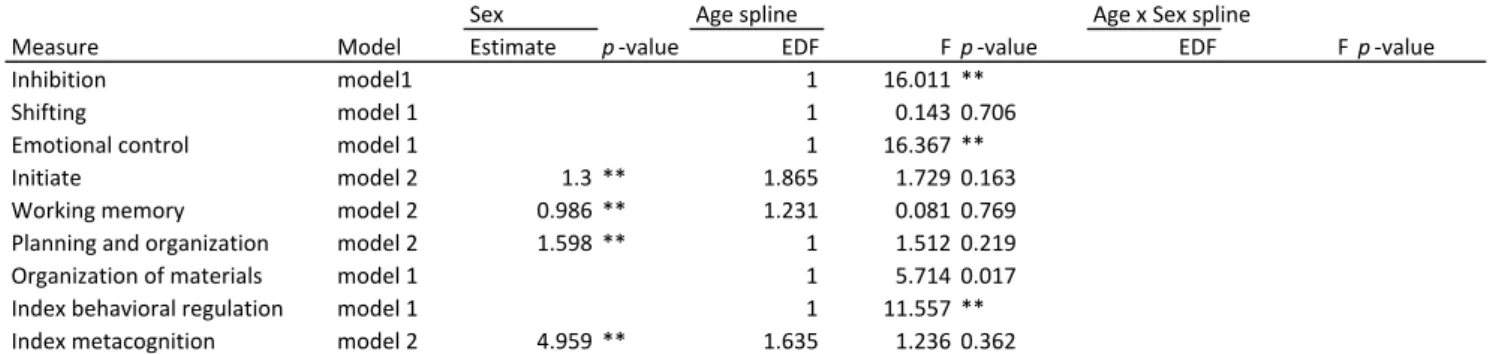
BRIEF parent-report measures showed significant age-related improvement, indicated by a
negative age-related change in inhibition, emotional control, and behavioural regulation
(see Table 5B and Figure 5B). Stable sex effects (model 2) were observed for initiative,
working memory, planning and organization and metacognition, where girls scored
significant lower than boys, indicating fewer problems in these domains. There was no
significant interaction effect between age and sex.
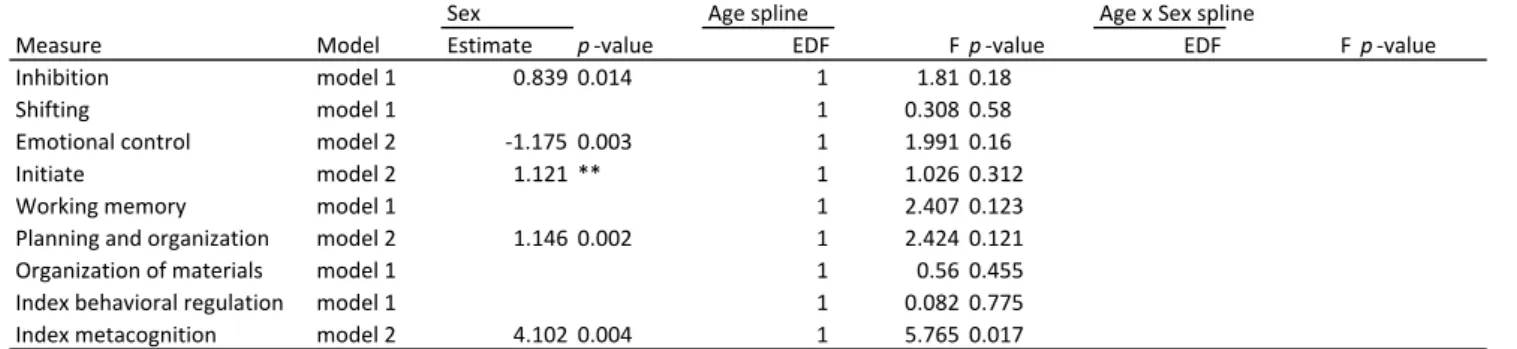
BRIEF self-report measures showed no significant change with age, with exception of
metacognition, which showed an improvement with increasing age (see Table 5C and
Figure 5C). In addition, similar to parent report measures stable sex effects (model 2) were
observed for initiative, planning and organization and metacognition. Additionally, stable
sex effects were observed for inhibition (lower scores in females) and emotional control
(lower scores in males). There were no significant age by sex interaction effects for any of
these measures.
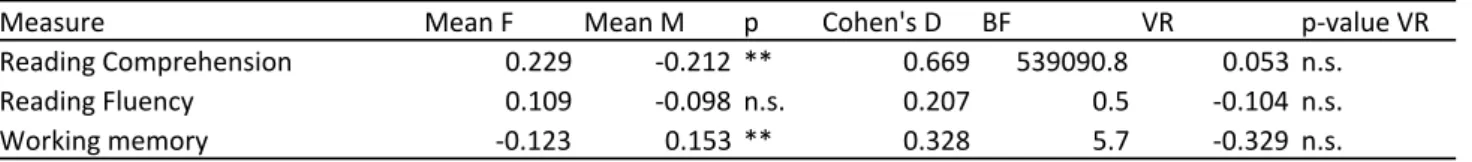
3.3.2 Effect sizes and variance differences. Next, we tested the size of sex effects in addition to variance differences between males and females on average age adjusted cognitive
measures, by averaging scores across time points (Tables 6A-C). Effect sizes of sex effects
memory (d = .328). None of the cognitive tasks showed significant sex differences in variance (Table 6A).
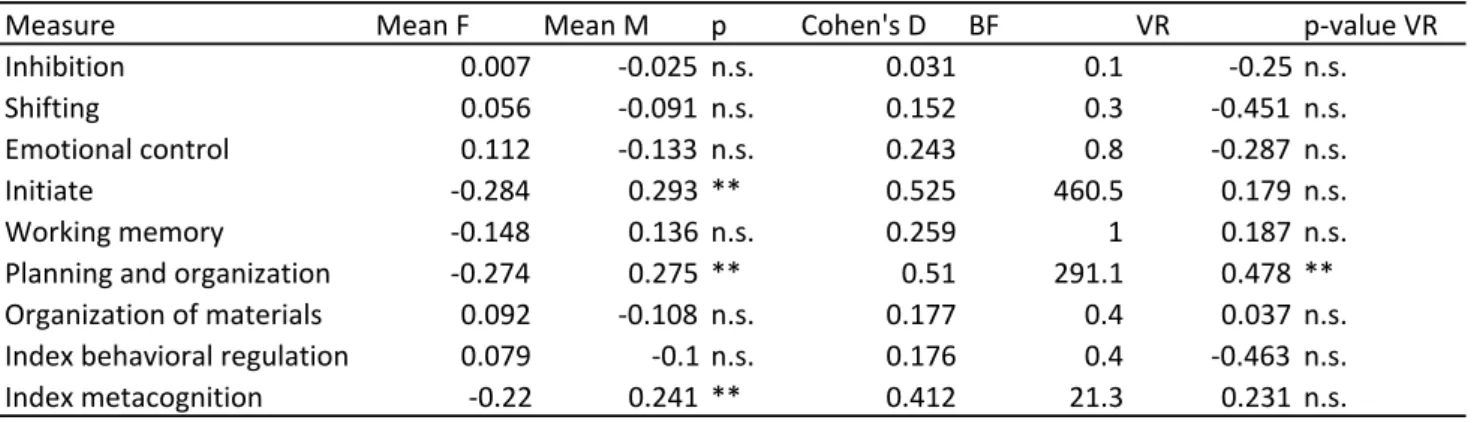
Parent report on the BRIEF questionnaire showed moderate effect sizes of sex differences
in initiative (d = .525), working memory (d = .259), planning and organization (d = .510)
and metacognition (d = .412) (Table 6B). For the other scales, bayes factors were <1,
supporting the null mode of no significant sex differences. In addition, there was significant
greater male than female variance for planning and organization.
Self-report measures of EF showed medium effect sizes for sex differences in inhibition (d =
.469), initiative (d = .451), planning and organization (d = .617) and metacognition (d
=571). In addition, greater male variance was observed for planning and organization. For
the other scales, bayes factors were <1, supporting the null model of no significant sex
differences. Furthermore, significant greater male variance effects were observed in
shifting, in the absence of a mean sex difference.
3.3.3 Correlation matrix EF measures. Significant correlations between all cognitive
measures (?-value < .05) are shown in Figure 6. Strong correlations were observed within
the different scales of the BRIEF subscales (range r: .17 - .92). Moderate correlations were
observed between tasks and BRIEF data (range r: .14 - .61 ), where stronger correlations
were observed for reading comprehension and fluency (r = .61) than mental counters
working memory (range r: .13 - .38).
To test whether the observed sex differences in brain maturation were related to sex
differences in cognition, we performed a bootstrap mediation analysis. It was tested
whether sex differences in MI of surface area development of the left banks superior
temporal gyrus mediated the sex differences in EF measures. We additionally tested
whether any other of the brain measures that showed significant interaction effects (but
not best fit for model 3) between age and sex mediated sex differences in behaviour. None
of the indirect effects were significant.
3.5 EF effects on ‘Brain age’ predictions
We tested using gam modelling whether individual variation in cognitive measures
(averaged across time points and age corrected) were related to the brain age error
prediction model. There were no significant relations between brain age error and
cognitive measures.
4.
Discussion
The aim of this study was to unravel several inconsistencies concerning sex differences in
brain development based on prior studies (Lenroot et al., 2007; Tamnes et al., 2013;
Wierenga et al., 2014). We confirmed age-related changes in brain development as shown
in prior studies (Tamnes et al. 2013; Wierenga et al., 2014), and confirmed main sex
differences in brain sizes (Kaczkurkin et al., 2018; Ruigrok et al., 2014), but we
disconfirmed the presumed age by sex interaction in brain development, except for one
cortical brain regions in the temporal cortex. However, we confirmed and extended
Wierenga et al., 2017) by showing greater male variance in brain both structure and
development of cortical thickness and surface area, as a larger number of regions showed
significant greater male than female variance in cortical maturation. This was further
supported by the findings on ‘brain age’ predictions, that showed greater male than female
variance. These results show that sex differences in variance are present in the absence of
average sex differences in brain structure. Furthermore, behavioural outcomes favoured
girls for reading and boys for mental counters working memory, but these results were not
consistently related to brain development trajectories. The latter finding may suggest that
average sex differences in cognition are more strongly related to experience than biological
predispositions.
The focus on EF measures was driven by the implications that these findings may have for
educational settings. Indeed, consistent with many prior studies, this longitudinal study
confirmed significant developmental improvements in all three cognitive tasks: mental
counters working memory, reading comprehension and reading fluency. Similar
developmental improvements were observed for parent-reported and self-reported EF
measures, which, showed significant improvement in a number of domains including:
inhibition, emotional control and behavioural regulation. All observed sex effects in
cognition were stable across development, where girls in general performed better at
reading comprehension, initiative, working memory, planning and organization and
metacognition. In older individuals (>18 years of age) females reported better performance
of inhibition than males. The effect sizes of these female biased cognitive measures were
small to moderate (Cohen’s d: .412 - .617). Males, on the other hand performed better at
emotional control (> 18 years), although the latter effect was no longer significant when
averaged across time points.
An important question that we aimed to address was whether there was evidence that the
observed sex differences in performance and EF reports were related to brain
development. First of all, we showed that brain age prediction models were improved by
including information on developmental trajectories, this improved age prediction with 0.5
years precision. This confirms the added value of longitudinal assessment over single
assessments (Foulkes and Blakemore, 2018). We found no evidence that male brains were
estimated ‘younger’ than female brains, although there was significant greater male
variance in estimations of brain age than in females, consistent with prior reports(Ritchie
et al., 2017b; Wierenga et al., 2017). Most importantly, we found no evidence for an
association between cognition and brain age error, which corresponds with earlier findings
in two cross-sectional samples with overlapping age ranges on cognitive performance (Ball
et al., 2017.; Brown and Jernigan, 2012).
Taken together, we observed sex differences in behavioural cognitive performance, and sex
difference in brain variance, but no evidence for a relation between these two patterns.
Previous studies have linked the variance effect in cortical thickness to genetic
components. As such the results may reveal target regions where cortical thickness
development is under control of X-linked genes (e.g. medial orbitofrontal cortex, precentral
gyrus, temporal pole, post central gyrus). This is in line with research showing that,
independent of e.g. social factors or sex steroids, X-chromosome linked genes play a
differences. For example, X-linked genes show relatively high expression rates in brain
tissue compared to somatic tissue (Graves et al. 2002; Nguyen and Disteche 2005).
Given that these effects are not significantly related to cognitive outcomes suggests this
relation warrants further investigation, as relations may exist with other behavioural
outcomes such as those associated with male-dominant psychiatric disorders. Identifying
where and in what way male and female brains differ and how this relates to behaviour will
help illuminate associated mechanisms. This is important to for example our
understanding of sex differences in the prevalence of neurodevelopmental disorders (Bao
and Swaab, 2010).
The presence of sex differences in cognitive performance without a clear relation to
structural brain development may suggest that boys and girls rely on different strategies to
perform EF tasks, while relying on the same neural structure. Given that some functions are
better in boys and others in girls also argues against general sex differences in cognitive
potential in the current sample. There is now increasing evidence that EF can be trained
(Diamond and Lee, 2011), which is correlated with difference in neural recruitment as
measured with functional MRI (Erickson et al., 2006). Possibly, the sex differences are
therefore the result of different cognitive experiences or parental expectations, although
this is still a speculative interpretation that should be addressed in future research. A
better understanding of sex differences could promote cognitive potential in developing
individuals and address pressing societal issues, such as education programs that are based
on a presumed difference in brain development between boys and girls.
This study has a number of strengths, including a large sample, longitudinal assessments of
study explored sex effects beyond mean differences by including variance analysis.
However, the study also had a number of limitations. First, two tasks (Reading
comprehension and mental counters working memory) showed potential ceiling effects in
performance. Although there are a number of procedures described in the literature to deal
with such effects (excluding top scores e.g. log transformations) these procedures are all
suboptimal. Moreover, they may introduce systematic bias that may relate to our variables
of interest (e.g. reading comprehension scores would be affected to a larger extend in girls
than boys). As such, our findings should be interpreted with caution. Second, the size of our
sample may be limited to detect variance effects in brain developmental trajectories. It is
therefore encouraged to replicate these findings in a larger longitudinal dataset. Last, an
increased sample size of longitudinal data could also improve our brain age prediction
model as previous studies showed that larger (but cross-sectional) datasets had improved
MAE (Ball et al., 2017; Brown et al., 2012). A prior study showed that brain development in
the orbitofrontal cortex was influenced by testosterone levels, with different relations to
behavioural measures in boys and girls (Peper et al. 2013). It would be interesting in future
studies to not only look at age developmental trajectories but also take into account
measures of puberty in relation to behavioural development.
In conclusion, the results of this study do not support the hypothesis of sex difference in
cortical development trajectories. The only structure showing a sex difference in cortical
maturation did not relate to sex differences in cognition. We did however extend previous
findings of greater variability in male brain structure by showing greater male than female
variability in cortical development. Observed performance differences in cognition may be
research. Our study provides a novel perspective in order to better understand
References
Anderson, P., 2010. Assessment and Development of Executive Function (EF) During
Childhood. Child Neuropsychology 8, 71–82. doi:10.1076/chin.8.2.71.8724
Ball, G., Adamson, C., Beare, R., Seal, M.L., - the Pediatric Imaging, Neurocognition and
Genetics, n.d. Modelling neuroanatomical variation due to age and sex during childhood
and adolescence. doi:10.1101/126441
Bao, A.M., Swaab, D.F., 2010. Sex Differences in the Brain, Behavior, and Neuropsychiatric
Disorders. The Neuroscientist 16, 550–565. doi:10.1177/1073858410377005
Becht, A.I., Bos, M.G.N., Nelemans, S.A., Peters, S., Vollebergh, W.A.M., Branje, S.J.T., Meeus,
W.H.J., Crone, E.A., 2018. Goal-Directed Correlates and Neurobiological Underpinnings
of Adolescent Identity: A Multimethod Multisample Longitudinal Approach. Child Dev
89, 823–836. doi:10.1111/cdev.13048
Brown, T.T., Jernigan, T.L., 2012. Brain Development During the Preschool Years.
Neuropsychol Rev 22, 313–333. doi:10.1007/s11065-012-9214-1
Brown, T.T., Kuperman, J.M., Chung, Y., Erhart, M., McCabe, C., Hagler, D.J., Venkatraman,
V.K., Akshoomoff, N., Amaral, D.G., Bloss, C.S., Casey, B.J., Chang, L., Ernst, T.M., Frazier,
J.A., Gruen, J.R., Kaufmann, W.E., Kenet, T., Kennedy, D.N., Murray, S.S., Sowell, E.R.,
Jernigan, T.L., Dale, A.M., 2012. Neuroanatomical assessment of biological maturity.
Curr. Biol. 22, 1693–1698. doi:10.1016/j.cub.2012.07.002
Bunge, S.A., Zelazo, P.D., 2006. A brain-based account of the development of rule use in
childhood. Current directions in psychological science 15, 118–121.
Chung, S., Espin, C.A., & Stevenson, C.E. (2018). CBM maze-scores as indicators of reading
10.1007/s11145-017-9803-8
Crone, E.A., Steinbeis, N., 2017. Neural Perspectives on Cognitive Control Development
duringChildhood and Adolescence. Trends in Cognitive Sciences 1–11.
doi:10.1016/j.tics.2017.01.003
Desikan, R.S., Ségonne, F., Fischl, B., Quinn, B.T., Dickerson, B.C., Blacker, D., Buckner, R.L.,
Dale, A.M., Maguire, R.P., Hyman, B.T., Albert, M.S., Killiany, R.J., 2006. An automated
labeling system for subdividing the human cerebral cortex on MRI scans into gyral
based regions of interest. NeuroImage 31, 968–980.
doi:10.1016/j.neuroimage.2006.01.021
Diamond, A., 2000. Close interrelation of motor development and cognitive development
and of the cerebellum and prefrontal cortex. Child Dev 71, 44–56.
Diamond, A., Lee, K., 2011. Interventions Shown to Aid Executive Function Development in
Children 4 to 12 Years Old. Science 333, 959–964. doi:10.1126/science.280.5370.1711
Dosenbach, N.U.F., Nardos, B., Cohen, A.L., Fair, D.A., Power, J.D., Church, J.A., Nelson, S.M.,
Wig, G.S., Vogel, A.C., Lessov-Schlaggar, C.N., Barnes, K.A., Dubis, J.W., Feczko, E.,
Coalson, R.S., Pruett, J.R., Barch, D.M., Petersen, S.E., Schlaggar, B.L., 2010. Prediction of
Individual Brain Maturity Using fMRI. Science 329, 1358–1361.
doi:10.1126/science.1194144
Else-Quest, N.M., Hyde, J.S., Goldsmith, H.H., Van Hulle, C.A., 2006. Gender differences in
temperament: A meta-analysis. Psychol Bull 132, 33–72.
doi:10.1037/0033-2909.132.1.33
Erickson, K.I., Colcombe, S.J., Wadhwa, R., Bherer, L., Peterson, M.S., Scalf, P.E., Kim, J.S.,
Dual-Task Processing: An fMRI Study. Cereb. Cortex 17, 192–204.
doi:10.1093/cercor/bhj137
Erus, G., Battapady, H., Satterthwaite, T.D., Hakonarson, H., Gur, R.E., Davatzikos, C., Gur,
R.C., 2015. Imaging patterns of brain development and their relationship to cognition.
Cereb. Cortex 25, 1676–1684. doi:10.1093/cercor/bht425
Espin, C.A., Wallace, T., Lembke, E., Campbell, H., & Long, J.D. (2010). Creating a progress
measurement system in reading for middle-school students: Monitoring progress
towards meeting high stakes standards. Learning Disabilities Research and Practice, 25,
60-75. DOI: 10.1111/j.1540-5826.2010.00304.x
Espin, C.A., Chung, S., Foegen, A., & Campbell, H. (2017). Curriculum-Based Measurement
for secondary-school students. In M. Kennedy & P. Pullen (Eds.), Handbook of Response
to Intervention and Multi-Tiered Instruction. New York, NY: Routledge.
Foulkes, L., Blakemore, S.-J., 2018. Studying individual differences in human adolescent
brain development. Nat. Neurosci. 21, 315–323. doi:10.1038/s41593-018-0078-4
Gunzenhauser, C., Suchodoletz, von, A., 2015. Boys Might Catch Up, Family Influences
Continue: Influences on Behavioral Self-Regulation in Children From an Affluent Region
in Germany Before School Entry. Early Education and Development 26, 645–662.
doi:10.1002/cne.920180503
Howard-Jones, P.A., 2014. PERSPECTIVES. Nature Publishing Group 15, 817–824.
doi:10.1038/nrn3817
Huizinga, M., Dolan, C.V., van der Molen, M.W., 2006. Age-related change in executive
function: Developmental trends and a latent variable analysis. Neuropsychologia.
Neurobiology 38, 53–56. doi:10.1016/j.conb.2016.02.007
Kaczkurkin, A.N., Raznahan, A., Satterthwaite, T.D., 2018. Sex differences in the developing
brain: insights frommultimodal neuroimaging. Neuropsychopharmacology 1–15.
doi:10.1038/s41386-018-0111-z
Khundrakpam, B.S., Lewis, J.D., Jeon, S., Kostopoulos, P., Itturia Medina, Y.,
Chouinard-Decorte, F., Evans, A.C., 2017. Exploring Individual Brain Variability during
Development based on Patterns of Maturational Coupling of Cortical Thickness: A
Longitudinal MRI Study. Cereb. Cortex 3, e17. doi:10.1523/JNEUROSCI.2612-10.2010
Khundrakpam, B.S., Tohka, J., Evans, A.C., Brain Development Cooperative Group, 2015.
Prediction of brain maturity based on cortical thickness at different spatial resolutions.
NeuroImage 111, 350–359. doi:10.1016/j.neuroimage.2015.02.046
Koo, T.K., Li, M.Y., 2016. A Guideline of Selecting and Reporting Intraclass Correlation
Coefficients for Reliability Research. J Chiropr Med 15, 155–163.
doi:10.1016/j.jcm.2016.02.012
Lenroot, R.K., Gogtay, N., Greenstein, D.K., Wells, E.M., Wallace, G.L., Clasen, L.S., Blumenthal,
J.D., Lerch, J., Zijdenbos, A.P., Evans, A.C., Thompson, P.M., Giedd, J.N., 2007. Sexual
dimorphism of brain developmental trajectories during childhood and adolescence.
NeuroImage 36, 1065–1073. doi:10.1016/j.neuroimage.2007.03.053
Matthews, J.S., Ponitz, C.C., Morrison, F.J., 2009. Early gender differences in self-regulation
and academic achievement. Journal of Educational Psychology 101, 689–704.
doi:10.1037/a0014240
Miller, D.I., Halpern, D.F., 2014. The new science of cognitive sex differences. Trends in
Mills, K.L., Tamnes, C.K., 2014. Methods and considerations for longitudinal structural brain
imaging analysis across development. Dev Cogn Neurosci 9, 172–190.
doi:10.1016/j.dcn.2014.04.004
Peters, S., van Duijvenvoorde, A. C. K., Koolschijn, P. C. M. P., & Crone, E. A. (2016).
Longitudinal development of frontoparietal activity during feedback learning:
Contributions of age, performance, working memory and cortical thickness.
Developmental Cognitive Neuroscience, 19, 211–222. http://doi.org/10.1016/j.dcn.2016.04.004
Peters, S., Crone, E.A., 2017. Increased striatal activity in adolescence benefits learning. Nat
Commun 8, 427.
doi:10.1002/(SICI)1097-0258(19971130)16:22<2529::AID-SIM692>3.0.CO;2-J
Peper, J. S., Koolschijn, P. C. M. P., & Crone, E. A. (2013). Development of risk taking:
contributions from adolescent testosterone and the orbito-frontal cortex. Journal of
Cognitive Neuroscience, 25(12), 2141–2150. http://doi.org/10.1162/jocn_a_00445 Ritchie, S.J., Cox, S.R., Shen, X., Lombardo, M.V., Reus, L.M., Alloza, C., Harris, M.A., Alderson,
H., Hunter, S., Neilson, E., Liewald, D.C., Auyeung, B., Whalley, H.C., Lawrie, S.M., Gale,
C.R., Bastin, M.E., McIntosh, A.M., Deary, I.J., 2017a. Sex Differences In The Adult Human
Brain: Evidence From 5,216 UK Biobank Participants. bioRxiv. doi:10.1101/123729
Ritchie, S.J., Cox, S.R., Shen, X., Lombardo, M.V., Reus, L.M., Alloza, C., Harris, M.A., Alderson,
H., Hunter, S., Neilson, E., Liewald, D.C., Auyeung, B., Whalley, H.C., Lawrie, S.M., Gale,
C.R., Bastin, M.E., McIntosh, A.M., Deary, I.J., 2017b. Sex Differences In The Adult Human
Brain: Evidence From 5,216 UK Biobank Participants. doi:10.1101/123729
Suckling, J., 2014. A meta-analysis of sex differences in human brain structure.
Neuroscience & Biobehavioral Reviews 39, 34–50.
doi:10.1016/j.neubiorev.2013.12.004
Schreuders, E., Braams, B.R., Blankenstein, N.E., Peper, J.S., Güroğlu, B., Crone, E.A., 2018.
Contributions of Reward Sensitivity to Ventral Striatum Activity Across Adolescence
and Early Adulthood. Child Dev 89, 797–810. doi:10.1111/cdev.13056
Tichá, R., Espin, C.A., & Wayman, M.M. (2009). Reading progress monitoring for
secondary-school students: Reliability, validity, and sensitivity to growth of reading aloud and
maze selection measures. Learning Disabilities Research and Practice, 24, 132-142.
Wayman, M., Wallace, T., Wiley, H.I., Tichá, R., & Espin, C.A. (2007). Literature synthesis on
curriculum-based measurement in reading. Journal of Special Education, 41, 85-120.
Wierenga, L.M., Bos, M.G.N., Schreuders, E., vander Kamp, F., Peper, J.S., Tamnes, C.K., Crone,
E.A., 2018. Psychoneuroendocrinology. Psychoneuroendocrinology 91, 105–114.
doi:10.1016/j.psyneuen.2018.02.034
Wierenga, L.M., Sexton, J.A., Laake, P., Giedd, J.N., Tamnes, C.K., Pediatric Imaging,
Neurocognition and Genetics Study, 2017. A Key Characteristic of Sex Differences in the
Developing Brain: Greater Variability in Brain Structure of Boys than Girls. Cereb.
Figure legends
Figure 1. Age by sex effects on the left banks superior temporal gyrus surface area
estimated using gamm modelling. Steeper declines in surface area were observed for boys
than girls.
Figure 2. Variance ratio’s favouring males (green) and females (yellow). A) showing mean
surface area estimates of 68 cortical regions. B) showing mean thickness estimates of 68
cortical regions (desikan-killiany atlas). * ?-value < .05; ** ?-value < .01; *** ?-value < .001
Figure 3. Variance ratio’s favouring males (green) and females (yellow). A) shows MI
estimates of surface area of 68 cortical regions. B) shows MI estimates of mean thickness
estimates of 68 cortical regions (desikan-killiany atlas). * ?-value < .05; ** ?-value < .01; ***
?-value < .001
Figure 4. Anatomical prediction of age (predicted age) by chronological age for 168
individuals. The model to predict age includes estimates of 270 variables including cortical
surface area and thickens mean estimates as well as MI. Colours correspond to males
(green) and females (yellow). A linear model (solid line) between chronological age and
predicted age is plotted.
Figure 5. Best GAMM model fits of age and sex for: A) task based cognitive measures, B)
using BRIEF questionnaire. Best fit models are indicated where model 1 is a model
including age, model 2 is a model including both age and sex effects.
Figure 6. Correlation matrix between task based assessment of cognitive performance
(first three columns) and real-life assessment of EF as assed by the BRIEF questionnaire
data (parent report columns 4 to 12, self-report columns 13 to 21). Positive correlations
are indicated in red, negative correlations are indicated in purple. The stronger the
Acknowledgements
We thank all the participants for their valuable contribution to this longitudinal study.
We would additionally like to thank prof. dr. C Espin for her valuable contribution to the
cognitive task dataset. This work was supported by the European Council starting grand
Table 1. Demographics
TP1 TP2 TP3
Total n 299 299 280
Total % females 51% 51% 55%
age mean (sd) 14 (3.7) 16 (3.6) 18 (3.7) IQ mean (sd) 109 (11) 108 (10.3)
Reading comprehension n 295 281 216
% females 51% 53% 50%
mean (sd) 68 (24.2) 81 (21.2) 91 (18.2)
Reading fluency n 281 216
% females 52% 50%
mean (sd) 97 (15.0) 103 (14.8)
Working memmory n 288 279 213
% females 50% 52% 50%
mean (sd) .18 (.159) .86 (.121) .88 (.117)
BRIEF parent report n 236 201 108
% females 52% 53% 52%
BRIEF self report n 23 62 99
% females 61% 53% 51%
T1 scan n 237 245 198
% females 54% 54% 53%
Table 2A. ICC task data
Measure ICC
Reading Comprehension 0.694
Reading Fluency 0.639
Working memory 0.438
Table 2B. ICC BRIEF scores
Measure ICC
Parent report
Inhibition 0.535
Shifting 0.536
Emotional control 0.572
Initiate 0.655
Working memory 0.609
Planning and organization 0.586
Organization of materials 0.676
Index behavioral regulation 0.573
Index metacognition 0.671
Self report
Inhibition 0.683
Shifting 0.452
Emotional control 0.492
Initiate 0.6
Working memory 0.539
Planning and organization 0.544
Organization of materials 0.747
Index behavioral regulation 0.587
Index metacognition 0.704
Table 3a. Generalized additive mixed-effects models examing sex and age effects on cortical surface area measures
Sex Age spline Age x Sex spline
Measure Model Estimate p-value EDF Fp-value EDF Fp-value T
lh_bankssts_area model 3 48.762 0.002 2.896 125.388 ** 1 18.197 ** lh_caudalanteriorcingulate_area model 2 32.653 0.007 1 23.573 **
lh_caudalmiddlefrontal_area model 2 144.529 ** 2.921 254.657 ** 0.01 lh_cuneus_area model 2 110.283 ** 2.816 31.886 **
lh_entorhil_area model 2 33.977 ** 1 10.853 0.001 lh_fusiform_area model 2 255.145 ** 2.732 81.198 ** lh_inferiorparietal_area model 2 264.974 ** 2.945 433.798 ** lh_inferiortemporal_area model 2 243.868 ** 2.398 94.807 ** lh_isthmuscingulate_area model 2 93.256 ** 2.371 47.271 ** lh_lateraloccipital_area model 2 391.944 ** 2.893 216.09 ** lh_lateralorbitofrontal_area model 2 167.541 ** 2.852 39.551 ** lh_lingual_area model 2 218.821 ** 2.788 24.88 ** lh_medialorbitofrontal_area model 2 155.397 ** 1 51.198 ** lh_middletemporal_area model 2 197.709 ** 2.934 73.8 ** lh_parahippocampal_area model 2 42.364 ** 1 18.145 ** lh_paracentral_area model 2 104.467 ** 2.631 132.6 ** lh_parsopercularis_area model 2 66.057 0.004 2.889 135.92 ** lh_parsorbitalis_area model 2 48.868 ** 2.886 33.516 ** lh_parstriangularis_area model 2 75.639 ** 2.962 97.291 **
lh_pericalcarine_area model 2 95.327 ** 1.725 16.942 ** 0.019
lh_postcentral_area model 2 324.753 ** 2.675 212.973 ** lh_posteriorcingulate_area model 2 103.478 ** 2.641 114.553 ** lh_precentral_area model 2 360.514 ** 2.867 102.433 **
lh_precuneus_area model 2 281.704 ** 2.912 417.952 ** 0.007
lh_rostralanteriorcingulate_area model 2 69.993 ** 1 6.693 0.01 lh_rostralmiddlefrontal_area model 2 469.352 ** 2.912 175.898 ** lh_superiorfrontal_area model 2 543.608 ** 2.969 161.159 ** lh_superiorparietal_area model 2 359.413 ** 2.887 330.065 ** lh_superiortemporal_area model 2 305.467 ** 2.418 134.225 ** lh_supramargil_area model 2 329.964 ** 2.846 252.089 ** lh_frontalpole_area model 2 19.971 ** 1 18.847 ** lh_temporalpole_area model 2 25.24 ** 1 2.554 0.11 lh_transversetemporal_area model 2 29.545 ** 1.897 69.068 ** lh_insula_area model 2 114.433 ** 2.591 65.67 **
rh_bankssts_area model 2 65.058 ** 2.901 357.427 ** 0.027
rh_caudalanteriorcingulate_area model 2 56.935 ** 1 49.041 **
rh_caudalmiddlefrontal_area model 2 102.54 0.003 2.94 347.834 ** 0.05 rh_cuneus_area model 2 120.958 ** 2.893 36.181 **
rh_entorhil_area model 2 28.948 ** 1 82.244 **
rh_fusiform_area model 2 283.477 ** 2.894 58.344 ** rh_inferiorparietal_area model 2 467.265 ** 2.948 405.666 ** rh_inferiortemporal_area model 2 261.663 ** 2.873 107.149 **
rh_isthmuscingulate_area model 2 73.996 ** 2.605 52.538 ** 0.049
rh_lateraloccipital_area model 2 419.139 ** 2.859 132.829 ** 0.004
rh_lateralorbitofrontal_area model 2 164.056 ** 2.771 26.356 ** rh_lingual_area model 2 161.369 ** 2.805 24.657 ** rh_medialorbitofrontal_area model 2 110.355 ** 1 21.623 ** rh_middletemporal_area model 2 256.437 ** 2.946 145.792 ** rh_parahippocampal_area model 2 52.405 ** 2.616 35.059 ** rh_paracentral_area model 2 100.763 ** 2.668 151.735 **
rh_parsopercularis_area model 2 75.848 ** 2.857 130.115 ** 0.042
rh_parsorbitalis_area model 2 71.81 ** 2.839 91.071 ** rh_parstriangularis_area model 2 100.134 ** 2.969 143.5 **
rh_pericalcarine_area model 2 94.56 ** 2.627 15.784 ** 0.004
rh_postcentral_area model 2 287.333 ** 2.91 227.179 ** rh_posteriorcingulate_area model 2 112.648 ** 2.728 170.929 ** rh_precentral_area model 2 335.74 ** 2.953 94.888 ** rh_precuneus_area model 2 366.865 ** 2.897 423.499 ** rh_rostralanteriorcingulate_area model 2 61.763 ** 1 3.034 0.082 rh_rostralmiddlefrontal_area model 2 523.143 ** 2.921 233.189 ** rh_superiorfrontal_area model 2 515.74 ** 2.976 168.601 ** rh_superiorparietal_area model 2 314.09 ** 2.833 266.775 ** rh_superiortemporal_area model 2 188.724 ** 2.908 143.483 ** rh_supramargil_area model 2 269.224 ** 2.798 211.356 ** rh_frontalpole_area model 2 19.001 ** 1 20.865 **
rh_temporalpole_area model 1 1 3.167 0.076
rh_transversetemporal_area model 2 26.398 ** 2.083 17.172 ** rh_insula_area model 2 157.125 ** 2.428 22.568 **
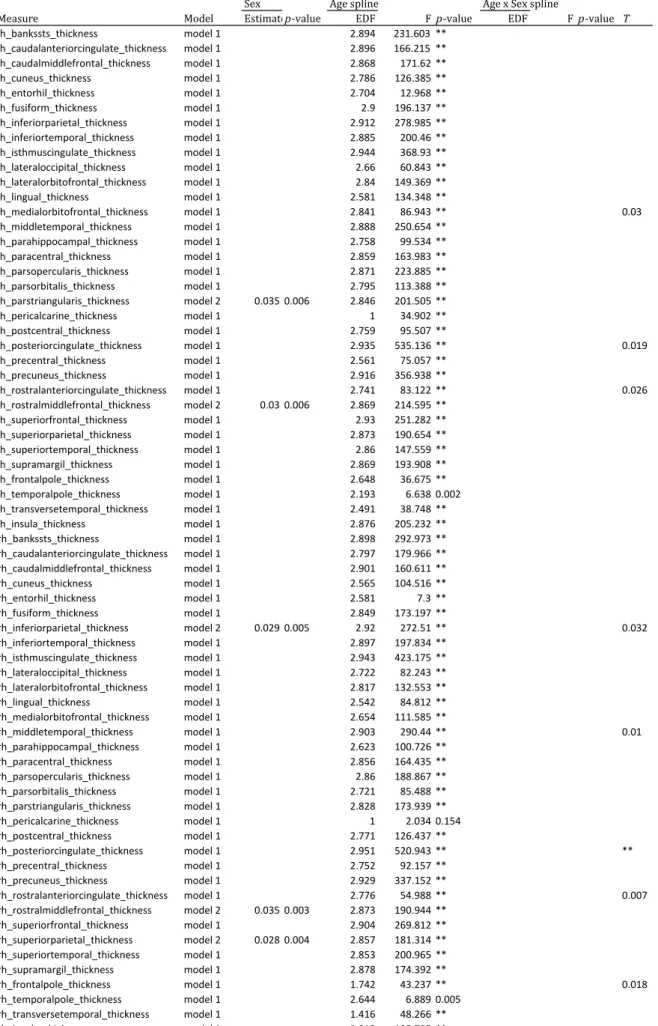
**P-Table 3b. Generalized additive mixed-effects models examing sex and age effects on cortical thickenss measures
Sex Age spline Age x Sex spline
Measure Model Estimatep-value EDF Fp-value EDF Fp-value T
lh_bankssts_thickness model 1 2.894 231.603 ** lh_caudalanteriorcingulate_thickness model 1 2.896 166.215 ** lh_caudalmiddlefrontal_thickness model 1 2.868 171.62 ** lh_cuneus_thickness model 1 2.786 126.385 ** lh_entorhil_thickness model 1 2.704 12.968 ** lh_fusiform_thickness model 1 2.9 196.137 ** lh_inferiorparietal_thickness model 1 2.912 278.985 ** lh_inferiortemporal_thickness model 1 2.885 200.46 ** lh_isthmuscingulate_thickness model 1 2.944 368.93 ** lh_lateraloccipital_thickness model 1 2.66 60.843 ** lh_lateralorbitofrontal_thickness model 1 2.84 149.369 ** lh_lingual_thickness model 1 2.581 134.348 **
lh_medialorbitofrontal_thickness model 1 2.841 86.943 ** 0.03 lh_middletemporal_thickness model 1 2.888 250.654 **
lh_parahippocampal_thickness model 1 2.758 99.534 ** lh_paracentral_thickness model 1 2.859 163.983 ** lh_parsopercularis_thickness model 1 2.871 223.885 ** lh_parsorbitalis_thickness model 1 2.795 113.388 ** lh_parstriangularis_thickness model 2 0.035 0.006 2.846 201.505 ** lh_pericalcarine_thickness model 1 1 34.902 ** lh_postcentral_thickness model 1 2.759 95.507 **
lh_posteriorcingulate_thickness model 1 2.935 535.136 ** 0.019 lh_precentral_thickness model 1 2.561 75.057 **
lh_precuneus_thickness model 1 2.916 356.938 **
lh_rostralanteriorcingulate_thickness model 1 2.741 83.122 ** 0.026 lh_rostralmiddlefrontal_thickness model 2 0.03 0.006 2.869 214.595 **
lh_superiorfrontal_thickness model 1 2.93 251.282 ** lh_superiorparietal_thickness model 1 2.873 190.654 ** lh_superiortemporal_thickness model 1 2.86 147.559 ** lh_supramargil_thickness model 1 2.869 193.908 ** lh_frontalpole_thickness model 1 2.648 36.675 ** lh_temporalpole_thickness model 1 2.193 6.638 0.002 lh_transversetemporal_thickness model 1 2.491 38.748 ** lh_insula_thickness model 1 2.876 205.232 ** rh_bankssts_thickness model 1 2.898 292.973 ** rh_caudalanteriorcingulate_thickness model 1 2.797 179.966 ** rh_caudalmiddlefrontal_thickness model 1 2.901 160.611 ** rh_cuneus_thickness model 1 2.565 104.516 ** rh_entorhil_thickness model 1 2.581 7.3 ** rh_fusiform_thickness model 1 2.849 173.197 **
rh_inferiorparietal_thickness model 2 0.029 0.005 2.92 272.51 ** 0.032 rh_inferiortemporal_thickness model 1 2.897 197.834 **
rh_isthmuscingulate_thickness model 1 2.943 423.175 ** rh_lateraloccipital_thickness model 1 2.722 82.243 ** rh_lateralorbitofrontal_thickness model 1 2.817 132.553 ** rh_lingual_thickness model 1 2.542 84.812 ** rh_medialorbitofrontal_thickness model 1 2.654 111.585 **
rh_middletemporal_thickness model 1 2.903 290.44 ** 0.01 rh_parahippocampal_thickness model 1 2.623 100.726 **
rh_paracentral_thickness model 1 2.856 164.435 ** rh_parsopercularis_thickness model 1 2.86 188.867 ** rh_parsorbitalis_thickness model 1 2.721 85.488 ** rh_parstriangularis_thickness model 1 2.828 173.939 ** rh_pericalcarine_thickness model 1 1 2.034 0.154 rh_postcentral_thickness model 1 2.771 126.437 **
rh_posteriorcingulate_thickness model 1 2.951 520.943 ** ** rh_precentral_thickness model 1 2.752 92.157 **
rh_precuneus_thickness model 1 2.929 337.152 **
rh_rostralanteriorcingulate_thickness model 1 2.776 54.988 ** 0.007 rh_rostralmiddlefrontal_thickness model 2 0.035 0.003 2.873 190.944 **
rh_superiorfrontal_thickness model 1 2.904 269.812 ** rh_superiorparietal_thickness model 2 0.028 0.004 2.857 181.314 ** rh_superiortemporal_thickness model 1 2.853 200.965 ** rh_supramargil_thickness model 1 2.878 174.392 **
rh_frontalpole_thickness model 1 1.742 43.237 ** 0.018 rh_temporalpole_thickness model 1 2.644 6.889 0.005
Table 4. Mean absolute error model comparison
Models mean MAE sd MAE
a. Lobes mean thickness and area 2.481 0.132
b. DK mean thickness 2.422 0.102
c. DK mean area 2.865 0.111
Table 5A. Generalized additive mixed-effects models examing sex and age effects on task based EF
Sex Age spline Age x Sex spline
Measure Model Estimate p-value EDF Fp-value EDF Fp-value
Reading Comprehension model 2 -7.032 ** 2.964 665.858 **
Reading Fluency model 1 2.703 32.535 **
Working Memmory model 2 0.016 * 2.381 35.864 **
Table 5B. Generalized additive mixed-effects models examing sex and age effects on parent report BRIEF data
Sex Age spline Age x Sex spline
Measure Model Estimate p-value EDF Fp-value EDF Fp-value
Inhibition model1 1 16.011 **
Shifting model 1 1 0.143 0.706
Emotional control model 1 1 16.367 **
Initiate model 2 1.3 ** 1.865 1.729 0.163
Working memory model 2 0.986 ** 1.231 0.081 0.769 Planning and organization model 2 1.598 ** 1 1.512 0.219 Organization of materials model 1 1 5.714 0.017 Index behavioral regulation model 1 1 11.557 ** Index metacognition model 2 4.959 ** 1.635 1.236 0.362