Molecular Classification and Molecular Forecasting
of Breast Cancer: Ready for Clinical Application?
James D. Brenton, Lisa A. Carey, Ahmed Ashour Ahmed, and Carlos Caldas
FromtheCancerGenomicsProgram,
DepartmentofOncology,Universityof
Cambridge,Hutchison/MRCResearch
Centre,Cambridge,UnitedKingdom; andDivisionofHematology/Oncology,
DepartmentofMedicine,Universityof NorthCarolina,ChapelHill,NC.
SubmittedJuly6,2005;accepted July19,2005.
Termsinbluearedefinedinthe glossary,foundattheendofthis
issueandonlineatwww.jco.org.
Authors’disclosuresofpotential conflictsofinterestarefoundatthe endofthisarticle.
AddressreprintrequeststoCarlos
Caldas,MD,CancerGenomicsProgram,
DepartmentofOncology,Universityof
Cambridge,Hutchison/MRCResearch
Centre,Cambridge,UnitedKingdom
CB22XZ;e-mail:[email protected].
0732-183X/05/2329-7350/$20.00 DOI:10.1200/JCO.2005.03.3845
A B S T R A C T
Profilingbreastcancerwithexpressionarrayshasbecomecommon,andit hasbeen sug-gestedthattheresultsfromearlystudieswillleadtounderstandingofthemolecular differ-encesbetweenclinicalcasesandallowindividualizationofcare.Wecriticallyreviewtwomain applicationsofexpressionprofiling;studiesunravelingnovelbreastcancerclassificationsand thosethataimtoidentifynovelmarkersforpredictionofclinicaloutcome.Breastcancermay nowbesubclassifiedintoluminal,basal,andHER2subtypeswithdistinctdifferencesin prog-nosisandresponsetotherapy.However,profilingstudiestoidentifypredictivemarkershave sufferedfrommethodologicproblemsthatpreventgeneralapplicationoftheirresults.Future workwillneedtoreanalyzeexistingmicroarraydatasetstoidentifymorerepresentativesets ofcandidategenesforuseasprognosticsignaturesandwillneedtotakeintoaccountthe newknowledgeofmolecularsubtypesofbreastcancerwhenassessingpredictiveeffects.
JClinOncol23:7350-7360.
INTRODUCTION
The management of breast cancer has been dramatically changed with the advent of widespread screening programs and the sys-tematic use of adjuvant hormonal therapy and chemotherapy. Recent data have shown that these changes are having a major impact in outcome, and despite increasing incidence, breast cancer mortality is decreasing in most of the Western world.1The recent overview of randomized adjuvant therapy trials has confirmed that systemic therapies (hormone therapy and chemotherapy) are producing cures; survival curves at 15 years show a greater separation, despite recurrence curves’ remaining almost flat after 5 years.2 Moreover the overview also confirms that tamoxifen is of benefit in only patients with
estrogen receptor (ER) –positive disease,
effectively representing a form of targeted therapy. Great excitement has also come from recent preliminary reports that appear to show the great benefit of trastuzumab
therapy either concurrent or sequential with adjuvant chemotherapy for patients
with HER2-positive tumors. These exam-ples give further credence to the old idea that breast cancers are an heterogeneous group of diseases. This has been further confirmed bymolecular profilingof breast cancers usingarray technologyshowing the biologic and clinical heterogeneity of breast cancer is explained by differences in the ge-netic composition of the primary tumors.
Here we will critically review two types of molecular profiling studies using expression array technology, those that have unraveled a novel molecular taxonomy of breast cancers and those that have attempted to use gene expres-sion analysis to predict clinical outcomes.
MOLECULAR CLASSIFICATION OF BREAST CANCER
The explosion of genomics technology has resulted in a wave of efforts to use these advances to improve patient care. This is nowhere more obvious than in breast cancer, where our inability to accurately predict relapse or response to therapy has resulted in a long history of single-marker prognostic and predictive studies. Those studies were hampered by the usual problems in marker trials such as too-small sample size, heterogeneous pa-tients, tumors, and treatments, and lack of independent validation. Added to these problems in translational trial design was the fact that clinician-researchers had little understanding of how these markers related to one an-other and little means to decide which of several prom-ising markers might be the most relevant. Expression profiling and other ‘‘-omic’’ technologies may help us be-gin to leap this hurdle. Since multiple genes are examined simultaneously without the requirement for a priori definition of relevant patterns, profiling studies can be performed even when we are somewhat ignorant of the relationships or the function of the genes examined. The results of these studies can inform both the clinician and the scientist. In this way, the usual sequence of scientific discovery followed by clinical application is streamlined, producing both clinical and scientific knowledge in parallel. In breast cancer, this is giving us a rapidly evolving understanding of the pathways respon-sible for outcome and response to therapy, and has also provided a wealth of new knowledge of targetable differ-ences in breast cancer that will be the means to better therapy in the future.
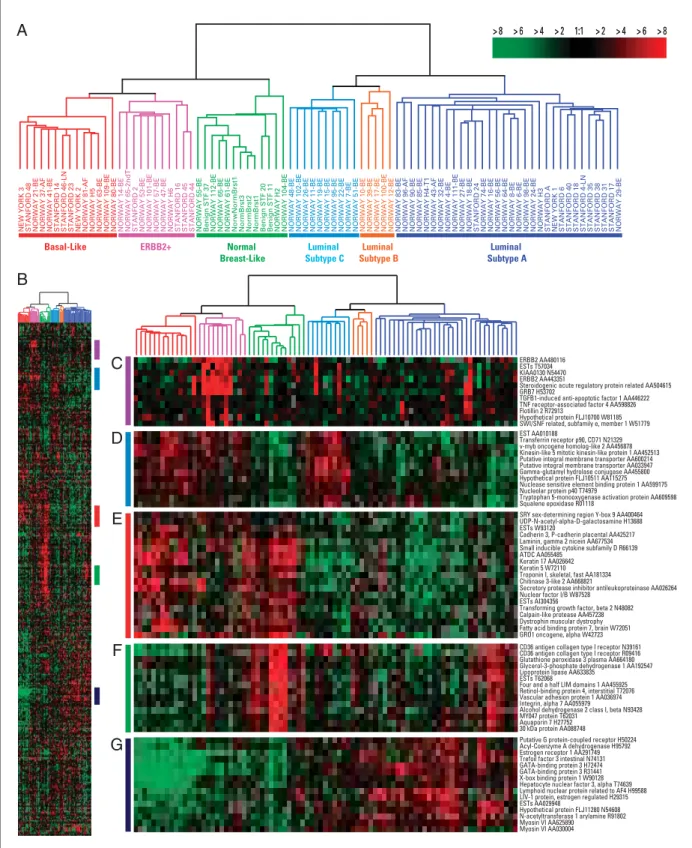
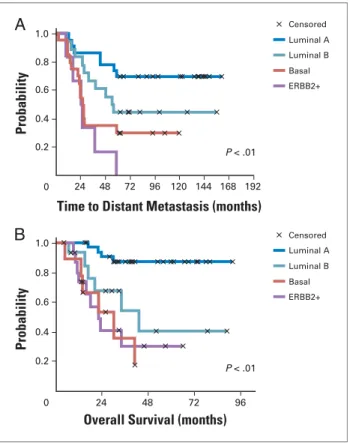
As mentioned above, the clinical impression of breast cancer heterogeneity has been proven at the gene expres-sion level.4 Using cDNA microarrays and unsupervised
(without knowledge of clinical end points)analysis, inves-tigators determined that there were breast cancer subtypes with distinctgene expression patterns(Fig 1) and different prognoses5-6 (Fig 2) that persisted in primary breast cancers as well as their metastases.7 These groups of tumors confirmed long-recognized clinical differences in phenotype, but added new knowledge regarding breast cancer biology. For example, the gene expression profiling revealed that within the ER-related tumors at least two subtypes, luminal A and luminal B, could be distinguished that vary markedly in gene expression and prognosis.5 Conversely, hormone receptor–negative breast cancer comprised two distinct subtypes, the HER2 subtype and the basal-like subtype.5,8These subtypes differ in biology
and behavior, and both show a poor outcome. Impor-tantly a very similar classification of breast cancers has now been characterized using immunohistochemistry to analyze patterns of protein expression in tumor sections and suggesting that a few protein biomarkers (eg, ER,
progesterone receptor [PR], HER2, HER1, basal
cyto-keratins) can be used to stratify breast cancers into different
groups that can be mapped to the subtypes outlined in the following sections.9-11,32
LUMINAL SUBTYPES
Expression Patterns
The luminal subtypes make up the hormone receptor– expressing breast cancers, and have expression patterns reminiscent of the luminal epithelial component of the breast.4These patterns include expression of luminal cyto-keratins 8/18, ER and genes associated with ER activation such as LIV1 and CCND1 (also known as cyclin D1).4,6 Fewer than 20% of luminal tumors have mutations in
TP53, and these tumors are often grade I.5,6Within the lu-minal cluster there are at least two subtypes, lulu-minal A and luminal B. Although both are hormone receptor express-ing, these two luminal subtypes have distinguishing char-acteristics. Luminal A has, in general, higher expression of ER-related genes and lower expression of proliferative genes than luminal B.5,8
Clinical Features
Luminal breast cancers are the most common subtype of breast cancer. In a population-based case-control study, the Carolina Breast Cancer Study, luminal breast cancers represented 67% of the tumors.12 The incidence of the best-prognosis luminal A subtype differed by race and age in that premenopausal African American women who developed breast cancer were significantly less likely to develop luminal A tumors (36%) than any other group of patients (51% to 59%). As discussed in the next section, this decreased incidence of the good-prognosis luminal A tumors among young African Americans was associated with an increase in the poor-prognosis basal-like breast cancer subtype. In addition, the luminal B tumors tend to be higher grade than luminal A tumors.
Treatment Response and Outcome
1:1 > 2 > 4 > 6 > 8 > 2
> 4 > 6 > 8
C
D
E
F
G
B
A
NEW YORK 3 STANFORD 48 NORWAY 21-BE NORWAY 37-AF NORWAY 41-BE STANFORD 14 STANFORD 46-LN STANFORD 23 NEW YORK 2 NORWAY 81-AF NORWAY H5 NORWAY 63-BE NORWAY 109-BE NORWAY 80-BE NORWAY 14-BE NORWAY 65-2ndT STANFORD 2 NORWAY 53-BE NORWAY 101-BE NORWAY 57-BE NORWAY 47-BE NORWAY H6 STANFORD 16 STANFORD 45 STANFORD 44 NORWAY 55-BE Benign STF 37 NORWAY 112-BE NORWAY 65-BE NORWAY 61-BE NorwNormBrst1 NormBrst3 NormBrst2 NormBrst1 Benign STF 20 Benign STF 11 NORWAY H2 NORWAY 104-BE NORWAY 48-BE NORWAY 102-BE NORWAY 26-BE NORWAY 11-BE NORWAY 19-BE NORWAY 15-BE NORWAY 95-BE NORWAY 22-BE NORWAY 7-BE NORWAY 51-BE NORWAY 10-BE NORWAY 39-BE NORWAY 17-BE NORWAY 100-BE NORWAY 12-BE NORWAY 83-BE NORWAY 96-AF NORWAY 90-BE NORWAY 85-BE NORWAY H4-T1 NORWAY 43-AF NORWAY 32-BE NORWAY 4-BE NORWAY 111-BE NORWAY 27-BE NORWAY 18-BE STANFORD 24 NORWAY 74-BE NORWAY 16-BE NORWAY 56-BE NORWAY 64-BE NORWAY 8-BE NORWAY 6-BE NORWAY 98-BE NORWAY 24-BE NORWAY H3 STANFORD A NEW YORK 1 STANFORD 6 STANFORD 40 STANFORD 18 STANFORD 4-LN STANFORD 35 STANFORD 38 STANFORD 31 STANFORD 17 NORWAY 29-BE
ERBB2 AA480116 ESTs T57034 KIAA0130 N54470 ERBB2 AA443351
Steroidogenic acute regulatory protein related AA504615 GRB7 H53702
TGFB1-induced anti-apoptotic factor 1 AA446222 TNF receptor-associated factor 4 AA598826 Flotillin 2 R72913
Hypothetical protein FLJ10700 W81185 SWI/SNF related, subfamily e, member 1 W51779
Putative G protein-coupled receptor H50224 Acyl-Coenzyme A dehydrogenase H95792 Estrogen receptor 1 AA291749 Trefoil factor 3 intestinal N74131 GATA-binding protein 3 H72474 GATA-binding protein 3 R31441 X-box binding protein 1 W90128 Hepatocyte nuclear factor 3, alpha T74639 Lymphoid nuclear protein related to AF4 H99588 LIV-1 protein, estrogen regulated H29315 ESTs AA029948
Hypothetical protein FLJ11280 N54608 N-acetyltransferase 1 arylamine R91802 Myosin VI AA625890
Myosin VI AA030004
SRY sex-determining region Y-box 9 AA400464 UDP-N-acetyl-alpha-D-galactosamine H13688 ESTs W93120
Cadherin 3, P-cadherin placental AA425217 Laminin, gamma 2 nicein AA677534 Small inducible cytokine subfamily D R66139 ATDC AA055485
Keratin 17 AA026642 Keratin 5 W72110 Troponin I, skeletal, fast AA181334 Chitinase 3-like 2 AA668821
Secretory protease inhibitor antileukoproteinase AA026264 Nuclear factor I/B W87528
ESTs AI304356
Transforming growth factor, beta 2 N48082 Calpain-like protease AA457238 Dystrophin muscular dystrophy Fatty acid binding protein 7, brain W72051 GRO1 oncogene, alpha W42723 CD36 antigen collagen type I receptor N39161 CD36 antigen collagen type I receptor R09416 Glutathione peroxidase 3 plasma AA664180 Glycerol-3-phosphate dehydrogenase 1 AA192547 Lipoprotein lipase AA633835
ESTs T62068
Four and a half LIM domains 1 AA455925 Retinol-binding protein 4, interstitial T72076 Vascular adhesion protein 1 AA036974 Integrin, alpha 7 AA055979
Alcohol dehydrogenase 2 class I, beta N93428 MY047 protein T62031
Aquaporin 7 H27752 30 kDa protein AA088748 EST AA010188
Transferrin receptor p90, CD71 N21329 v-myb oncogene homolog-like 2 AA456878 Kinesin-like 5 mitotic kinesin-like protein 1 AA452513 Putative integral membrane transporter AA600214 Putative integral membrane transporter AA033947 Gamma-glutamyl hydrolase conjugase AA455800 Hypothetical protein FLJ10511 AA115275 Nuclease sensitive element binding protein 1 AA599175 Nucleolar protein p40 T74979
Tryptophan 5-monooxygenase activation protein AA609598 Squalene epoxidase R01118
ERBB2+
Basal-Like Luminal
Subtype C
Normal Breast-Like
Luminal Subtype A
Luminal Subtype B
1:1 > 2 > 4 > 6 > 8
> 2 > 4 > 6 > 8
reverse transcriptase polymerase chain reaction–based 16-gene predictor of distant relapse among hormone receptor–positive node-negative patients treated with tamoxifen resulted in theRecurrence Score.15The Recur-rence Score has been shown to be prognostic in untreated patients,16predictive of lack of efficacy of tamoxifen16and predictive of response to chemotherapy.17,18 Eight of the 16 genes included in the Recurrence Score, including ER-related genes and proliferative genes, are included in the gene sets distinguishing luminal A from B (D. Oh, manuscript submitted for publication), and the data sug-gest that tumors with low Recurrence Scores are luminal A whereas those with high Recurrence Scores are luminal B. Thus, it appears that luminal A tumors may be quite ad-equately treated with endocrine therapy alone, whereas the more proliferative luminal B tumors may be those that benefit from chemotherapy added to endocrine therapy. Another pressing question is the response to tamoxifen therapy in luminal B patients since the scant data so far suggest that in the presence of tamoxifen, luminal B pa-tients do significantly worse than luminal A5,8; it may be that luminal B patients will do better if they receive an aromatase inhibitor, or it may be that they are entirely endocrine therapy refractory. Future studies will be re-quired to address this question.
There is a suggestion that other targeted approaches beyond endocrine therapy may work in luminal subtypes. The anti–vascular endothelial growth factor antibody
bevacizumab was recently shown to improve survival in
metastatic breast cancer when combined with paclitaxel.19 Intriguingly, more than 60% of the patients in that trial were hormone receptor–positive and virtually none were HER2-positive, suggesting that antiangiogenic strategies may be effective in the luminal subtypes.
HER2 SUBTYPE
Expression Patterns
The identification of a HER2-array subtype within unsupervised cluster analysis of breast cancers was re-assuring to clinicians because it confirmed the clinical impression that tumors with HER2 overexpression were systematically different from other breast cancers. The array designation of HER2 (hereafter designated HER2-array) should not be confused with HER2-positive tumors identified by immunohistochemistry or fluorescence in
situ hybridization (FISH), because not all clinically
HER2-positive tumors show the RNA expression changes that define the cluster. The HER2-array subtype refers to the larger group of hormone receptor–negative (low ex-pression of ER and related genes by array) tumors identi-fied by gene expression array. HER2-positive tumors clinically refer to those identified by immunostaining for HER2 overexpression or FISH for excess gene copy number. Most tumors that are clinically HER2-positive will fall within the HER2-array subtype. However, other tumors that are HER2 positive by immunohistochemistry or FISH will also overexpress hormone receptors, and most of these tumors fall within the luminal subtypes rather than the HER2-array subtype.5,6,8 In this section, we are referring only to the HER2-array subtype, which does not express hormone receptors. The HER2-array tumors are characterized by overexpression of other genes in the ERBB2 amplicon such as GRB7.4 Like basal-like tumors, the HER2-array subtype tumors have a high proportion, 40% to 80%, ofTP53mutations,5,12and are significantly more likely to be grade 3 (P Z.0002) than
luminal A tumors.
Clinical Features
There is no association of the HER2-array subtype with either age or race,12and no association with known risk factors. An intriguing recent analysis from the Nurses’ Health Study suggests that hormonal risk factors do not predict ER-negative breast cancer,20 suggesting that investigators in large epidemiologic studies may do well to revisit the analyses of traditional risk factors in a subtype-specific manner. Since both HER2-array and basal-like breast cancers fit in the ER-negative category,
Censored Luminal A Luminal B Basal ERBB2+ Censored Luminal A Luminal B Basal ERBB2+
A
0
Probability
0.2 0.4 0.6 0.8 1.0
P < .01
24 48 72 96 120 144 168 192
Time to Distant Metastasis (months)
0 24 48 72 96
Overall Survival (months) P < .01
B
Probability
0.2 0.4 0.6 0.8 1.0
it remains to be seen whether these risk factors also differ between the two main categories of ER-negative tumors. In addition to being more likely to be high grade and poorly differentiated, HER2-array subtype tumors were more than two-fold more likely to involve axillary lymph nodes than luminal A tumors.12
Treatment Response and Outcome
HER2-array subtype breast cancers carry a poor prog-nosis,5,6,8another finding not surprising to those working with these patients and previously demonstrated in mul-tiple single-marker studies. Despite its poor prognosis, the HER2-array subtype has also demonstrated sensitivity to anthracycline and taxane–based neoadjuvant chemo-therapy, with significantly higher pathologic complete re-sponse than luminal breast tumors (46%v7%;P⬍.001) in an M.D. Anderson Cancer Center (Houston, TX) study.13 Like the other ER-negative subtype, the basal-like, the HER2-array subtype’s poor prognosis seems to derive from a higher risk of early relapse among those without complete eradication of tumor cells.14This find-ing is in keepfind-ing with a recent retrospective examination of Cancer and Leukemia Group B (CALGB) –led chemother-apy trials. In that study, the benefits of each generation of increasing chemotherapy aggressiveness—increased anthracycline dose and intensity (CALGB 8541), taxane added to anthracycline (CALGB 9344), and increased dose density (CALGB 9741)—were largely confined to the ER-negative subset of patients.21 This suggests that the HER2 and basal-like subtypes that make up the major-ity of ER-negative tumors are the tumors that derive the most benefit from improvements in chemotherapy. Unlike the basal-like, however, the HER2-array subtype has molecularly targeted agents, including the anti-HER2 monoclonal antibody trastuzumab. The effectiveness of trastuzumab in metastatic breast cancer as well as the re-markable reduction in relapse among HER2-positive breast cancers treated with trastuzumab combined with chemotherapy supports the idea that effective tumor con-trol can be achieved with isolated targeting of this
path-way22-24 but not all HER2-positive tumors respond to
trastuzumab. PTEN loss or abrogation,25 and CXCR4
upregulation26 have been implicated in trastuzumab resistance and may provide targets for combination strategies for even better approaches in the future.
BASAL-LIKE BREAST CANCER
Expression Patterns
The basal-like subtype of breast cancer was so named because the expression pattern of this subtype mimicked that of the basal epithelial cells of other parts of the body and normal breast myoepithelial cells.4 These simi-larities include lack of expression of ER and related gene; low expression of HER2; strong expression of basal
cytokeratins 5, 6, and 17; and expression of proliferation-related genes.4,6 Immunohistochemical profiling using tissue microarray has identified that a group of tumors characterized by basal cytokeratin expression are also characterized by low expression ofBRCA1.27Indeed a basal phenotype is one of the hallmark features of ‘‘BRCA-ness’’ (sporadic cancers that look like those from BRCA1
orBRCA2 mutation carriers) and might have important
implications for management.28 Basal-like tumors are more likely to have aggressive features such asTP53 mu-tations and a markedly higher likelihood of being grade III (P⬍.0001) than luminal A breast cancers (P⬍.0001).5,12
Clinical Features
Some risk factors for developing basal-like breast can-cers have been identified. As predicted by the hormone receptor and HER2-negative nature of these tumors, most women with BRCA1 mutations generally develop basal-like breast cancer.8,28In the Carolina Breast Cancer Study, 20% of the tumors were basal-like. However the basal-like subtype was most common among premeno-pausal African American women (39%) compared with postmenopausal African American (14%) or non–African American women of any age (16%) (PZ.0001).12
Inter-estingly, a recent study of risk among different racial and ethnic subtypes in the Women’s Health Initiative sug-gested that among African American women, traditional risk factors such as menstrual and pregnancy history, body mass index, and activity failed to explain differences in incidence from white women.29With the racial differ-ence seen in the prevaldiffer-ence of cancer subtypes, this may mean that we need to re-evaluate the way we assess risk among different types of cancer.
Treatment Response and Outcome
chemotherapy was higher among basal-like breast cancer than non–basal like. These studies suggest that the poor prognosis experienced by patients with basal-like tumors is not from initial chemoresistance, but rather reflects the fewer treatment options available for ER-, PR-, and HER2-negative tumors and/or the intrinsic biology of this subtype.
This sensitivity to drugs may not be true of all agents. As mentioned,BRCA1pathway activity may be impaired in many basal-like breast cancers. BRCA1 functions in DNA repair andcell cyclecheckpoint responses may result in sensitivity to DNA damaging agents, and resistance to spindle poisons.30 Regarding targeted options in this subtype, although none have yet been clinically proven, some preclinical studies suggest that this subtype may
beepidermal growth factor receptor–driven.31,32This
hy-pothesis is being tested in several clinical trials. A recent publication examining the ‘‘wound response’’ signature, which includes genes involved in matrix remodeling and angiogenesis, found an association of this signature with basal-like subtype, suggesting other potential avenues of targeting.33
MOLECULAR FORECASTING: PREDICTING OUTCOMES WITH EXPRESSION PROFILING
Prognostic studies analyze variables that may predict fu-ture events and in most clinical studies these are related to time to death or recurrence. The main application of the new marker is to stratify patients by outcome and therefore allow better counseling and treatment decisions. The study of univariate prognostic factors in clinical co-horts is difficult and prone to multiple sources of bias.34 In contrast to prospective randomized trials, most prog-nostic studies are poorly designed and carried out in the absence of a predetermined written protocol, eligibility criteria, a primary end point or predefined statistical anal-ysis.35Prognostic variables should be tested in a represen-tative sample of the population at risk at a common point in the course of their disease.36The use of ‘‘available’’ sam-ples does not satisfy this requirement and often results in inadequate clinical information for important clinical covariates, such as performance status and treatment. Consequently many studies provide data-driven analyses and report uncertain effects particularly in patient sub-groups. Testing multiple variables from microarray or other high-throughput experiments adds further meth-odologic and statistical challenges to the conduct of prog-nostic studies.
Unsupervised methods such as cluster analysis (as de-scribed in the previous section) identify new partitions in data sets by comparing pair-wise similarity measures of gene expression. However these methods are subjective because different partitions can be identified with different mathematical methods of measuring similarities. Because
these methods do not derive statistically valid informa-tion regarding which genes are differentially expressed between classes, they are poorly suited for identifying prognostic variables.37
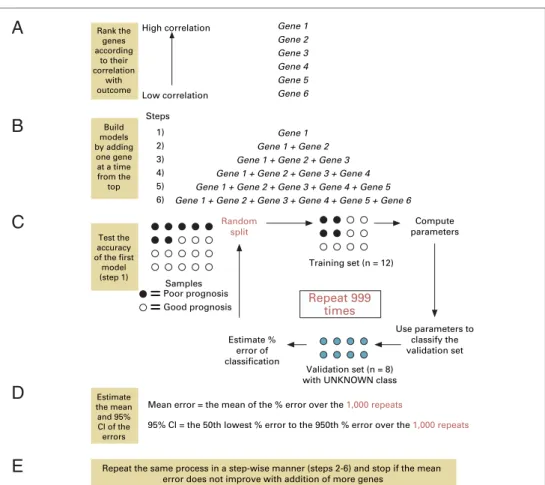
The aim ofsupervised classificationof data is to detect genes that may predict defined outcomes. The identifica-tion of a predictive multivariate marker from microarray expression data involves three main steps.35First, invari-ant genes must be filtered from the data set to prevent noise obscuring true biologic associations. Then the remaining genes of interest are ranked by their strength of association with the outcome. Second, a model is iden-tified which can predict outcome using the gene expres-sion values as input to a mathematical formula. Third, a prediction rule is defined that categorizes the output from the model into clinically defined classes using cut-off points.
Internal validationis used as part of the model-building
process to estimate the accuracy of the predictor in an unbiased manner. This requires atraining setand a
sepa-ratetest setthat should not be used to develop the model.
Ideally, the test set should resemble the population from which future samples will be tested.Split-sample internal
validationsimply divides the samples into two sets.
How-ever, more efficient methods such ascross validation are commonly used. These methods test the model-building process, not the list of genes identified. Testing is per-formed as an iterative process by selecting different train-ing and test sets from the series. In leave-one-out cross
validation, test sets of one sample are chosen and the
ac-curacy of the model derived from the remaining (n– 1) samples is scored. This is repeated for all n samples so that every sample acts as a test set. The cross-validated pre-dictive error for the model is obtained and can be used to compare different models or optimize the number of genes included in the model. All samples are then used to derive the final model. Although internal validation is an essential part of model development and refinement, it is not a replacement for formalexternal validation.
real samples. Incorrect internal validation, for example by performing resubstitution, not cross validation, dramati-cally underestimates the error rate by increasing over fit-ting.35,39 Other obvious biases, such as using external validation sets that are not independent of the training sets, make results very hard to interpret. Finally, the per-formance of the model is highly dependent upon the cutoff point used to classify outcomes. Arbitrarily defined cutoff values do not allow true estimation of the predictive power of the classifier and may be highly biased by the character-istics of the training set.Receiver operating characteristic
(ROC)curves plot the sensitivity and specificity obtained
for multiple cutoff points and allow objective assessment of the optimum value.Classifiersthat have the largest area under the curve (AUC; shift of the curve to the left) have the best performance and AUC may be used to compare performance between different predictor models.
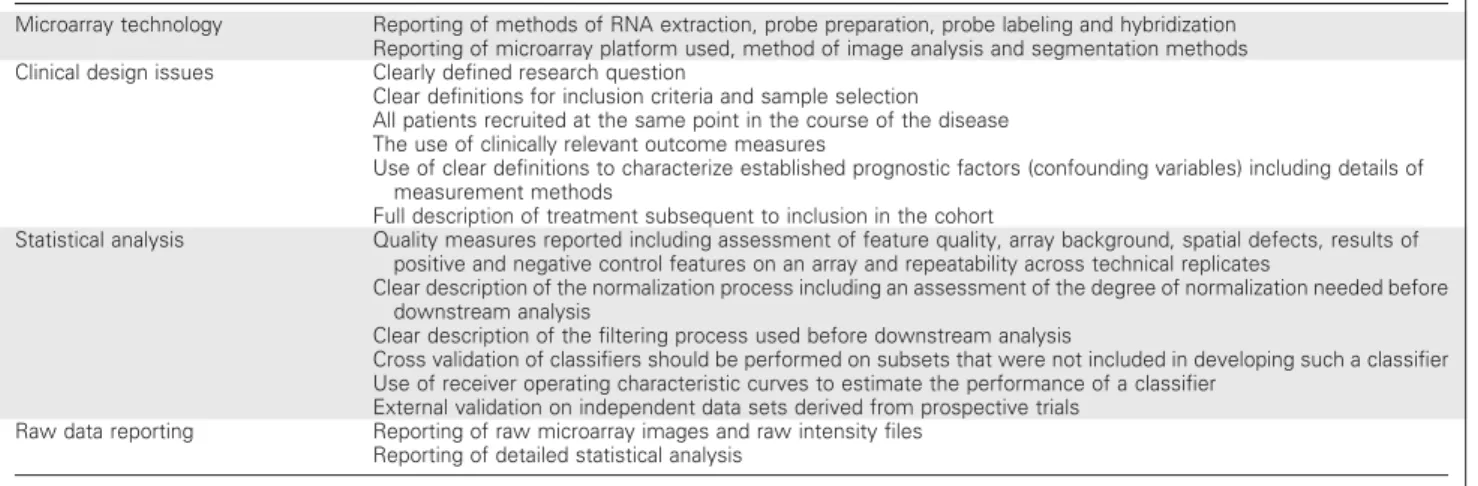
Many expression microarray studies have addressed broad prognostic questions in breast cancer5,6,40-45 but none satisfy previously defined criteria for good prognos-tic studies or provide a sufficient level of evidence for can-didate markers (Table 1). The two largest studies have sought to identify markers for recurrence or survival after surgical treatment of node-negative disease. Van’t Veer et al40identified a cohort of 98 node-negative breast
can-cers with onset before the age of 55 years. They compared expression patterns between those who relapsed within 5 years to those who were disease free at 5 years or more. Supervised methods identified a70-gene signature, which was then applied to an additional set of 197 unique breast cancers.41 Combining both the original cancers and the follow-up set provided incomplete validation of the poor-prognosis signature and Cox proportional hazards analysis showed the signature to have a hazard ratio of 4.6 (95% CI, 2.3 to 9.2) which outperformed other stan-dard univariate clinical parameters. In a similar sized study, Wang et al45 derived a 76-gene prognostic signa-ture from 115 node-negative cancers and validated their signature on a wholly independent series of 171 samples. The Wang signature had a hazard ratio of 5.55 (95% CI, 2.46 to 12.5) and again appeared to outperform uni-variate tests.
Strikingly, despite similar clinical and statistical de-signs, the two independent signatures share only three genes. This may be partly caused by the use of different microarray platforms, which can lead to differences in data repeatability and gene discovery.46-48 In addition, the training sets for both studies differed in mean age (44 yearsv54 years) but there were no other major clinical differences. However, a more important effect may have
A
B
C
D
E
Gene 1
Gene 2 Gene 3
Gene 4 Gene 5
Gene 6 High correlation
1) 2)
3) 4)
5) 6) Steps
Gene 1
Gene 1 + Gene 2 Gene 1 + Gene 2 + Gene 3
Random split
Use parameters to classify the validation set
=
Poor prognosis=
Good prognosis SamplesRepeat 999 times
Gene 1 + Gene 2 + Gene 3 + Gene 4 Gene 1 + Gene 2 + Gene 3 + Gene 4 + Gene 5
Gene 1 + Gene 2 + Gene 3 + Gene 4 + Gene 5 + Gene 6
Repeat the same process in a step-wise manner (steps 2-6) and stop if the mean error does not improve with addition of more genes
Rank the genes according
to their correlation
with outcome
Build models by adding
one gene at a time from the top
Low correlation
Test the accuracy of the first
model (step 1)
Estimate % error of classification
Compute parameters
Training set (n = 12)
Validation set (n = 8) with UNKNOWN class
Mean error = the mean of the % error over the 1,000 repeats
95% Cl = the 50th lowest % error to the 950th % error over the 1,000 repeats
Estimate the mean and 95% Cl of the errors
been caused by marked variability in the derived prognos-tic signatures. Reanalysis of the original van’t Veer data has shown that the predictive signature is not unique and in-deed the data set contains multiple signatures that all cor-relate well with survival.49This paradox arises because the difference between gene-outcome correlations is small, making it difficult to identify the most predictive genes, and the process of choosing the genes is highly depen-dent upon the subset of patients used to develop the pre-diction model. Independent reanalysis of other microarray data sets has revealed very similar findings.50 This has led others to propose a different algorithm for outcome prediction that treats survival as a continuous variable and then considers for subsequent unsupervised clus-tering only the genes with a Cox score that exceed a de-fined threshold.51
It is clear that more data are needed to identify key determinants of clinical outcome in node-negative breast cancer. Further refinement will require analysis of larger independent series of patients, but this is time consuming and expensive. There may be benefits from studying mouse models of breast cancer metastasis. Kang et al52 used in vivo selection in mice to identify subclones of the breast cancer cell line MDA-MB-231, with greatly en-hanced metastatic specificity to bone. By passaging clonal lines through several generations and using microarray profiling, they identified 102 genes most strongly corre-lated with bone metastasis. Many of the overexpressed genes encoded proteins with osteolytic and angiogenic functions, includinginterleukin 11andconnective tissue
growth factor. Downregulated genes includedextracellular
matrixandadhesion molecules. In an independent study
of 19 primary breast cancers grouped by their ability to metastasize to bone or lymph nodes, Woelfle et al53also identified a bone metastasis signature with repression of extracellular matrix and adhesion proteins that was dis-tinct from that of lymph node metastasis alone. The
ex-pression patterns seen in highly metastatic variants of MDA-MB-231 were similar to the van’t Veer 70-gene sig-nature, suggesting that the mouse may be a powerful model to refine meaningful gene selection.54
To identify a prognostic marker for early breast cancer treated with tamoxifen, Ma et al55profiled 60 patients and identified nine genes that were significantly correlated with outcome from laser capture–dissected tumors. This was used to develop a cutoff for classification based on the ratio of two of the genes. When tested in an indepen-dent series of 20 patients, the two-gene expression ratio correctly predicted outcome in 16 of 20 patients. External validation of the marker performed by another group us-ing quantitative polymerase chain reaction in an indepen-dent series of 58 patients with ER-positive breast cancer failed to show any significant predictive value.56Although there were differences in the two breast cancer cohorts, both were small, and an accompanying editorial highlights how a high false-positive rate for gene discovery and lack of adequate model development may have contributed to the differences.58
Taken together, these results underscore the difficul-ties of using limited numbers of samples together with a sensitive technology that may be poorly reproducible. An alternative to using fresh-frozen material is to perform expression profiling on paraffin-embedded tissue, which is possible using multiplex real-time reverse transcriptase polymerase chain reaction. Using paraffin material for ex-pression profiling is of particular importance because the success of screening programs have decreased tumor size at diagnosis and material is available from randomized tri-als, allowing well-controlled hypothesis-testing studies to be carried out.
Paik et al16identified 250 candidate genes as potential prognostic factors in breast cancer from several gene expression studies and published literature. Expression of these candidates was tested in 233 samples from two
Table 1.Minimal Requirements for Reporting Expression-Based Prognostic/Predictive Studies
Microarray technology Reporting of methods of RNA extraction, probe preparation, probe labeling and hybridization Reporting of microarray platform used, method of image analysis and segmentation methods Clinical design issues Clearly defined research question
Clear definitions for inclusion criteria and sample selection All patients recruited at the same point in the course of the disease The use of clinically relevant outcome measures
Use of clear definitions to characterize established prognostic factors (confounding variables) including details of measurement methods
Full description of treatment subsequent to inclusion in the cohort
Statistical analysis Quality measures reported including assessment of feature quality, array background, spatial defects, results of positive and negative control features on an array and repeatability across technical replicates
Clear description of the normalization process including an assessment of the degree of normalization needed before downstream analysis
Clear description of the filtering process used before downstream analysis
Cross validation of classifiers should be performed on subsets that were not included in developing such a classifier Use of receiver operating characteristic curves to estimate the performance of a classifier
External validation on independent data sets derived from prospective trials Raw data reporting Reporting of raw microarray images and raw intensity files
National Surgical Adjuvant Bowel and Breast (NSABP) tri-als in which subjects with ER-positive, node-negative breast cancer received tamoxifen. Successful polymerase chain reaction could be carried out in paraffin blocks that were more than a decade old. A Recurrence Score al-gorithm was derived that predicted low (recurrence rates of 10% or less), intermediate (10% to 30%) and high (more than 30%) risk which combined the expression of 21 genes including five controls. The genes included those induced by estrogen and involved in proliferation and cell cycle control. Having generated the gene model, the authors used 668 samples from NSABP B-14 to vali-date these results. Further information from NSABP sug-gests that the 21-gene signature is prognostic in untreated women in B-14 and may also be predictive of benefit from adjuvant chemotherapy in B-20.15In contrast to current data from expression microarray experiments, these results appear compelling. However several key issues re-main. Although large, the validation set from B-14 was based on available samples, so unexpected biases are still possible. Validation of the recurrence score will require a randomized phase III study, which is currently being planned (US Intergroup Program for the Assessment of Clinical Cancer Tests [PACCT] study). External validation also requires use of the test in different laboratories to show that the methods are reproducible and widely appli-cable. The use of RNA presents a continuing challenge and differences in quantitation of ERBB2 were seen between B-14 and B-20 samples. Translation of these findings into an immunohistochemical test would make it easier to di-rectly assess scores in tumor tissue in routine clinical practice. New prognostic markers are often compared with ex-isting markers (such as grade or stage) by showing differ-ential effects on survival using Kaplan-Meier plots. Most often these comparisons do not integrate all that is known about the patient and in particular do not exclude whether the new marker can perform better than combinations of existing markers. A more definitive assessment can be de-rived from multivariable analysis in which a hazard ratio (HR) indicates the individual contribution in comparison with other established markers. Some caution is needed in interpretation of these values as the significance tests for the HR indicates the probability that the HR is not zero, not how significant is the contribution of the marker to prognosis. Eden et al58compared the van’t Veer 70-gene marker with a combination of conventional multivariable prognostic indices and the Nottingham Prognostic Index on the original van’t Veer data set. Comparison of the two markers was made using ROC curves and Kaplan-Meier plots, but no difference in performance was distinguish-able. Both methods could predict more accurately for ER-positive as compared with ER-negative breast cancer. A realistic aim for new prognostic markers perhaps should be to improve performance, not replace existing
markers. More sophisticated tests that can quantify the additional utility of a marker are urgently required.59
Predictive studies are a specialized form of prognostic studies where the outcome of interest is response to treat-ment and the application of the test is to inform which pa-tients are suitable for specific therapy. These constraints make the identification of predictive signatures more dif-ficult than prognostic factors and require prospectively controlled clinical trials. Chang et al44used a sequential cohort of 24 locally advanced breast cancers to identify resistant and sensitive tumors to neoadjuvant docetaxel. Supervised classification identified a 92-gene predictor that correlated with docetaxel response. However, response was defined retrospectively using median residual volume, not standard clinical criteria, and the usefulness of the predictor is yet to be validated. Similar studies have used pathologic complete response and magnetic resonance im-aging to define response from taxane-based treatment.60,61 In a follow-up expression study of 13 surgical specimens from the Chang cohort, the authors found strikingly little differences in gene expression between residual tumor from resistant and sensitive cases.62 The authors suggest that this may indicate selection for a resistant sub-population of cells, but other confounding factors includ-ing over-representation of normal tissue expression have not yet been excluded.
CONCLUSION
and biologic variables. We therefore question the feasibil-ity of using existing signatures for prospective randomiza-tion of patients in clinical trials. If the early results from adjuvant trials confirm the strong benefit for HER2-positive patients using adjuvant chemotherapy plus trastuzumab, would there be clinicians prepared to withhold adjuvant chemotherapy in a young patient with a node-negative, HER2-positive breast cancer and a ‘‘good-prognosis’’ signa-ture? And likewise for a similar patient with a triple-negative cancer, but for whom chemotherapy might be the only sys-temic therapy available to reduce risk of relapse?
We propose a way forward: (1) data from existing predictive gene expression signatures should be mined us-ing different algorithms (eg, the recently proposed semi-supervised analysis shown to outperform the classifiers derived using totally supervised approaches51) to try to identify an overlapping consensus set of candidate predic-tive genes that could then be validated externally using polymerase chain reaction–based assays; (2) larger retro-spective studies that include hundreds of samples from each of the major subtypes defined by nodal status and a small number of markers (ER/PR/HER2, and possibly basal cytokeratins and EGFR) should be conducted using legacy tumor banks to generate both a more definitive breast cancer taxonomy and also a further set of predictive signatures to be validated both prospectively or in samples
from completed clinical trials; and (3) prospective systemic-therapy clinical trials should be designed with predictive marker validation in mind, following rigorous design (Sargent et al64).
The most difficult issue to tackle is going to be vali-dation of predictive markers for node-negative disease, where a randomization decision of receiving systemic therapy on the basis of assigning a patient to a good-prognosis group might mean that such therapy is denied for someone who could benefit from it. The statistical modeling that will help make such decisions easier will require rigorous evaluation of the predictive power of sig-natures, including truly independent external validation, and their independence from tried, tested, trusted, and validated methodology (eg, the Adjuvant! software pack-age).65We remain skeptical that the predictive expression signatures have passed these litmus tests. The adherence to guidelines for evaluating new prognostic (and predictive) factors proposed long ago66 should ensure that the field progresses along a smoother path. The promise of ge-nomics deserves no less.
- -
-Authors’ Disclosures of Potential Conflicts of Interest
The authors indicated no potential conflicts of interest.
REFERENCES
1.Peto R, Boreham J, Clarke M, et al: UK and USA breast cancer deaths down 25% in year 2000 at ages 20-69 years. Lancet 355:1822, 2000
2.Early Breast Cancer Trialists’ Collaborative Group: Effects of chemotherapy and hormonal therapy for early breast cancer on recurrence and 15-year survival: An overview of the rando-mised trials. Lancet 365:1687-1717, 2005
3.Caldas C, Aparicio SA: The molecular outlook. Nature 415:484-485, 2002
4.Perou CM, Sorlie T, Eisen MB, et al: Molecular portraits of human breast tumours. Nature 406:747-752, 2000
5.Sorlie T, Perou CM, Tibshirani R, et al: Gene expression patterns of breast carcinomas distinguish tumor subclasses with clinical impli-cations. Proc Natl Acad Sci U S A 98:10869-10874, 2001
6.Sotiriou C, Neo SY, McShane LM, et al: Breast cancer classification and prognosis based on gene expression profiles from a population-based study. Proc Natl Acad Sci U S A 100:10393-10398, 2003
7.Weigelt B, Glas AM, Wessels LF, et al: Gene expression profiles of primary breast tumors maintained in distant metastases. Proc Natl Acad Sci U S A 100:15901-15905, 2003
8.Sorlie T, Tibshirani R, Parker J, et al: Repeated observation of breast tumor subtypes in independent gene expression data sets. Proc Natl Acad Sci U S A 100:8418-8423, 2003
9.Callagy G, Cattaneo E, Daigo Y, et al: Molecular classification of breast carcinomas using tissue microarrays. Diagn Mol Pathol 12:27-34, 2003
10.Abd El-Rehim DM, Pinder SE, Paish CE, et al: Expression of luminal and basal cytoker-atins in human breast carcinoma. J Pathol 203:661-671, 2004
11.Jacquemier J, Ginestier C, Rougemont J, et al: Protein expression profiling identifies subclasses of breast cancer and predicts prog-nosis. Cancer Res 65:767-779, 2005
12.Carey LA, Perou CM, Dressler LG, et al: Race and the poor prognosis basal-like breast cancer (BBC) phenotype in the population-based Carolina Breast Cancer Study. J Clin Oncol, 2004 (suppl; abstr 9510)
13.Rouzier R, Anderson K, Hess KR, et al: Basal and luminal types of breast cancer defined by gene expression patterns respond differently to neoadjuvant chemotherapy. San Antonio Breast Cancer Symposium. San Antonio, TX, 2004 (abstr 1026)
14.Carey LA, Dees EC, Sawyer L, et al: The triple negative paradox: Primary tumor chemo-sensitivity of the basal-like breast cancer (BBC) phenotype. San Antonio Breast Cancer Sympo-sium. San Antonio, TX, 2004 (abstr 1023)
15.Paik S, Shak S, Tang G, et al: A multigene assay to predict recurrence of tamoxifen-treated, node-negative breast cancer. N Engl J Med 351:2817-2826, 2004
16.Paik S, Shak S, Tang G, et al: Expression of the 21 genes in the Recurrence Score assay and
tamoxifen clinical benefit in the NSABP study B-14 of node negative, estrogen receptor posi-tive breast cancer. J Clin Oncol 23:6s, 2005 (suppl; abstr 510)
17.Paik S, Shak S, Tang G, et al: Expression of the 21 genes in the Recurrence Score assay and prediction of clinical benefit from tamoxifen in NSABP study B-14 and chemotherapy in NSABP study B-20, San Antonio Breast Cancer Sympo-sium. San Antonio, TX, 2004 (abstr 24)
18.Gianni L, Zambetti M, Clark K, et al: Gene expression profiles of paraffin-embedded core biopsy tissue predict response to chemotherapy in patients with locally advanced breast cancer. J Clin Oncol, 2004 (suppl; abstr 501)
19.Miller KD, Burstein HJ, Elias A, et al: Phase II study of SU11248, a multitargeted receptor tyrosine kinase inhibitor (TKI), in patients (pts) with previously treated metastatic breast cancer (MBC). J Clin Oncol, 2005 (suppl; abstr 563)
20.Colditz GA, Rosner BA, Chen WY, et al: Risk factors for breast cancer according to estrogen and progesterone receptor status. J Natl Cancer Inst 96:218-228, 2004
21.Berry D, Cirrincione C, Henderson IC, et al: Effects of improvements in chemotherapy on disease-free and overall survival of estrogen receptor negative, node positive breast cancer: 20 years experience of the CALGB and US Breast Intergroup, San Antonio Breast Cancer Symposium. San Antonio, TX, 2004 (abstr 29)
paclitaxel with or without trastuzumab as adju-vant therapy for patients with HER-2 positive operable breast cancer. Presented at 41st Annual Meeting of the American Society of Clinical Oncology, Orlando, FL, May 13-17, 2005 23.Perez EA, Suman V, Davidson N, et al: NCCTG N9831 May 2005 Update. J Clin Oncol, 2005 Presented at 41st Annual Meeting of the American Society of Clinical Oncology, Orlando, FL, May 13-17, 2005
24.Piccart-Gebhart M: First Results of the HERA trial: A randomized three-arm multi-center comparison of 1 year herceptin, 2 years hercep-tin, or no herceptin in women with HER-2 positive primary breast cancer who have com-pleted adjuvant chemotherapy. J Clin Oncol, 2005 Presented at 41st Annual Meeting of the American Society of Clinical Oncology, Orlando, FL, May 13-17, 2005
25.Nagata Y, Lan KH, Zhou X, et al: PTEN activation contributes to tumor inhibition by trastuzumab, and loss of PTEN predicts trastu-zumab resistance in patients. Cancer Cell 6:117-127, 2004
26.Tripathy D, Hassan S, Verma U, et al: Phenotypic and proteomic alterations of ac-quired trastuzumab resistence. J Clin Oncol, 2005 (suppl; abstr 3121)
27.Abd El-Rehim DM, Ball G, Pinder SE, et al: High-throughput protein expression analysis using tissue microarray technology of a large well-characterised series identifies biologically distinct classes of breast cancer confirming recent cDNA expression analyses. Int J Cancer 116:340-350, 2005
28.Turner N, Tutt A, Ashworth A: Hallmarks of ‘BRCAness’ in sporadic cancers. Nat Rev Cancer 4:814-819, 2004
29.Chlebowski RT, Chen Z, Anderson GL, et al: Ethnicity and breast cancer: Factors influencing differences in incidence and out-come. J Natl Cancer Inst 97:439-448, 2005
30.Kennedy RD, Quinn JE, Mullan PB, et al: The role of BRCA1 in the cellular response to chemotherapy. J Natl Cancer Inst 96:1659-1668, 2004
31.Sartor C, Zhou H, Perou CM, et al: Basal-like breast tumor-derived cell lines are growth inhibited and radiosensitized by epidermal growth factor receptor (EGFR) tyrosine kinase inhibitors. San Antonio Breast Cancer Sympo-sium. San Antonio, TX, December 8-11, 2004
32.Nielsen TO, Hsu FD, Jensen K, et al: Immunohistochemical and clinical characteriza-tion of the basal-like subtype of invasive breast carcinoma. Clin Cancer Res 10:5367-5374, 2004 33.Chang HY, Nuyten DS, Sneddon JB, et al: Robustness, scalability, and integration of a wound-response gene expression signature in predicting breast cancer survival. Proc Natl Acad Sci U S A 102:3738-3743, 2005
49.Ein-Dor L, Kela I, Getz G, et al: Outcome signature genes in breast cancer: Is there a unique set? Bioinformatics 21:171-178, 2005
50.Michiels S, Koscielny S, Hill C: Prediction of cancer outcome with microarrays: A multiple random validation strategy. Lancet 365:488-492, 2005
51.Bair E, Tibshirani R: Semi-supervised methods to predict patient survival from gene expression data. PLoS Biol 2:E108, 2004
52.Kang Y, Siegel PM, Shu W, et al: A multigenic program mediating breast cancer metastasis to bone. Cancer Cell 3:537-549, 2003
53.Woelfle U, Cloos J, Sauter G, et al: Molecular signature associated with bone mar-row micrometastasis in human breast cancer. Cancer Res 63:5679-5684, 2003
54.Minn AJ, Kang Y, Serganova I, et al: Distinct organ-specific metastatic potential of individual breast cancer cells and primary tu-mors. J Clin Invest 115:44-55, 2005
55.Ma XJ, Wang Z, Ryan PD, et al: A two-gene expression ratio predicts clinical outcome in breast cancer patients treated with tamoxifen. Cancer Cell 5:607-616, 2004
56.Reid JF, Lusa L, De Cecco L, et al: Limits of predictive models using microarray data for breast cancer clinical treatment outcome. J Natl Cancer Inst 97:927-930, 2005
57.Simon R: Development and validation of therapeutically relevant multi-gene biomarker classifiers. J Natl Cancer Inst 97:866-867, 2005
58.Eden P, Ritz C, Rose C, et al: Good old clinical markers have similar power in breast cancer prognosis as microarray gene expression profilers. Eur J Cancer 40:1837-1841, 2004
59.Kattan MW: Evaluating a new marker’s predictive contribution. Clin Cancer Res 10:822-824, 2004
60.Ayers M, Symmans WF, Stec J, et al: Gene expression profiles predict complete path-ologic response to neoadjuvant paclitaxel and fluorouracil, doxorubicin, and cyclophosphamide chemotherapy in breast cancer. J Clin Oncol 22:2284-2293, 2004
61.Iwao-Koizumi K, Matoba R, Ueno N, et al: Prediction of docetaxel response in human breast cancer by gene expression profiling. J Clin Oncol 23:422-431, 2005
62.Chang JC, Wooten EC, Tsimelzon A, et al: Patterns of resistance and incomplete response to docetaxel by gene expression profiling in breast cancer patients. J Clin Oncol 23:1169-1177, 2005
63.Burstein HJ, Winer EP: HER2 or not HER2: That is the question. J Clin Oncol 23:3656-3659, 2005
64.Sargent DJ, Conley BA, Allegra C, et al: Clinical trial designs for predictive marker valida-tion in cancer treatment trials. J Clin Oncol 23: 2020-2027, 2005
65.Olivotto IA, Bajdik CD, Ravdin PM, et al: Population-based validation of the prognostic model ADJUVANT! for early breast cancer. J Clin Oncol 23:2716-2725, 2005
66.McGuire WL: Breast cancer prognostic factors: Evaluation guidelines. J Natl Cancer Inst 83:154-155, 1991
34.LevineMN,BrowmanGP,GentM,etal: Whenisaprognosticfactoruseful?Aguidefor theperplexed.JClinOncol9:348-356,1991
35.SimonR:Diagnosticandprognostic pre-dictionusinggeneexpressionprofilesin high-dimensionalmicroarraydata. Br J Cancer89: 1599-1604,2003
36.AltmanDG:Systematicreviewsof evalua-tionsofprognosticvariables.BMJ323:224-228, 2001
37.SimonR,RadmacherMD,DobbinK,etal: PitfallsintheuseofDNAmicroarraydatafor diagnosticandprognosticclassification.JNatl CancerInst95:14-18,2003
38.StoreyJD,TibshiraniR:Statistical signifi-canceforgenomewidestudies.ProcNatlAcad SciUSA100:9440-9445,2003
39.SimonR: When is a genomic classifier readyforprimetime?NatClinPractOncol1:4-5, 2004
40.van’tVeerLJ,DaiH,vandeVijverMJ,etal: Geneexpressionprofilingpredictsclinicaloutcome ofbreastcancer.Nature415:530-536,2002
41.vandeVijverMJ,HeYD,van’tVeerLJ, etal:Agene-expressionsignatureasapredictor of survival in breast cancer. N Engl J Med 347:1999-2009,2002
42.AhrA, KarnT,Solbach C,et al: Identif-icationofhighriskbreast-cancerpatientsbygene expressionprofiling.Lancet359:131-132,2002
43.HuangE, ChengSH,DressmanH,etal: Gene expression predictors of breast cancer outcomes.Lancet361:1590-1596,2003
44.Chang JC, Wooten EC, Tsimelzon A, etal:Geneexpressionprofilingforthe predic-tion of therapeutic response to docetaxel in patients with breast cancer. Lancet 362:362-369,2003
45.WangY,Klijn JG,ZhangY,et al: Gene-expressionprofilestopredictdistantmetastasis oflymph-node-negativeprimarybreastcancer. Lancet365:671-679,2005
46.Lee JK, Bussey KJ, Gwadry FG, et al: ComparingcDNAandoligonucleotidearraydata: Concordance of gene expression across plat-formsfortheNCI-60cancercells.GenomeBiol 4:R82,2003
47.ZornKK, Jazaeri AA, Awtrey CS, et al: Choice of normal ovarian control influences determinationofdifferentiallyexpressedgenes inovarian cancer expressionprofilingstudies. ClinCancerRes9:4811-4818,2003