ARTICLE | sahjournal.com
Applying Ajzen’s Theory of Planned
Behaviour: Changing Physical Activity Health
Behaviour with Activity-Tracking Technology
Colin O’Shea
UndergraduateDepartment of Psychology, Dublin Business School Dublin, Ireland
Patricia Frazer
Department of Psychology, Dublin Business School Dublin, Ireland
© Colin O’Shea and Patricia Frazer. This work is licensed under the Creative Commons Attribution-NonCommercial-NoDerivatives 4.0 International License. To view a copy of this license, visit http://creativecommons.org/licenses/by-nc-nd/4.0/.
Abstract
Pairing modern day technology with Azjen’s popular Theory of Planned Behaviour, the objectives were to i) determine whether a mobile connected activity-tracking device could change physical activity (PA) health behaviour, ii) test whether the theory of planned behaviour (TPB) could predict participation in physical activity, measured by mobile technology, iii) determine if PA engagement is correlated with mobile communication usage and vehicle journey time. Participants consisted of 41 males and 28 females (N=69), each completing standard TPB measures at baseline. Intervention included a health warning/advice sheet and the physical attachment of an activity-tracking device paired with a mobile application for the duration of two weeks. The data retrieved included the participant’s daily steps count, the participant’s daily time spent travelling by motor vehicle or not, and the participant’s daily amount of mobile communication usage time. A statistically significant increase in activity was observed in the device-wearing group, with a medium effect size. Findings did not support the TPB as a predictor of PA engagement in a technology intervention context. There was no statistical relationship between PA participation and mobile communication usage or vehicle journey time. Findings suggest a basis for developing interventions to include mobile connected devices for improved behavioural health.
Keywords: Exercise; Theory of Planned Behaviour; Automatic tracking
Introduction
81
epidemic with rates estimated to have doubled between 1980 and 20131. Furthermore, this health issue has been identified as one of the leading worldwide causes of death and found to increase risks of diabetes, cancers and cardiovascular diseases. According to the World Health Organisation, more than 2.8 million people die in the world per year as a result of being overweight and obese2. Currently, Ireland is ranked second highest in Europe for obesity rates3, but worryingly, Ireland is on course to become the most obese country by 20304.
A forecast report in 2015 by the World Health Organisation5 predicted that 91% of men in Ireland are likely to be overweight by 2030, including 27% of these likely to be obese. For women, 83% are predicted to be overweight with 57% obese. In 2014, there were more than 1.9 billion adults overweight (39% of world population), with 600 million of these obese (13% of world population) and 42 million children under the age of 5 were either overweight or obese in 20136.Clearly, the potential consequences of not acting in some shape or form could be viewed as catastrophic. In 2013, each member state of the World Health Organisation agreed to action a global plan with the aim of preventing and controlling non-communicable diseases, including a specific goal to reduce insufficient levels of physical activity by 10% by 20257.
Whilst diet and nutrition are recognised as primary leading factors8,9,10, a heavy reliance on the use of sedentary modes of travel such as cars and buses contributes as well11 12 13. In Ireland, a national survey carried out by the Central Statistics Office into modes of daily
travel among Irish people in 2016 found that 65.6% of journeys were by car as either
1 Marie Ng, Tom Fleming, Margaret Robinson, Blake Thomson, Nicholas Graetz, Christopher Margono, C., Emmanuela Gakidou. 2014. “Global, regional, and national prevalence of overweight and obesity in children and adults during 1980-2013: a systematic analysis for the Global Burden of Disease Study 2013. The Lancet 384, no. 9945, https://www.ncbi.nlm.nih.gov/pubmed/24880830
2 World Health Organisation. “Media Centre: Fact sheet:Obesity and Overweight.”
http://www.who.int/mediacentre/factsheets/fs311/en/
3 Fasi.ie. “Consumer Doc Post Consultation FINAL.” (2012), https://www.fsai.ie 4 World Health Organisation. “Global Health Observatory data: Obesity.”
http://www.who.int/gho/ncd/risk_factors/obesity_text/en/
5 Safe Food. “Proportion of overweight and obese males and females to increase in most European countries by
2030.” http://www.safefood.eu/Professional/Nutrition/Nutrition-News/May-2015/Proportion-of-overweight-and-obese-males-and-femal.aspx
6 World Health Organisation. “Global Health Observatory data: Obesity.”
http://www.who.int/gho/ncd/risk_factors/obesity_text/en/
7 World Health Organisation. “Global Action Plan: for the prevention and control of noncommunicable diseases
2013-2020”, 5. http://apps.who.int/iris/bitstream/10665/94384/1/9789241506236_eng.pdf?ua=1
8 Boyd Swinburn, Ian Caterson, Jaap Seidell and William Philip James. “Diet, nutrition and the prevention of
excess weight gain and obesity.” Public Health Nutrition 7, no. 1A (2004), doi: 10.1079/PHN2003585
9 World Health Organisation. Global Strategy on Diet, Physical Activity and Health.
http://www.who.int/dietphysicalactivity/diet-overview/en/
10 National Service Executive. “Obesity>Causes of Obesity.”
https://www.hse.ie/eng/health/az/o/obesity/causes-of-obesity.html
11Justine Kozo, James F. Sallis, Terry L. Conway, Jacqueline Kerr, Kelli Cain, Brian E. Saelens, Lawrence D.
Frank and Neville Owen. “Sedentary behaviors of adults in relation to neighborhood walkability and income.”
Health Psychology31, no. 6 (2012), doi:10.1037/a0027874
12 National Heart, Lung and Blood Institute. “Health Topics>What Causes Overweight and Obesity>Causes.”
http://www.nhlbi.nih.gov/health/health-topics/topics/obe/causes
13 Harvard T.H. Chan School of Public Health. “Obesity Causes:Physical Activity.”
82
passenger or driver, a further 9% of journeys were made by bus, rail, or other and of the sample audience, only 9.3% were found to make a journey by walking and 2.7% by bicycle14.
In attempts to tackle the problem of obesity, overweight and sedentariness, health practitioners and governments all around the world have begun introducing measures to address the obesity crisis. As well as an emphasis on dietary measures such as the introduction of “sugar taxes” on many beverages in many countries15, there is increasing interest in encouraging people to become more physically active. Other measures include health warning messaging (or “shock advertising”) and health advice promotion via digital channels, print media and medical centres. However, the effectiveness of this messaging is uncertain16. In relation to physical activity advice, the Irish Heart Foundation recommends that an individual engage in 30 minutes of physical activity 5 days a week17. Similar recommendations are made by health organisations throughout the world. Both the Irish Heart Foundation and the UK’s National Health Service promote a 10,000 steps challenge encouraging people to get more active by setting themselves a target of 10,000 daily steps. 10,000 steps is recognised globally as the daily step target goal and the concept is believed to have originated in Japan18.
It is estimated, that on average, a person walks between 3,000-4,000 steps per day19. Interestingly, a study by Lordon and Pakrashi20 analysed all types of physical activities including housework, manual work, sports/exercise and identified ‘brisk or fast pace walking’ as being better than any other form of physical activity as a deterrent against overweight and obesity.
In tandem with global health warnings, there has been a surge in health and fitness mobile applications and wearable activity-tracking ‘smart devices’ (wireless connected electronic devices) flooding the global markets. These wearable activity-tracking devices are now readily available and marketed by brands such as Jawbone, Fitbit, Garmin, Microsoft and Sony, all ranging competing variants. Statistics reveal that there were 15 million global health and fitness tracker users in 2013, with that expected to rise to near 100 million by 201821. Activity-tracking smart devices allow users to receive and analyse information about their daily life behaviour with the aim of helping to guide decisions for healthier lifestyles. Information tracked may include a user’s daily steps, time spent walking, running, cycling, sleeping and transport travelling time. Some also monitor a user’s heart rate and levels of mobile communication usage (i.e. texting, calling and social media). The one necessity to operate these health and fitness applications and wearables is a smartphone mobile device. In a quarterly report by Ireland’s Commission for Communications Regulatory, official data
14 Central Statistics Office. “Census 2016 Results - Commuting In Ireland.”
http://www.cso.ie/en/csolatestnews/pressreleases/2017pressreleases/pressstatementcensus2016resultsprofile6-commutinginireland/
15 Lester Wan, Elaine Watson, and Rachel Arthur. “Sugar Taxes: The Gobal Picture in 2017.” Beverage Daily
(2017), https://www.beveragedaily.com/Article/2017/12/20/Sugar-taxes-The-global-picture-in-2017
16 Rajesh V. Manchanda, Darren W. Dahl and Kristina D. Frankenberger. "Shocking Ads! Do They Work?”
Advances in Consumer Research 29, (2002), http://acrwebsite.org/volumes/8624/volumes/v29/NA-29
17 Irish Heart Foundation. “Ways to Live Better: Be Active & Be Happy.”
https://irishheart.ie/your-health/ways-to-live-better/be-active/
18 BBC. “Do you really need to take 10,000 steps a day to keep fit?” (2015),
http://www.bbc.com/news/magazine-33154510
19 National Health Service. “The 10,000 Step Challenge.” (2015),
http://www.nhs.uk/Livewell/loseweight/Pages/10000stepschallenge.aspx
20 Grace Lordan, and Debayan Pakrashi. “Do All Activities “Weigh” Equally? How Different Physical Activities Differ as Predictors of Weight.” Risk Analysis 35, no. 11 (2015), doi: 10.1111/risa.12417.
21 Statista. “Health and fitness tracker global unit sales forecast 2014-2015, by region.”
83
revealed that 83% of mobile subscriptions in Ireland are Smartphone users22. Like Ireland, the world has seen smartphone adoption skyrocket and this leads experts to believe there is vast scope of opportunity for eHealth to become a prominent and important force in the healthcare market. According to Morris and Aguilera23, it is envisaged that forces such as “advances in mobile technology, constrained clinical care and consumer demand are beginning to change the face of psychological assessment and interventions”. The integration of smartphone technology in behavioural healthcare brings a vast amount of possibilities and the benefits such as GPS tracking of people with dementia, audio and visual recording of therapy sessions, etc., are outlined in further detail by the team at Telehealth & Technology in Washington24. In an age where technology and mobile phones are heavily integrated in our daily lives, the means to statistically measure our actions have never been as insightful. Technologies are readily used in pro-sports to determine the levels of output (i.e. running, jumping, shooting) a sports person makes in for example a football game. These advances in technology allow exploration into the validity of theories that have been historically reliant upon participant self-reporting and manual data logging.
Theory of Planned Behaviour (TPB)
Strong links have been identified between illness and behaviour with reports suggesting that 50% of the mortality, from 10 leading causes of death, is directly related to behaviour25. Based upon the popular theory of planned behaviour26, an individual’s behavioural intentions are shaped by a combination of attitudes towards behaviour, subjective norms and perceived behavioural control. As such, the likelihood of an individual’s participation in physical activity may be determined by analysing these behavioural dimensions.
There are many ways of measuring behavioural intentions and many theories of how intention relates to behaviour. One of the most common and highly cited is the Theory of Planned Behaviour, which has been supported in many studies through a wide spectrum of experimental applications including the prediction of behaviours related to drug usage27, gambling28, and sexual behaviours29. However, it is in the domain of physical activity that the
22 Commission for Communications Regulation. “Mobile Consumer Experience Survey” (2017),
https://www.comreg.ie/publication/mobile-consumer-experience-survey/
23 Margaret Morris and Adrian Aguliera. “Mobile, social, and wearable computing and the evolution of psychological practice.” Professional Psychology: Research And Practice, 43 no 6 (2012),
doi:10.1037/a0029041
24 David Luxon, Russell McCann, Nigel Bush, Matthew Mishkind, and Greg Reger. “mHealth for mental health: Integrating smartphone technology in behavioral healthcare.” Professional Psychology: Research And Practice 42, no. 6 (2011): 505-512. doi:10.1037/a0024485
25 Ogden, Jane. Health Psychology: A Textbook (4th ed.) 2007: [Dawsonera version].
https://www.dawsonera.com/readonline/9780335230105/startPage/48
26 Icek Ajzen. "The theory of planned behavior". Organizational Behavior and Human Decision Processes 50, no. 2 (1991): 179–211. doi:10.1016/0749-5978(91)90020-T.
27 Tiffany A. Ito, Eirka A. Henry, Kismet A. Cordova, and Angela D. Bryan, A. “Testing an expanded theory of planned behavior model to explain marijuana use among emerging adults in a promarijuana community.” Psychology Of Addictive Behaviors29, no. 3 (2015): 576-589. doi:10.1037/adb0000098
28 Ryan J. Martin, Stuart Usdan, Sarah Nelson, Renee M. Umstattd, Debi LaPlante, Mike Perko, and Howard Shaffer. “Using the theory of planned behavior to predict gambling behavior.” Psychology Of Addictive Behaviors24, no. 1 (2010), doi:10.1037/a0018452
84
model has been extensively applied30, 31.Limitations to the theory have been identified and discussed by Sniehotta et al.32
This study sought to investigate whether modern day health and fitness activity-tracking technology can help contribute a solution to the modern day overweight, obesity and highly sedentary problem engulfing millions of people globally. It aimed to determine whether using a mobile connected activity-tracking device could significantly influence the amount of daily steps a person takes, and whether a person’s behavioural intentions would change when using one.
Academics and health professionals have questioned the validity, reliability and longevity effect of wearable trackers33,34 and encouraged more investigative research. Upon examination of previous studies in this area, there appears to be a growing but yet still scarce amount of research into the physical activity behavioural influence of fitness/activity trackers, and specifically applying the theory of planned behaviour. In a study undertaken by Finkelstein et al.35 testing the effectiveness of activity trackers with and without incentives added to increase physical activity, they were found to be effective in stemming the reduction of a participant’s physical activity levels over a twelve-month period.
A study by Bolyard et al.36 incorporated the use of fitness trackers to assess the effects of PA and sleep on BMI (Body Mass Index), cardiovascular function, and salivary glutathione concentration. The study recognised trackers as being a valid method of data collection with the ability to deliver far more accurate statistical results than the self-reporting method used any past researches. The study also identified the positive motivational effect that the trackers had on the participants in encouraging more PA.
Although the theory of planned behaviour has been applied to many physical activity studies, there has been a heavy reliance on participants to self-report by relaying honest and accurate information about their physical activity time achieved during the experiment. In the case of this experiment, a key advantage is that the activity-tracking data records cannot be manipulated, avoiding for any misleading information or error in memory by the participant.
30 Melissa N. Galea, and Steven R. Bray. “Predicting walking intentions and exercise in individuals with
intermittent claudication: An application of the theory of planned behavior.”Rehabilitation Psychology 51, no. 4
(2006), doi:10.1037/0090-5550.51.4.299
31 Christopher. J. Armitage, “Can the Theory of Planned Behavior Predict the Maintenance of Physical Activity?” Health Psychology24, no. 3 (2005), doi: 10.1037/0278-6133.24.3.235
32 Falko Sniehotta, Justin Presseau and Vera Araújo-Soares. “Time to retire the theory of planned behaviour.”
Health Psychology Review 8, no. 1 (2014). doi: 10.1080/17437199.2013.869710
33 Josée Poirier, Wendy L Bennett, Gerald J Jerome, Nina G. Shah, Mariana Lazo, Hsin-Chieh Yeh, Jeanne M. Clark and Nathan K. Cobb. “Effectiveness of an Activity Tracker and Internet Based Adaptive Walking Program for Adults: A Randomized Controlled Trial.” Journal of Medical Internet Research 18, no. 2 (2016), doi: 10.2196/jmir.5295
34 Lukasz Piwek, David A. Ellis, Sally Andrews and Adam Joinson. “The Rise of Consumer Health Wearables: Promises and Barriers.”PLoS Med 13, no. 2 (2016), doi: 10.1371/journal.pmed.1001953
35 Eric A. Finkelstein, Benjamin A. Haaland, Marcel Bilger, Aarti Sahasranaman, Robert A. Sloan, Ei K. Nang and Kelly R. Evenson. “Effectiveness of activity trackers with and without incentives to increase physical activity (TRIPPA): a randomised controlled trial.” The Lancet Diabetes & Endocrinology 4, no. 12 (2016), doi: 10.1016/S2213-8587(16)30284-4
85
The TPB questionnaire incorporated in the case of this study was adopted from Armitage37. The measures analyse the person’s favourable or unfavourable attitudes toward physical activity, the person’s perceived social pressure to engage or not to engage in physical activity, and the person’s perceived ease or difficulty of engaging in physical activity. Azjen38 explains “As a general rule, the more favourable the attitude and subjective norm with respect to a behaviour, and the greater the perceived behavioural control, the stronger should be an individual’s intention to perform the behaviour under consideration”.In a review of the theory’s applications to health-related behaviours and in verifying its predictive efficiency in the domain of health, Goden and Kok39 found that although the efficiency of the theory could vary between different health-related categories, the model was found to be quite good for explaining intentions with perceived behavioural control being as important as attitude.
Previous studies have investigated the behavioural effects of mobile fitness applications only40,41,42 and found supportive evidence to encourage the adoption of mobile applications in tackling obesity and inactivity. This study examines empirically whether a wearable device, delivering highly accurate real-time information about a participant’s day, and functioning as somewhat of an ever-present motivational reminder tool for the individual to achieve his or her targeted goals, can encourage higher levels of physical activity engagement. Furthermore, this study sought to investigate the validity of Ajzen’s Theory of Planned Behaviour with technically recorded statistical data and identify whether the theoretical construct is a viable predictor of a person’s engagement in physical activity behaviour under the influence of technology. In addition, this study investigated whether physical activity engagement is significantly affected by mobile communication usage and vehicle journey time.
Inclusively, this study aimed to build upon previous research, which has explored means of changing health behaviours with supported mobile technologies43, 44 and essentially ‘plug a gap’ in the literature relevant to today’s technologically advanced society.
Hypothesis
Based on the literature review, the proposed hypotheses are:
37 Christopher. J. Armitage, “Can the Theory of Planned Behavior Predict the Maintenance of Physical Activity?” Health Psychology24, no. 3 (2005), doi: 10.1037/0278-6133.24.3.235
38 Icek Ajzen. "The theory of planned behavior". Organizational Behavior and Human Decision Processes50, no. 2 (1991), doi: 10.1016/0749-5978(91)90020-T.
39 Gaston Godin and Gerjo Kok. “The Theory of Planned Behaviour: A Review of Its Applications to Health-Related Behaviors.” American Journal of Health 11, no. 2 (1996), DOI: 10.4278/0890-1171-11.2.87
40, Rachel C. Bolin. “Mobile Health Technology and Health Behaviour. A Look into the Workplace Setting.”
Theses and Dissertations--Community and Leadership Development, no. 5. (2013), http://uknowledge.uky.edu/cld_etds/5
41 Angela Brunstein, Joerg Brunstein and Selma L. Mansar. “Integrating Health Theories in Health and Fitness Applications for Sustained Behavior Change: Current State of the Art.” Creative Education 3, no.1-5 (2012), doi: 10.4236/ce.2012.38b001
42 Artur Direito, Leila P. Dale, Emma Shields, Rosie Dobson, Robyn Whittaker and Ralph Maddison. “Do physical activity and dietary smartphone applications incorporate evidence-based behaviour change techniques?” BioMed Central Public Health 14, no. 646 (2014), doi: 10.1186/1471-2458-14-646.
43 Kathryn Mercer, Melissa Li, Lora Giangregorio, Catherine Burns and Kelly Grindrod. “Behaviour Change Techniques Present in Wearable Activity Trackers: A Critical Analysis.” Journal of Medical Internet Research MHealth UHealth 4, no. 2 (2014), doi: 10.2196/mhealth.4461.
86
H1 - There will be a significant difference in the total number of steps taken by adults when wearing an activity-tracking smart device.
H2 - There will be a significantly positive correlation between the theory of planned behaviour variables - attitudes towards behaviour, subjective norms and perceived behavioural control - and the number of steps taken by adults wearing an activity-tracking smart device.
H3 - There will be a significantly positive relationship between mobile communication usage, vehicle journey time and physical activity engagement.
Methodology
Participants:
Sixty-nine healthy participants were recruited from mainly the Republic of Ireland and also the United Kingdom. The sample consisted of 41 men and 28 women between the ages of 18 and 64 years of age. All participants had ownership or access to a smart mobile device, running the Google Android operating system, for the two-week duration of the experiment. As an incentive to participate, the Smartband activity-tracking device was offered as a gift.
Design:
The study was quantitative in nature, using a randomised mixed groups experimental design. Participants were assigned to either one of two groups receiving the intervention of the “activity-tracking” device at different time periods. The within groups independent variable was ‘time’ (Week 1 or Week 2) and the between groups independent variable was ‘group’ (Group A= Smartband for first week, no Smartband for second week – Lifelog application only), (Group B = Smartband for second week, no Smartband for first week – Lifelog app. only). The dependent variable was ‘steps’.
The study also had correlational design aspects. Multiple regressions were used to test casual relationships between variables. In the second hypothesis, the predictor variables were subsection scores on the TPB measures; attitudes, subjective norms, perceived behavioural control and behavioural intentions. The criterion variable was ‘steps’. In testing the third hypothesis, the predictor variables were ‘transport hours’ and ‘communication hours’. The criterion was ‘steps’.
Materials:
i) Each participant from both groups received either a printed and digital copy of a produced health warning/advice sheet, listing key points and statistics related to the health risks of obesity, physical inactivity and being sedentary.
ii) The questionnaire contained two main sections. The first section sought to establish the participant’s physical activity level at baseline by using the Godin Leisure-Time Exercise Questionnaire45. Participants were asked “During a typical 7-Day period (a week), in your leisure time, how often do you engage in any regular activity long enough to work up a sweat (heart beats rapidly)?” which had then three options to choose from “often”, “Sometimes”, “Never/Rarely”. The second section of questionnaire used an identical replication of the physical activity designed TPB Questionnaire used by Armitage46 measuring the following
45 Gaston Godin, and Roy J. Shephard. “Godin Leisure-Time Exercise Questionnaire.”Medicine and Science in
Sports and Exercise. Supplement: S36-S38: 29 June 1997. http://www.godin.fsi.ulaval.ca/EN_Index.html
87
variables at baseline on 7-point scales: attitudes, subjective norm, perceived behavioural control and behavioural intention. Guidelines in Theory of Planned Behaviour construction by Ajzen47 were noted.
In measuring attitude, participants were asked to rate the following stem on a scale of 1 to 7: “For me, participating in regular physical activity would be . . . ” which was then anchored by the adjective choices of dull–interesting, unpleasant–pleasant, boring– stimulating, unhealthy–healthy, bad–good, and useless–useful. The mean of the six responses was used as a measure of attitude. In measuring Subjective norm, the following were rated on a scale of 1 to 7 and the mean of the total used: “People close to me think I should participate in regular physical activity… disagree/agree”; “People who are important to me would . . . disapprove of my participating in regular physical activity/approve of my participating in regular physical activity”; and “People close to me think I . . . should not participate in regular physical activity/should participate in regular physical activity”. The mean of the
three responses was used as a measure of subjective norm. To measure perceived behavioural control, the following were rated on a scale of 1 to 7 and the mean average of the total used: “To what extent do you see yourself as being capable of participating in regular physical activity? incapable–capable”; “How confident are you that you will be able to participate in regular physical activity? not very confident–very confident”; “I believe I have the ability to
participate in regular physical activity… definitely do not–definitely do”; and “How much
personal control do you feel you have over participating in regular physical activity?... no control–complete control”. To measure behavioral intention, the following were rated on a scale of 1 to 7 and the mean average of the total used: “How often do you intend to take part in regular physical activity? never–frequently,” and “I want to exercise regularly… definitely do not–definitely do”.
According to Armitage48, Cronbach’s alpha indicated good internal reliability on each of the scale measurements. Scoring: In each category of questions, the mean of the items are taken and used as a measure.
iii) Each participant was also provided with a second information sheet – “The 10,000 steps challenge” taken from the UK’s National Health Service website - detailing the recommended daily step count of 10,000 steps along with further information explaining the benefits of walking, the calories burned from 10,000 steps, the best way to start and recommendations on how to go about achieving this.
Apparatus:
i) A unit of the Sony SmartBand SWR10 with activity-tracking technology was provided to each participant along with a Smartband charger and an easy-to-use step guide. Suitable for 24/7 wear, the Smartband is built with comfortable lightweight material and is fully
waterproof49.
ii) The Sony Mobile Lifelog application (includes GPS tracking technology) was downloaded onto the participant’s smartphone mobile device. Working as standalone or in unison with the Smartband when paired via Bluetooth connection, this mobile application automatically measured, uploaded and recorded the required experimental data. Physical activity stats were automatically measured, recorded and uploaded throughout the two-week period. Activity
47 Icek Ajzen. “Designing a TPB questionnaire.” (2006). http://people.umass.edu/aizen
48 Christopher. J. Armitage, “Can the Theory of Planned Behavior Predict the Maintenance of Physical Activity?” Health Psychology24, no. 3 (2005), doi: 10.1037/0278-6133.24.3.235
49 Sony Mobile. “Smartband SWR10.”
88
categories tracked include: walking, running, and cycling. Two more categories of information were collected and stored: The participant’s travel time made by vehicle (i.e. car, bus) and the participant’s time spent communicating by mobile (i.e. texting, calling, emailing, social media). The application’s use of GPS tracking technology allowed greater accuracy in measuring physical activities over a distance travelled and the speed of travel, for example it would recognise if the participant were walking versus travelling by motor vehicle. In recognising whether the participant was walking versus running, the GPS paired with the Smartband technology, would consider the distance travelled, the speed and the participant’s arm movement. In terms of the data accuracy of the device, an independent study by ElAmrawy et al.50 evaluating the accuracy and precision of a number of market wearable devices, the Sony Smartband SWR10 received an accuracy level of 97.01%. For this study, the participant was encouraged to feedback any potentials errors that may have been observed.
Procedure:
The experiment began with the first intervention; participants were presented with the health warning/advice sheet and asked to read through it. Time was allowed for open discussion or questions posed to experimenter. Upon completion of the required questionnaire and TPB measures, a short tutorial and set-up was given on the Sony SmartBand SWR10 and Lifelog application. Lastly, each participant was provided with the details on how to achieve an easy-to-follow goal of 10,000 steps a day. Participants were not bound to any goal or target but simply presented with the relative information to encourage a more active lifestyle. In order to retrieve the necessary data, participants followed instructions by taking mobile phone screen-shots of the require elements and forwarded by email or WhatsApp messaging service after the two week completion period. The Smartband served as a dual purpose. Firstly, to record and store accurate activity data, even when the user had left their phone away from them, for example at a work desk when going for a coffee or at home on a kitchen table and not in their pocket. Secondly, the Smartband acted as a potential motivational tool, allowing participant’s to set personalised goals, whilst remaining always switched on and in plain sight.
Instructions for week without Smartband device:
Participants were instructed to maintain their mobile phones on them at all times in order for the Lifelog application to collect the relevant data precisely.
All participants were debriefed at end of experiment and given the opportunity to ask questions and also communicate whether any issues or constraints occurred during the experiment period. Relevant feedback was noted.
Results
Descriptive Statistics
Thirty-six participants were assigned to group A and thirty-three participants to group B. Table 1 shows the sample (N=69) consisted of 41 males (59%) and 28 females (41%). The age of participants ranged from 18-24 years (7.2%), 25-34 years (44.9%), 35-44 years (37.7%), 45-54 years (7.2%) and 56-64 years (2.9%). When wearing the Smartband tracker device, males took more steps than females on average over the week. The mean for males was 50068 steps (SD=23487) and the mean for females was 41159 (SD=19262). When not
89
wearing the Smartband tracker device, males still averaged more with a mean for males of 40352 steps (SD=21094) and mean for females of 26591 (SD=18243).
90 Variable N % Mean SD
Gender Male Female Age 18-24 25-34 35-44 45-54 55-64
Steps per Sex
Males with Smartband Males without Smartband Females with Smartband Females without Smartband
Total Steps of Participants _with Smartband
_without Smartband 41 28 5 29 27 5 2 41 41 28 28 69 69 59 41 7.2 44.9 37.7 7.2 2.9 59 59 41 41 100 100 - - - - - - - 50068.44 40352.17 41159.68 26591.68 46453.03 34768.20 - - - - - - - 23487.48 21094.40 19262.85 18243.75 22164.38 21025.68
Table 1 Demographic Variable Descriptives
Inferential Statistics
H1: Screening of data was carried out to ensure all variables met the criteria for assumptions of a two-way mixed analysis of variance. Table 2 shows the summary of results from the analysis that found there to be a significant interaction effect between the time wearing the Smartband activity-tracking device and the time not wearing the Smartband (F (1, 67) = 39.82, p < .001) with an effect size of 37%. In relation to main effects, there was no significant difference of steps if allocated to Group A versus steps if allocated to Group B (F (1, 67) = .61, p = .439), indicating that the health guide sheet as an intervention had no significant impact. There was also no significant difference in steps between groups (F (1, 67) = .48, p = .491) with an effect size of .7%.
Table 2 Analysis of Variance Summary
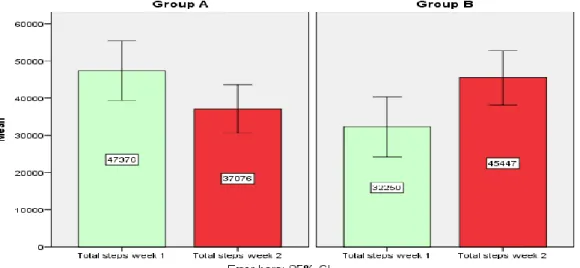
Variables Groups Means SD df F Sig. Eta2 Time (Wk1) A 47375.67 23737.03 1, 67 .61 .439 .009
B 32250.24 22919.15
Time (Wk2) A 37076.33 19161.86 1, 67 .48 .491 .007 B 45446.46 20631.12
Time * Group A, B 1, 67 39.82 .000** .373
** p < .001.
91
32250.24 steps (SD=22919.15). During week 2, when Smartband usage was reversed, participants of Group A averaged 37076.33 steps (SD=19161.86) while Group B averaged 45446.46 (SD=20631.12).
Figure 1. Bar chart showing mean number of steps per group over two weeks
H2: A preliminary screening of data was carried out to ensure all variables met the criteria for assumptions of multiple regressions (i.e. Pearson correlation, multicollinearity, multivariate outliers). The scores on all of the theory of planned behaviour variables were very positive indicating strong intentions and positive attitudes towards engaging in physical activity. Mean scores for each of the theory of planned behaviour constructs fell above each of the midpoint of scale responses. Table 3 presents the descriptive statistics and the bivariate correlations between the theory of planned behaviour variables and steps measured while wearing and while not wearing Smartband activity-tracking device. The zero-order correlations revealed attitudes, subjective norm and perceived behavioural control were all significantly correlated with behavioural intentions. None of the variables were significantly correlated with steps taken with the Smartband or steps taken without the Smartband.
Table 3 Zero-Order Correlations, Means and Standard Deviations of Variables
Variable 1 2 3 4 5 6 M SD 1. Attitude — .18 .45** .52** -.08 -.01 6.19 .70 2. Subjective norm — .32** .25* -.05 .04 6.10 1.06 3. Perceived behav. cont. — .56** .06 .22 6.08 .95
4. Intention — -.01 .06 5.98 .94
5. Steps with Smartband — 46453.03 22164.38
6. Steps without Smartband — 34768.20 21025.69
* p < .05. ** p < .01.
92
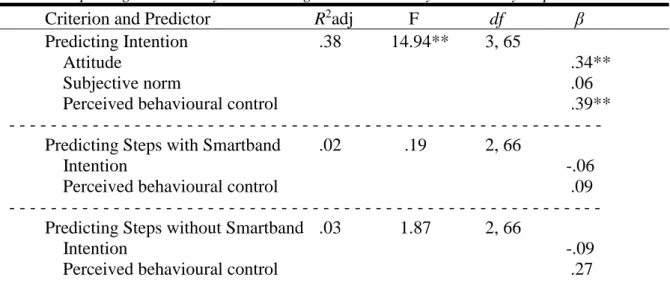
attitudes towards physical activity (β = .335, p = .003, 95% CI = .164-.738),), and perceived behavioural control (β = .393, p = .001, 95% CI = .169-.607) significantly predicted behavioural intentions, but subjective norms did not (β = .057, p = .574, 95% CI = -.128-.229.
In the second multiple regression analysis, behavioural intention and perceived behavioural control were tested to determine if they were predictors of physical activity (steps) when wearing the Smartband. The results of the regression indicated that the two predictors explained 2% of the variance (R2 = .024, F (2, 66) = .19, p = .829). It was found that perceived behavioural control did not predict steps (β = .090, p = .544, 95% CI = -4790.683-9009.847) and behavioural intention did not either (β = .059, p = .693, 95% CI = -8363.480-5595.075).
In the third multiple regression analysis, behavioural intention and perceived behavioural control were tested to determine if they were predictors of physical activity (steps) when not wearing the Smartband. This was not significant.
Table 4 Multiple Regression Analysis Predicting Intention and Physical Activity Steps
Criterion and Predictor R2adj F df β
Predicting Intention .38 14.94** 3, 65
Attitude .34**
Subjective norm .06
Perceived behavioural control .39**
- - - Predicting Steps with Smartband .02 .19 2, 66
Intention -.06
Perceived behavioural control .09
- - - Predicting Steps without Smartband .03 1.87 2, 66
Intention -.09
Perceived behavioural control .27
** p < .01.
93
Table 5 Multiple Regression Predicting Physical Activity Steps Regressed with Time Spent Communicating by Mobile and Time Spent Travelling by Vehicle
Criterion and Predictor R2adj F df β Predicting Steps with Smartband .03 .09 2, 60
Communication .05
Transport -.01
- - - Predicting Steps without Smartband .03 .11 2, 59
Communication .06
Transport .00
Discussion
These findings were consistent with findings from previous physical activity research51,52,53. According to the National Health Service54, a person takes on average 3,000-4,000 steps per day. The findings of this study held some support for this with average daily steps count of participants without the Smartband being 4966 steps. However, with an average of 6636 steps per day taken when wearing the Smartband, this indicates a strong increase (approx. 25%).
Interestingly, many health organisations also advocate a 5-day a week physical activity target and although while wearing the Smartband, less than ten percent of participants reached the 70,000 weekly steps marker recommended by health organisations55,56, of interest is that 39.1% of participants in this study surpassed 50,000 steps within the week while wearing the Smartband. This is encouraging as it suggests that the integration of smartphone technology in changing physical activity behaviour has positive immediate effects and supports related discussions outlined by Luxton et al.57
The preceding analysis supported the first hypothesis with results indicating a strong uplift in the number of steps taken while wearing the Smartband activity-tracking device. These interesting findings add support to a review of articles conducted by Burke et al.58 investigating the use of mobile technologies across a number of health categories, including studies that looked at increasing physical activity. The review recognised the potential of smartphone applications and wearable sensors in helping people make healthier lifestyle
51Mario R. Azevedo, Cora L.P. Araújo, Felipe F. Reichert, Fernando V. Siqueira, Marcelo Cozzensa da Silva, and Pedro C. Hallal. “Gender differences in leisure-time physical activity.” International Journal of Public Health 52, no. 1 (2007), doi: 10.1007/s00038-006-5062-1.
52Mark G. Davis, Jane E. Shill, Janice L. Thompson, Jo C. Coulson, Melvyn Hillsdon, Debbie J. Sharp and Kenneth R. Fox. “Objectively Measured Patterns Of Physical Activity: The Older People And Active Living (opal) Project.” Medicine & Science in Sports & Exercise 41, no. 1 (2009), doi:
10.1249/01.MSS.0000355689.52541.f7
53Marco Bardos, “Theory of Planned Behaviour, Participation and Physical Activity Communication in the
Workplace.” PHd diss., Università della Svizzera italiana, 2012, https://doc.rero.ch/record/29176/files/2012COM001.pdf
54National Health Service. “The 10,000 Step Challenge.”
55Irish Heart Foundation. “Ways to Live Better: Be Active & Be Happy.” 56National Health Service. “The 10,000 Step Challenge.”
57David D. Luxton, Russell A. McCann, Nigel E. Bush, Matthew Mishkind, and Greg M. Reger. “mHealth for mental health: Integrating smartphone technology in behavioral healthcare.’ Professional Psychology: Research And Practice42, no. 6 (2011), doi:10.1037/a0024485
58 Lora E. Burke, Jun Ma, Kristen M.J. Azar, Gary G. Bennett et al. “Current Science on Consumer Use of Mobile Health for Cardiovascular Disease Prevention.” American Heart Association, doi:
94
choices, however, it also recognised the need for further research as have other related studies59,60.
Upon completion of this experiment, feedback was gathered from the participants available to comment, which included the majority of sample, and allowed for some important insights to be gathered. Firstly, a very high number of the participants explained that they felt propelled to engage in more physical activity more so when wearing the Smartband and that this was purely due to the Smartband being constantly strapped to their wrist, acting as somewhat of a constant all-day reminder. This is interesting, as bearing in mind, the Lifelog mobile application remained operational also during the week-off (no Smartband) period, still collecting data and allowing participants to easily check their daily activity recorded levels. Secondly, participant’s explained that the real-time data that was collected and observational through the Lifelog application presented them with never seen before insights about their actions and these new “learnings” impacted their decisions more. For example: individuals were able to observe and compare calculations of their time spent physically active versus long hours travelling by car or public transport. These insights influenced decisions, for example, parking the car in a space further from the door or climbing the stairs instead of taking the elevator. Thirdly, some participants revealed a positive knock on effect on friends, family and work colleagues. For example, a participant sharing the same office environment as work colleagues, with similar daily hours spent stationed at a computer desk, explained how a behavioural change to physical activity had spread to the colleagues who had recognised similar patterns. Lastly, participants admitted that when paired with experimental partners, they felt a natural competitive driver. These last two points provide support for the findings into a TPB related study by Howland et al.61 suggesting relationship partners are influential to changing health-related behaviour in one another.
In addition, the findings suggest that receiving health warnings/advice messages are not a significant influential factor in changing physical activity health behaviour. Importantly, these findings support the inclusion of self-monitoring technology as an effective tool in positively changing physical activity health behaviour. Furthermore, findings suggest that worldwide health organisations such as World Health Organisation, Irish Health Organisation and the UK’s National Health Service may need to review and adapt their approach somewhat, insofar as physical activity health warnings and advice alone are perhaps not as effective as other potential alternatives or additions. Recommendations for stronger health warning messages through practical visual examples are advised.
In testing the second hypothesis, findings indicated that the Theory of Planned Behaviour was not a strong predictor of physical activity engagement whether wearing or not wearing the activity-tracking Smartband. Although, the TPB model has had substantial support for predicting physical activity behaviour62, 63, there was no supportive evidence found in this present study and the null cannot be rejected. The findings raise questions to the validity of TPB’s model in terms of its
59 Kathryn Mercer, Melissa Li, Lora Giangregorio, Catherine Burns and Kelly Grindrod. “Behaviour Change Techniques Present in Wearable Activity Trackers: A Critical Analysis.” Journal of Medical Internet Research MHealth UHealth 4, no. 2 (2014), doi: 10.2196/mhealth.4461.
60 Elizabeth J. Lyons, Zakkoyya H. Lewis, Brian G. Mayrsohn, and Jennifer L. Roland. “Behaviour change techniques implemented in electronic lifestyle monitors: a systematic content analysis.” Journal of Medical Internet Research 16, no. 8 (2014), doi: 10.2196/jmir.3469.
61 Maryhope Howland, Allison K. Farrell, Jeffrey A. Simpson, Alexander J. Rothman, Rachel J. Burns, Jennifer Fillo and Jhon Wlaschin. “Relational Effects on Physical Activity: A Dyadic Approach to the Theory of Planned Behavior. Health Psychology 35, no. 7 (2016): 733-741. doi: 10.1037/hea0000334
62 Melissa N. Galea, and Steven R. Bray. “Predicting walking intentions….”Rehabilitation Psychology 51, no. 4 (2006), doi:10.1037/0090-5550.51.4.299
95
application in a modern day setting where technology and the development of smart connected devices that allow real-time precise activity-tracking capabilities have become very relevant. The evidence indicates an unpredictability of the level of physical activity a person may engage in or the level of activity the individual may be prompted to engage in if wearing an activity tracking-device.
In testing the third hypothesis, findings indicate that neither the time a person spends travelling by means of transport such as car or bus, nor the time a person spends communicating by mobile device, have any significant determination on the level of physical activity that person engages in. The findings counter suggestions and claims made linking the usage of sedentary modes of travel to causes of obesity and inactivity. As such, the null cannot be rejected.
Conclusion
In conclusion, this study differs from many previous studies analysing health behaviour in that it involved the use of relevant modern day technology in the investigation. The findings support the endorsement and use of self-monitoring activity-tracking devices in the domain of health. However, the sustainability of targeted health behaviour is yet to be explored and a number of shortcomings still exist in the research with future research options plentiful. Furthermore, it would be valuable to closely examine the theory of planned variables in relation to a technologically influenced context.
References
Ajzen, Icek. “Designing a TPB questionnaire.” (2006). http://people.umass.edu/aizen
Ajzen, Icek. "The theory of planned behavior". Organizational Behavior and Human Decision Processes 50, no. 2 (1991): 179–211. doi:10.1016/0749-5978(91)90020-T.
Armitage, Christopher J. “Can the Theory of Planned Behavior Predict the
Maintenance of Physical Activity?” Health Psychology 24, no. 3 (2005), doi: 10.1037/0278-6133.24.3.235
Azevedo, Mario R., et al. “Gender differences in leisure-time physical activity.”
International Journal of Public Health 52, no. 1 (2007), doi: 10.1007/s00038-006-5062-1.
Bardos, Marco. “Theory of Planned Behaviour, Participation and Physical Activity Communication in the Workplace.” PHd diss., Università della Svizzera italiana, 2012, https://doc.rero.ch/record/29176/files/2012COM001.pdf
BBC. “Do you really need to take 10,000 steps a day to keep fit?” (2015), http://www.bbc.com/news/magazine-33154510
Bolin, Rachel C. “Mobile Health Technology and Health Behaviour. A Look into the
Workplace Setting.” Theses and Dissertations--Community and Leadership Development, no. 5. 2013), http://uknowledge.uky.edu/cld_etds/5
96
and sleep on BMI, cardiovascular function, and salivary glutathione concentration.” Journal Of Exercise Physiology Online 18, no. 4 (2015), doi:
https://www.asep.org/asep/asep/JEPonlineAUGUST2015_Stover.pdf
Brunstein, Angela, Joerg Brunstein and Selma L. Mansar. “Integrating Health
Theories in Health and Fitness Applications for Sustained Behavior Change: Current State of the Art.” Creative Education 3, no.1-5 (2012), doi: 10.4236/ce.2012.38b001
Bryan, Angela, Jeffrey D. Fisher, and William Fisher. “Tests of the mediational role
of preparatory safer sexual behavior in the context of the theory of planned behavior.” Health Psychology 21, no. 1 (2002), doi: 10.1037/0278-6133.21.1.71
Burke, Lora E., et al. “Current Science on Consumer Use of Mobile Health for Cardiovascular Disease Prevention.” American Heart Association, doi:
10.1161/CIR.0000000000000232
Central Statistics Office. “Census 2016 Results - Commuting In Ireland.”
https://www.cso.ie/en/csolatestnews/pressreleases/2017pressreleases/pressstatementcensus20 16resultsprofile6-commutinginireland/
Commission for Communications Regulation. “Mobile Consumer Experience Survey” (2017),
https://www.comreg.ie/publication/mobile-consumer-experience-survey/
Davis, Mark G., et al. “Objectively Measured Patterns Of Physical Activity: The Older People And Active Living (opal)Project.” Medicine & Science in Sports & Exercise 41, no. 1 (2009), doi: 10.1249/01.MSS.0000355689.52541.f7
Direito, Artur, et al. “Do physical activity and dietary smartphone applications
incorporate evidence-based behaviour change techniques?” BioMed Central Public Health 14, no. 646 (2014), doi: 10.1186/1471-2458-14-646.
ElAmrawy, Fatema Mahmoud, B. Pharm, and Mohamed Ismail Nounou. “Are
Currently Available Wearable Devices for Activity Tracking and Heart Rate Monitoring Accurate, Precise and Medically Beneficial?” Healthcare Informatics Research 21, no. 4 (2015), doi: 10.4258/hir.2015.21.4.315
Fasi.ie. “Consumer Doc Post Consultation FINAL.” (2012), https://www.fsai.ie
Finkelstein, Eric A., et al. “Effectiveness of activity trackers with and without
incentives to increase physical activity (TRIPPA): a randomised controlled trial.” The Lancet Diabetes & Endocrinology 4, no. 12 (2016), doi: 10.1016/S2213-8587(16)30284-4
Galea, Melissa N., and Steven R. Bray. “Predicting walking intentions and exercise in individuals with intermittent claudication: An application of the theory of planned behavior.” Rehabilitation Psychology 51, no. 4 (2006),doi:10.1037/0090-5550.51.4.299
Godin, Gaston and Gerjo Kok. “The Theory of Planned Behaviour: A Review of Its Applications to -Related Behaviors.” American Journal of Health 11, no. 2
97
Godin, Gaston, and Roy J. Shephard. “Godin Leisure-Time Exercise
Questionnaire.” Medicine and Science in Sports and Exercise. Supplement: S36-S38: 29 June 1997. http://www.godin.fsi.ulaval.ca/EN_Index.html
Harvard T.H. Chan School of Public Health. “Obesity Causes: Physical Activity.”
https://www.hsph.harvard.edu/obesity-prevention-source/obesity-causes/physical-activity-and-obesity/
Howland, Maryhope, et al. “Relational Effects on Physical Activity: A Dyadic
Approach to the Theory of Planned Behavior. Health Psychology 35, no. 7 (2016): 733-741. doi: 10.1037/hea0000334
Irish Heart Foundation. “Ways to Live Better: Be Active & Be Happy.” https://irishheart.ie/your-health/ways-to-live-better/be-active/
Ito, Tiffany A., et al. “Testing an expanded theory of planned behavior model to
explain marijuana use among emerging adults in a promarijuana community.” Psychology Of Addictive Behaviors 29, no. 3 (2015): 576-589. doi:10.1037/adb0000098
Kozo, Justine, et al. “Sedentary behaviors of adults in relation to neighborhood walkability and income.” Health Psychology 31, no. 6 (2012), doi:10.1037/a0027874
Lordan, Grace and Debayan Pakrashi. “Do All Activities “Weigh” Equally? How Different Physical Activities Differ as Predictors of Weight.” Risk Analysis 35, no. 11 (2015), doi: 10.1111/risa.12417.
Luxon, David, et al, “mHealth for mental health: Integrating smartphone technology
in behavioral healthcare.” Professional Psychology: Research And Practice 42, no. 6 (2011): 505-512. doi:10.1037/a0024485
Lyons, Elizabeth J., et al. “Behaviour change techniques implemented in electronic
lifestyle monitors: a systematic content analysis.” Journal of Medical Internet Research 16, no. 8 (2014), doi: 10.2196/jmir.3469.
Manchanda, Rajesh V., Darren W. Dahl and Kristina D. Frankenberger. "Shocking Ads! Do They Work?” Advances in Consumer Research 29, (2002),
http://acrwebsite.org/volumes/8624/volumes/v29/NA-29
Martin, Ryan J., et al. “Using the theory of planned behavior to predict gambling behavior.” Psychology Of Addictive Behaviors 24, no. 1 (2010), doi:10.1037/a0018452
Mercer, Kathryn, et al. “Behaviour Change Techniques Present in Wearable Activity Trackers: A Critical Analysis.” Journal of Medical Internet Research MHealth UHealth 4, no. 2 (2014), doi: 10.2196/mhealth.4461.
98
National Health Service. “The 10,000 Step Challenge.” (2015),
http://www.nhs.uk/Livewell/loseweight/Pages/10000stepschallenge.aspx
National Heart, Lung and Blood Institute. “Health Topics>What Causes Overweight and Obesity>Causes.” http://www.nhlbi.nih.gov/health/health-topics/topics/obe/causes
National Service Executive. “Obesity>Causes of Obesity.” https://www.hse.ie/eng/health/az/o/obesity/causes-of-obesity.html
Ng, Marie, et al. “Global, regional, and national prevalence of overweight and obesity in children and adults during 1980-2013: a systematic analysis for the Global Burden of Disease Study 2013. The Lancet 384, no. 9945, (2014),
http://www.thelancet.com/pdfs/journals/lancet/PIIS0140-6736(14)60460-8.pdf
Ogden, Jane. Health Psychology: A Textbook (4th ed.) 2007: [Dawsonera version]. https://www.dawsonera.com/readonline/9780335230105/startPage/48
Piwek, Lukasz, et al. “The Rise of Consumer Health Wearables: Promises and Barriers.”PLoS Med 13, no. 2 (2016), doi: 10.1371/journal.pmed.1001953
Poirier, Josée, et al. “Effectiveness of an Activity Tracker and Internet Based Adaptive Walking Program for Adults: A Randomized Controlled Trial.” Journal of Medical Internet Research 18, no. 2 (2016), doi: 10.2196/jmir.5295
Safe Food. “Proportion of overweight and obese males and females to increase in most European countries by 2030.” http://www.safefood.eu/Professional/Nutrition/Nutrition-News/May-2015/Proportion-of-overweight-and-obese-males-and-femal.aspx
Sallis, et al. “Sedentary behaviors...” Health Psychology 31, no. 6 (2012): 704-713. doi:10.1037/a0027874
Sniehotta, Falko, Justin Presseau and Vera Araújo-Soares. “Time to retire the theory of planned behaviour.” Health Psychology Review 8, no. 1 (2014). doi:
10.1080/17437199.2013.869710
Sony Mobile. “Smartband SWR10.”
http://www.sonymobile.com/ie/products/smartwear/smartband-swr10/#tabs
Statista. “Health and fitness tracker global unit sales forecast 2014-2015, by region.” http://www.statista.com/statistics/413265/health-and-fitness-tracker-worldwide-unit-sales-region/
Swinburn, Boyd, et al. “Diet, nutrition and the prevention of excess weight gain and obesity.” Public Health Nutrition 7, no. 1A (2004), doi: 10.1079/PHN2003585
99
World Health Organisation. “Global Action Plan: for the prevention and control of noncommunicable diseases 2013-2020”, 5.
http://apps.who.int/iris/bitstream/10665/94384/1/9789241506236_eng.pdf?ua=1
World Health Organisation. “Global Health Observatory data: Obesity.” http://www.who.int/gho/ncd/risk_factors/obesity_text/en/
World Health Organisation. Global Strategy on Diet, Physical Activity and Health. http://www.who.int/dietphysicalactivity/diet-overview/en/
World Health Organisation. “Media Centre: Fact sheet: Obesity and Overweight.”