USING GIS TECHNOLOGY IN HYDROGEOLOGICAL ANALYSIS
CAMELIA SLAVE1, IOANA VIZIREANU2
1.University of Agronomic Sciences and Veterinary Medicine, Mărăști no 59, Bucharest 011464,
Romania
2.National Institute for Aerospace Research "Elie Carafoli" - INCAS , Iuliu Maniu, no 220, Bucharest
061126 , Romania
Keywords: Danube, GIS, hydrology, modeling
ABSTRACT
The main purpose of this study was to present a hydrological model to a meadow area of the Danube.
GIS tools has multiple for the achievement thematic maps that can model various processes. The methods are based on topographic characteristics of the land and river characteristics existing in the neighborhood .For this area maps were created using the program ArcMap10.1.
INTRODUCTION
For over 20 years it was adopted the United Nations Framework Convention on Climate Change. The aim of this convention is to establish a global framework on climate change.
Its objective is: "Achieve stabilization of greenhouse gas concentrations in the atmosphere at level emissions to prevent dangerous anthropogenic interference with the climate system. This level will be achieved within a time frame sufficient to allow ecosystems to adapt naturally to climate change, so that food production is not threatened and economic development to take place in a sustainable manner. "
In December 1997 it took place the third Conference of Parties in Kyoto, Japan. The conference represented a new approach to climate change from a global perspective. The Conference urged the parties to take binding commitments to limit emissions of GHGs to a quota. Romania has signed the Kyoto Protocol in 1999 and ratified in January 2001 by Law 3/2001, being the first country to do so. Government Decision 645/1996 is established through the National Commission on Climate Change, and by Government Decision 645/2005 be adopted National Strategy on Climate Change.
Once Romania joins the European Union on 1 January 2007 is required to take into account the requirements of its global change concerns into development of future environmental policy.
Worldwide there is a rise in temperature of 0.760C compared with 1850. And the
lack of effective environmental policies in relation to global changes that will lead to
between 1.8 to 4 0C by 2100, according to our forecasts - Fourth Assessment Report of
the Intergovernmental Panel on Climate Change. This increase is the highest recorded since the beginning of the industrial era to the present.
Also in this report are cautioned that "warming of the climate system is unequivocal, already apparent in the comments on the increase in global average temperature of the air and oceans, expanding the melting of snow and ice, as well as raising average global sea.
At the same time it highlights the problems due to air pollution with direct consequences for global warming. There was an increase in global temperature due to accumulation of atmospheric gases such as carbon dioxide. Reduce heat dissipation carbon dioxide from Earth but does not block sunlight. This increase in carbon dioxide levels has negative effects on agriculture.
According to statistics global land area is occupied 1/3 of the dry zone, about 37.6
affected. The land covers 40% of the land area and is inhabited by 15% of the world population. 25% of the land is affected by different land degradation processes. Area affected by desertification occupies 36% of the continent of Africa, 25.4% of Central and North America, the rest in Europe and Australia. In Europe affected by desertification are 10 Member States of the European Union.
Romania has 14.7 million hectares of farmland, of which 9.4 million hectares are arable land. It also notes that 7 million hectares of agricultural land are affected by drought and 4 million ha are affected by excess moisture. Droughts affect crop production and causes a reduction in agricultural output of 30- 50%.
The land use, table 1 and table 2
- Thousands
ha-Tabel 1 Land use
Specification 2007 2008 2009 2010 2010* 2011 2012
Agricultura rea, of wich:
14709,3 14702,3 14684,9 14634,5 13306 14621,5 14615,1
Arable 9423,3 9415,1 9422,5 9404,0 8306 9379,5 9392,3
Pastures 3330,0 3330,0 3313,8 3288,7 4506 3279,3 3270,6
Rough 1531,4 1532,4 1528,0 1529,6 4506 1554,7 1544,9
Vineyard 218,0 214,5 215,4 213,6 312 211,3 210,5
Orchards 206,6 207,3 205,2 198,6 312 196,7 196,8
Family gardens - - - - 182 -
-Tabel 2 Irrigation
Specification 2007 2008 2009 2010 2011 2012
Irigations area 2997 2997 2997 2997 2997 2997
Irigation area from ANIF 320,2 257,7 296,8 83 103,3 161,3
% from irigation area 10,6 8,6 9,9 2,7 3,4 5,4
Drought is a natural phenomenon caused by rainfall below those standards. Given the long periods without rainfall, high temperatures and low relative humidity atmospheric drought occurs. Lack of rainfall leads to lower water reserves in the soil and soil drought installation. In the case where the two types of drought combine these give rise to agricultural drought. Drought may compromise agricultural crops. Globally because of the changes that have occurred through rising temperatures, decrease in precipitation led to an increase in agricultural areas affected by droughts.
Another consequence of climate change is the soil degradation. This phenomenon manifests itself through erosion by water or wind erosion. Combating this phenomenon is achieved by hydro works.
Drought is a phenomenon that can be characterized: meteorological, hydrological, economic and social.
MATERIALS AND METHODS
For the realization the hydrological modeling using GIS technology was used ArcGIS 10.1 software and its ArcView Spatial Analyst extension.
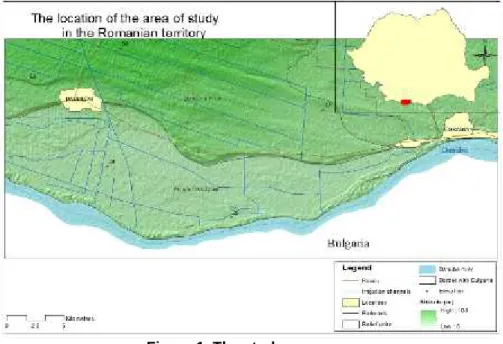
For the realization the hydrological modeling was chosen Dăbuleni area - Potelu Corabia, which belongs to Olt County area (Figure 1). The area is present follows land use.
- The special protection area at Dăbuleni Sands is located in Olt - 74% and 26% in Dolj; - The land is used for agricultural purposes 52%, 22% snuffling forest, wetlands (rivers, lakes) 10% and pastures 16%;
- The geographical area belongs to the Plain Romanaţilor subdivision Oltenia Plain and has a high terrace that descends to the Danube and side stepped the Jiu River;
- In terms of geological sedimentary rocks are present - marl, clay, sand and a layer of loess;
In the meadow meets a dune relief;
- In the common area is an area Dăbuleni lifeless dunes and sandstorms, this phenomenon of deflation is favored by the wind;
- The area has a climate with high annual average temperature (10-11 0 C), the
temperature values are the highest in the country, precipitation has ranged between 450-600 mm / year;
- The rivers that cross this territory are rivers from the southern and eastern group are all tributaries of the Danube. Jiu and Olt are the most important rivers tributaries Motru, Amaradia, and Oltet. The Danube valley has temporary swamp in period with high levels.
Figure 1. The study area map
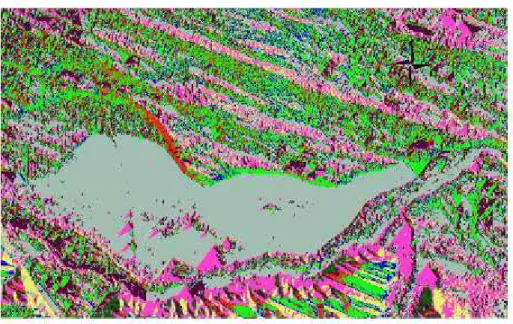
Figure 2. The hildshade map
Has been required steps to get to full steam order, this map assigns a numerical sequence segments raster representing branches of a linear network.
Another map is represent by flow direction (Figure 3). This map shows the dominant direction of flow. If a cell has the same change in z-value in multiple directions and that cell is part of a sink, the flow direction is referred to as undefined. In such cases, the value for that cell in the output flow direction raster will be the sum of those directions. When using the NORMAL option, a cell at the edge of the surface raster will flow toward the inner cell with the steepest drop in z-value. If the drop is less than or equal to zero, the cell will flow out of the surface raster.
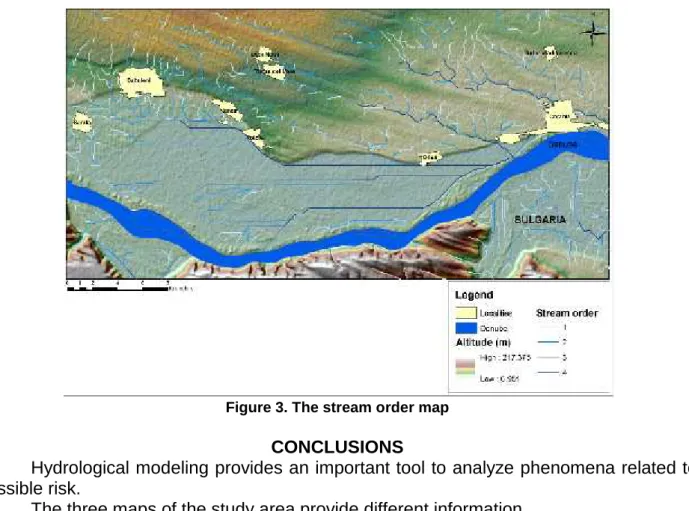
Stream Map order had the raster data stream and flow direction raster that derived from the same area. Con function was used to create raster Stream Network.
It was created 4 classes for stream order in the study area It can be noted in the plains are order 4 and 2 stream and in the high terrace area are of order 1 and order 2. (Figure 3)
Figure 3. The stream order map
CONCLUSIONS
Hydrological modeling provides an important tool to analyze phenomena related to possible risk.
The three maps of the study area provide different information.
The hildashade map understanding the targeting of slopes in the study area. Altitude values ranging from 124-230 m. The crops are influenced how are orientation slopes and elevation.
The Flow direction map presents areas of water shortage. We know that the ship is Dăbuleni – Potelu- Corabia is the most arid area in Romania.
The last map is the order stream can be seen the 4 categories of tributaries and how their spatial arrangement.
REFERENCES
1. Cristina Nenciu Posner, Iuliana Armas,(2015) Historical perspective on structural methods for flood protection in Lower Danube, GEOREVIEW –Scientific Annals of Stefan cel Mare University of Suceava vol 25 no1, pg 1-15;
2. http://www.geo-spatial.org/