©
DOI: 10.1534/genetics.104.038109
Patterns of Synonymous Codon Usage in
Drosophila melanogaster
Genes With Sex-Biased Expression
Tina M. Hambuch and John Parsch
1Section of Evolutionary Biology, Department of Biology II, University of Munich (LMU), 82152 Munich, Germany Manuscript received November 5, 2004
Accepted for publication April 22, 2005
ABSTRACT
The nonrandom use of synonymous codons (codon bias) is a well-established phenomenon in Drosoph-ila. Recent reports suggest that levels of codon bias differ among genes that are differentially expressed between the sexes, with male-expressed genes showing less codon bias than female-expressed genes. To examine the relationship between sex-biased gene expression and level of codon bias on a genomic scale, we surveyed synonymous codon usage in 7276D. melanogastergenes that were classified as male-, female-, or non-sex-biased in their expression in microarray experiments. We found that male-biased genes have significantly less codon bias than both female- and non-sex-biased genes. This pattern holds for both germline and somatically expressed genes. Furthermore, we find a significantly negative correlation be-tween level of codon bias and degree of sex-biased expression for male-biased genes. In contrast, female-biased genes do not differ from non-sex-female-biased genes in their level of codon bias and show a significantly positive correlation between codon bias and degree of sex-biased expression. These observations cannot be explained by differences in chromosomal distribution, mutational processes, recombinational environ-ment, gene length, or absolute expression level among genes of the different expression classes. We pro-pose that the observed codon bias differences result from differences in selection at synonymous and/or linked nonsynonymous sites between genes with male- and female-biased expression.
F
OR many years, nucleotide changes that did not al- selection for translational efficiency and accuracy is stronger in these genes.ter the encoded amino acid (synonymous
substitu-Synonymous codon usage, however, is expected to be tions) were believed to reflect neutral variation (Kimura
under weak selection inD. melanogaster, with the product 1968, 1977). However, the phenomenon of codon usage
of the effective population size and the selection coeffi-bias, which is the preferential use of certain codons over
cient,Nes, being⬍1 (Akashi1995;McVeanandVieira their synonymous equivalents, has been shown to be
2001). Thus, other processes, either neutral or selective, widespread across many unicellular and multicellular
may influence patterns of synonymous codon usage. For organisms. InDrosophila melanogaster, as well as several
example,Maraiset al. (2003) proposed that biased gene other organisms, codon bias is strongest among the most
conversion favoring G and C nucleotides could result in highly expressed genes (Granthamet al. 1981;
Bennet-variation in codon bias among genes and could explain
zenandHall 1982; GouyandGautier 1982;
Gros-the previously observed positive correlation between
co-jeanandFiers 1982; Duretand Mouchiroud 1999;
don bias and local recombination rate (KlimanandHey CoghlanandWolfe2000;Akashi2003). Further, in
1993;Comeronet al. 1999;Maraiset al. 2001;Heyand the species that have been studied, the favored codons
Kliman2002). This correlation also could have a selec-correspond to the most abundant isoaccepting tRNAs
tive explanation: population genetic theory predicts that (Ikemura 1981, 1982; Moriyama and Powell 1997;
selection for synonymous codon usage should be more
Kanayaet al. 1999; Duret2000). Thus, codon bias is
effective in regions of higher recombination because largely thought to be due to weak selection favoring the
linkage among selected sites, known as Hill-Robertson use of codons that are most efficiently and accurately
interference, is reduced (Hill and Robertson 1966; translated (Akashi1994, 1995; Carlini andStephan
KlimanandHey1993, 2003;Comeronet al. 1999;Hey
2003). Selection intensity for codon usage bias,
there-andKliman 2002). fore, is expected to vary among genes. Presumably,
Hill-Robertson interference among sites may affect highly expressed genes have more codon bias because
levels of codon bias in other ways as well.Betancourt
andPresgraves(2002) examined levels of codon bias in 255 genes, including 153 male-specific accessory pro-1Corresponding author:Section of Evolutionary Biology, Department
tein (Acp) genes, and found a significantly negative cor-of Biology II, University cor-of Munich (LMU), Grosshaderner Strasse 2,
relation between level of codon bias and nonsynonymous 82152 Planegg-Martinsried, Germany.
E-mail: [email protected] divergence betweenD. melanogasterandD. simulans. The
correlation could result from Hill-Robertson interfer- cesses, recombination rates, gene lengths, or absolute ence between linked synonymous and nonsynonymous expression levels cannot account for the codon bias dif-sites, with the fixation of strongly beneficial amino acid ferences between male- and female-biased genes, sug-replacements driving the fixation of linked, slightly gesting that natural selection influences synonymous deleterious synonymous substitutions (Akashi 1996; codon usage in sex-biased genes.
Betancourt and Presgraves 2002; Kim 2004). This interpretation is supported by the observation that Acp
genes evolve significantly faster than non-Acp genes MATERIALS AND METHODS (Swansonet al. 2001) and that several well-studied Acp
Identification of sex-biased genes:To classify genes as male, genes show patterns of molecular evolution consistent
female, or non-sex biased in their expression (here referred with a history of positive selection (TsaurandWu1997; to as male-, female-, and non-sex-biased genes), we used
pub-Tsaur et al. 1998; Aguade´ 1998, 1999; Begun et al. lished data from two independent studies that compared male and female gene expression by competitive microarray hybrid-2000). In addition to Acp’s, a number of other
Drosoph-ization (Parisiet al. 2003;Ranzet al. 2003) following the ap-ila reproductive genes showing increased rates of
molec-proach ofZhanget al. (2004). That is, genes with twofold or ular evolution and evidence for positive selection have
greater expression in males than in females were classified as been reported (Nurminskyet al. 1998;Tinget al. 1998; male biased, genes with twofold or greater expression in
fe-Parschet al. 2001;Betra´nandLong2003). These find- males than in males were classified as female biased, and genes ings suggest that there may be a general pattern of having less than a twofold expression difference between the sexes were classified as non-sex biased. In cases of sex-bias increased evolutionary rates in sex- and
reproduction-conflict in which a gene was sex biased in one microarray data related genes, presumably as the result of sexual selection
set and non-sex biased in the other (7% of all genes), the gene (Civetta and Singh 1999; Singh and Kulathinal was considered sex biased. However, eliminating these genes
2000;SwansonandVacquier2002). did not affect our results. In cases of sex-bias conflict in which In a recent study,Zhanget al.(2004) used expression a gene was male-biased in one microarray data set and female biased in the other (0.08% of all genes), the gene was elimi-data from microarray experiments to classifyD. melanogaster
nated from further analysis. Because the twofold cutoff is an genes as male-, female-, or non-sbiased in their
ex-arbitrary standard chosen to allow comparison of microarray pression and compared the evolutionary rates of these
results across studies, we analyzed the sensitivity of our results genes among Drosophila species. They found that male- to the choice of the cutoff value. Using cutoffs of 1.5- or 3-fold biased genes had significantly higher rates of evolution did not alter the qualitative pattern or the statistical significance of our results. Unless noted otherwise, all results presented here (measured as the ratio of nonsynonymous/synonymous
use the twofold cutoff for sex-bias classification. substitution rates) than both female- and non-sex-biased
Somatic sex-biased genes were identified using the micro-genes. Female-biased genes, in contrast, showed
evolu-array data ofParisiet al. (2004), which compared gene expres-tionary rates less than or equal to those of non-sex-biased sion between gonadectomized males and females. Germline genes. Population genetic data suggested that these dif- sex-biased genes were identified using the testes/ovaries ratio ferences were caused by increased positive selection act- fromParisiet al. (2003). In total, 282 somatic genes (145 male biased and 137 female biased) and 1959 germline genes (1083 ing on genes with male-biased expression.Zhanget al.
male biased and 876 female biased) were used (see supplemen-(2004) also compared levels of codon bias in sex-biased
tary Table S1 at http://www.genetics.org/supplemental/). genes for which interspecific divergence data were
avail-Genomic data:Complete coding sequences (CDS) corre-able. These results inversely reflected the evolutionary sponding to all annotated genes in theD. melanogastergenome rate comparisons: male-biased genes had significantly (release 3.2) were downloaded from FlyBase (http://www.fly base.org). As a quality control step, we eliminated any CDS less codon bias than both female- and non-sex-biased
that did not begin with an ATG start codon, did not have a genes, while female-biased genes had levels of codon bias
length that was a multiple of three, or that contained an greater than or equal to those of non-sex-biased genes.
internal stop codon (⬍0.5% of all sequences). For genes with The above results, however, were based on a relatively multiple transcripts, we selected only the one with the longest small sample of genes with⬍100 male- and female-biased CDS. The final sequence collection contained 13,464 CDSs, genes in each comparison. In this article, we extend the each corresponding to a unique gene in the Drosophila ge-nome. Of these genes, 7276 had matches in the combined codon bias analyses to⬎7000D. melanogastergenes for
microarray expression data set (described above) and were which annotated coding sequences and microarray data
used for analyses of codon bias (see supplementary Table S1 on sex-biased expression were available. We confirm that
http://www.genetics.org/supplemental/). For comparisons of male-biased genes have significantly less codon bias than GC content, complete chromosome arm sequences and anno-female- and non-sex-biased genes, while the latter two tated intron sequences (D. melanogastergenome release 3.2) were groups of genes have relatively equal levels of codon bias. downloaded from FlyBase. Estimates of genomic recombina-tion rates (HeyandKliman2002) were downloaded from the Furthermore, the new data allow us to examine the
rela-authors’ website (http://lifesci.rutgers.edu/ⵑheylab). The five tionship between codon bias and degree of sex-biased
different recombination estimators described byHeyand
Kli-expression. We find that as the level of sex-biased
expres-man(2002) produced nearly identical results in our analyses. sion increases, male-biased genes show less codon bias, For simplicity, we present only results using the recombination whereas female-biased genes show more codon bias. estimator,R, which is based on a comparison of the genetic
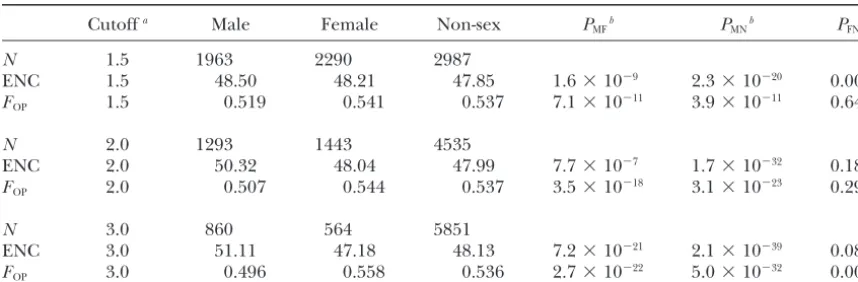
pro-TABLE 1
Levels of codon bias in genes with male -, female -, and non- sex-biased expression
Cutoffa Male Female Non-sex P
MFb PMNb PFNb
N 1.5 1963 2290 2987
ENC 1.5 48.50 48.21 47.85 1.6⫻10⫺9 2.3⫻10⫺20 0.005
FOP 1.5 0.519 0.541 0.537 7.1⫻10⫺11 3.9⫻10⫺11 0.645
N 2.0 1293 1443 4535
ENC 2.0 50.32 48.04 47.99 7.7⫻10⫺7 1.7⫻10⫺32 0.186
FOP 2.0 0.507 0.544 0.537 3.5⫻10⫺18 3.1⫻10⫺23 0.299
N 3.0 860 564 5851
ENC 3.0 51.11 47.18 48.13 7.2⫻10⫺21 2.1⫻10⫺39 0.087
FOP 3.0 0.496 0.558 0.536 2.7⫻10⫺22 5.0⫻10⫺32 0.002
N, number of genes; ENC, effective number of codons (Wright1990);FOP, frequency of optimal codons (Ikemura1981). Numbers represent the mean value for each category.
aFold expression cutoff used to classify sex-biased genes.
bP- value of two-tailed Mann-Whitney test for comparisons among male- (M), female- ( F ), and
non-sex-biased (N) genes.
To estimate the absolute expression level of the genes in our RESULTS analyses, we used the microarray data ofGibsonet al. (2004), which
Levels of codon bias in sex-biased genes: To
inves-were downloaded from the authors’ website (http://statgen.ncsu.
tigate levels of codon bias in genes with sbiased ex-edu/ggibson/SupplInfo/SupplInfo3.htm). These experiments
used microarrays of oligonucleotide probes of a standard length pression, we analyzed synonymous codon usage in 7276 (60 nt) synthesized directly on glass slides and measured the D. melanogastergenes for which we had complete coding fluorescent intensity of each spot relative to all other spots on
sequences and microarray data comparing relative levels the same array. Thus, these data are better suited for comparing
of malevs.female gene expression. As can be seen in expression levels among genes than data from arrays constructed
Table 1, there are significant differences in levels of of probes spotted with PCR products of various lengths that
measured the male/female fluorescence ratio for each spot codon bias among male-, female-, and non-sex-biased (Parisiet al. 2003;Ranzet al. 2003). For each gene, the least- genes. Male-biased genes consistently show significantly squares mean expression level reported byGibsonet al. (2004)
less codon bias than female- and non-sex-biased genes was averaged over both sexes and over both the2band
Ore-by both ENC andFOP. As the definition of male-biased gon-R strains. In cases where a gene was represented by
multi-genes (i.e., the overexpression cutoff level) becomes ple probes, the expression level was averaged over all probes.
Synonymous codon usage analyses:Codon usage bias was more stringent, the degree of significance for these dif-estimated using two measures: the effective number of codons ferences increases for both measures of codon bias (Ta-(ENC;Wright1990) and the frequency of optimal codons ble 1). In contrast, there appears to be little difference in (FOP;Ikemura1981). For ENC, lower values indicate stronger
codon bias between female- and non-sex-biased genes. synonymous codon usage bias, while forFOPhigher values
in-Using the conventional twofold cutoff to define genes as dicate stronger bias. Both measures were calculated for all
genes using the CodonW program (http://bioweb.pasteur.fr/ sex biased, there is not a significant difference between seqanal/interfaces/codonw.html). Differences in levels of co- female- and non-sex-biased genes by either measure of don bias among male-, female-, and non-sex-biased genes were
codon bias (Table 1). When the cutoff is lowered to tested using the nonparametric Mann-Whitney test. To
evalu-1.5-fold, there is less codon bias in the female-biased ate whether the degree of synonymous codon usage bias in
genes when measured by ENC, but not when measured individual genes was correlated with their relative level of
sex-biased expression, linear regression and Spearman rank- byFOP(Table 1). Using the more stringent 3-fold cutoff, correlation tests were performed using bothFOP and ENC. female-biased genes have more codon usage bias than The two measures of codon bias gave similar results; only non-sex-biased genes. This difference is significant forF
OP those forFOPare reported here. To remove the influence of
(P ⫽ 0.002) and marginally significant for ENC (P ⫽
factors known to correlate with codon usage bias (local GC
0.087). The conflicting results that are sometimes ob-content, recombination rate, gene length, and expression
level) from our comparisons among male-, female-, and non- served betweenFOPand ENC likely are caused by differ-sex-biased genes, we regressed each of these factors onFOP ences in the way that the two methods estimate codon and calculated the residuals. In all cases, the residuals were bias.F
OP is based on the frequency of a set of species-not correlated with the original factor, indicating that we
specific “optimal” codons, while ENC is based on the had successfully removed its effect on codon bias. We then
observed number of codons used for each amino acid. compared the residual values among male-, female-, and
with a male/female expression ratio⬎5, we observe a significantly negative correlation between FOP and de-gree of sex-biased expression by both linear (R ⫽ ⫺0.17,
P ⫽1.0⫻10⫺5) and rank-order (R⫽ ⫺0.16,P ⫽5.9⫻ 10⫺5) correlation tests. In contrast to the male-biased genes, female-biased genes show a weak but significantly positive correlation between codon bias and degree of female-biased expression by both linear regression (R ⫽0.23,P ⫽7.6⫻10⫺12) and rank correlation (R ⫽
0.16,P ⫽ 7.2⫻10⫺8; Figure 1B). Within the non-sex-biased genes, there was not a significant correlation between codon bias and the male/female expression ratio by either linear regression (R ⫽2.0⫻10⫺5,P ⬎
0.1) or rank correlation (R ⫽ ⫺0.013,P ⬎ 0.1). This is probably due to the fact that male/female expression ratios are constrained to a narrow window (between 0.5 and 2.0). Furthermore, these are the genes for which sex-bias is most likely to be misclassified due to the experimental error inherent in microarray hybridiza-tions. That is, these are the genes in which the male and female fluorescence intensities are closest to each other. Thus the expression ratio can easily be shifted from male biased to female biased (or vice versa) by small intensity variations caused by experimental noise.
Comparison of X-linked and autosomal genes:
Previ-ous studies have shown that genes with male-biased ex-pression are significantly underrepresented on the X
Figure1.—Relationship between codon bias and degree of
chromosome (Parisiet al. 2003;Ranzet al. 2003). The sex-biased expression. (A)FOPplotted against the male/female
same pattern is observed for the genes included in our expression ratio for 1293 male-biased genes (Spearman rank
correlation,R⫽ ⫺0.19,P⫽6.1⫻10⫺12). The line represents
survey: 11% (144/1293) of the male-biased genes were the least-squares linear regression (R ⫽ ⫺0.13, P ⫽ 2.0 ⫻ located on the X, while 18% (823/4535) of the non-10⫺7) with a slope of⫺0.0011. (B)F
OPplotted against the female/ sex-biased genes and 23% (331/1443) of the female-male expression ratio for 1443 fefemale-male-biased genes (Spearman
biased genes were located on the X. Thus it is possible rank correlation,R⫽0.16,P⫽7.2⫻10⫺8). The line
repre-that interchromosomal differences in synonymous co-sents the least-squares linear regression (R⫽0.23,P⫽7.6⫻
10⫺12) with a slope of 0.0079.
don bias could account for the observed differences among genes of the different expression classes, particu-larly if X-linked genes tend to show greater codon bias estimates of codon bias. For example, a gene with high than autosomal genes. To test this possibility, we ana-AT content at third positions will have very low codon lyzed levels of codon bias separately for X-linked and bias when measured by FOP (since the optimal codons autosomal genes. Indeed, there is a general tendency forD. melanogastertend to end in G or C), but can show for X-linked genes to show greater codon bias than relatively high codon usage bias when measured by autosomal genes across all expression classes (Table 2). ENC. Indeed, we find that the largest discrepancy be- This difference is significant for ENC within each ex-tween the two measures occurs in such cases whenFOP pression class (P ⬍0.001), while forFOPit is significant is very low (⬍35%; data not shown). within the female- and non-sex-biased genes (P ⬍0.001), The observation that male-biased genes show less co- but not male-biased genes (P ⫽0.18). These interchro-don bias as the cutoff for defining sex-biased expression mosomal differences, however, cannot explain the ob-becomes more stringent suggests that there may be a served reduction of codon bias in male-biased genes. If negative correlation between codon bias and degree of we consider only X-linked genes, male-biased genes still male-biased expression. Indeed, such a relationship is show significantly less codon bias than both female- and seen for the male-biased genes (Figure 1A). Although non-sex-biased genes (Table 2). The same result is seen weak, this correlation is significant using both a linear when only autosomal genes are considered (Table 2). regression (R ⫽ ⫺0.13, P ⫽ 2.0 ⫻ 10⫺7) and a rank- Comparison of germline and somatic sex-biased genes:
TABLE 2
Codon bias in X-linked and autosomal genes
Chromosome Male Female Non- sex PMFa PMNa PFNa
N X 144 331 823
ENC X 48.87 45.65 46.11 7.9⫻10⫺7 1.8⫻10⫺6 0.250
FOP X 0.515 0.568 0.553 2.0⫻10⫺7 4.8⫻10⫺5 0.013
N Auto 1149 1112 3712
ENC Auto 50.50 48.75 48.40 3.8⫻10⫺8 1.7⫻10⫺32 0.003
FOP Auto 0.506 0.536 0.534 3.5⫻10⫺18 6.3⫻10⫺10 0.531
N, number of genes; ENC, effective number of codons (Wright1990);FOP, frequency of optimal codons (Ikemura1981). Numbers represent the mean value for each category.
aP- value of two-tailed Mann-Whitney test for comparisons among male- (M), female- ( F ), and
non-sex-biased (N) genes.
that we used to classify sex-biased genes were based on tron GC content for the male-, female-, and non-sex-biased genes in our data set. We find that intron GC comparisons of either dissected reproductive tissues or
whole flies, our results apply mainly to germline-expressed content is remarkably consistent and does not differ significantly among the three expression classes with genes. To investigate whether there were differences
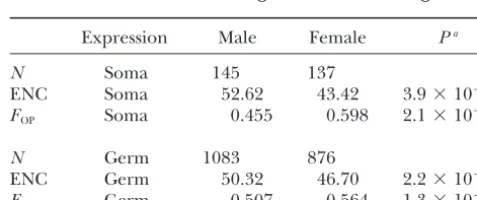
between germline and somatic sex-biased genes, we ex- intron %GC values of 39.5, 39.5, and 40.0 for male-, female-, and non-sex-biased, respectively. As an addi-amined levels of codon bias separately in the two groups
(Table 3). Germline sex-biased genes were identified tional measure to remove the influence of local GC content on codon bias differences among the three from theParisi et al. (2003) microarray data set that
compared gene expression between dissected testes and groups of genes, we regressed intron %GC onFOP and used the residuals for Mann-Whitney tests among groups. ovaries, while somatic sex-biased genes were identified
from the Parisi et al. (2004) data set that compared After this correction, male-biased genes still had signifi-cantly less codon bias than both female- and non-sex-gene expression between gonadectomized males and
females. For both germline and somatic sex-biased genes, biased genes (P ⫽5.6⫻ 10⫺9and 7.4 ⫻10⫺7, respec-tively), while female-biased genes had slightly higher we observed highly significant differences in level of
codon bias between male- and female-biased genes codon bias than non-sex-biased genes (P ⫽0.02). Biased gene conversion also is expected to increase (Mann-Whitney test,P ⬍1.0⫻10⫺16), with male-biased
genes having less codon bias in both cases (Table 3). as the local recombination rate increases (Maraiset al. 2003). Thus, differences in the recombinational envi-Interestingly, we observed significant differences in
ronment among male-, female-, and non-sex-biased genes codon bias between somatic and germline tissues for
could lead to differences in codon bias through this pro-both male- and female-biased genes (Table 3).
Male-cess. To examine this possibility, we compared local biased genes that are expressed in the germline show
recombination rate estimates (HeyandKliman2002) more codon bias than those expressed in somatic tissues
for the genes in our survey. Average recombination rate (ENC,P ⫽1.3⫻ 10⫺6;FOP,P ⫽ 5.9⫻10⫺9).
Female-biased genes, on the other hand, show the opposite
pattern. Female-biased genes expressed in germline tis- TABLE 3 sues show significantly less codon bias than those
ex-Codon bias in somatic and germline sex-biased genes
pressed in somatic tissues (ENC,P ⫽ 5.1⫻ 10⫺5;FOP,
P ⫽1.0⫻ 10⫺3).
Expression Male Female Pa
Comparison of intron base composition,
recombina-tion rates, gene lengths, and expression levels:Because N Soma 145 137
ENC Soma 52.62 43.42 3.9⫻10⫺17
most of the preferred codons inD. melanogasterend in
FOP Soma 0.455 0.598 2.1⫻10⫺17
G or C, it is possible that different mutational or gene conversion biases among genes could lead to
differ-N Germ 1083 876
ences in codon bias (Kliman and Hey 1994; Marais ENC Germ 50.32 46.70 2.2⫻10⫺29
et al. 2003). For example, if female-biased genes were F
OP Germ 0.507 0.564 1.3⫻10⫺29
more prone to G or C mutations, then one would expect
N, number of genes; ENC, effective number of codons them to show greater codon bias than male-biased
(Wright1990);FOP, frequency of optimal codons (Ikemura
genes. Such biases in mutation (or gene conversion) 1981). Numbers represent the mean value for each category. are expected to affect not only coding regions, but also aP- value of two-tailed Mann-Whitney test comparing
in-estimates, R, for male-, female-, and non-sex-biased and non-sex-biased genes are 1449 bp and 1386 bp, respectively. The CDS length difference between male-genes were 2.45, 2.51, and 2.48, respectively, and did not
differ significantly among genes of the three expression and female-biased genes is marginally significant (Mann-Whitney test,P ⫽0.04), while all other comparisons are classes (Mann-Whitney test,P ⬎0.40). Four other
esti-mators of recombination rate presented in Hey and not significant (P ⬎0.20). To remove the potential in-fluence of CDS length on codon bias differences among
Kliman (2002) also showed no significant differences
among male-, female-, and non-sex-biased genes (data the three groups of genes, we regressed the length on
FOP and compared the residuals. After this correction, not shown). To remove the potential influence of local
recombination rate on codon bias differences among male-biased genes still had significantly less codon bias than both female- and non-sex-biased genes (P ⫽2.5⫻ the three groups of genes, we regressed Ron FOPand
compared the residuals. After this correction, male- 10⫺21and 1.9⫻10⫺26, respectively), while there was no difference between female- and non-sex-biased genes biased genes still had significantly less codon bias than
both female- and non-sex-biased genes (P ⫽1.3⫻10⫺19 (P ⫽0.25).
The microarray experiments that served as the basis and 5.6⫻10⫺27, respectively), while there was no
differ-ence between female- and non-sex-biased genes (P ⫽ for our identification of sex-biased genes measured the ratio of male-to-female expression for each gene (Parisi
0.48). Although there were no differences in average
recombination rate among genes of the three expres- et al. 2003;Ranzet al. 2003). These ratios, however, do not provide information on the expression level of the sion classes, there were differences in the strength of
the correlation between FOP and recombination rate genes relative to other genes in the genome. Because codon bias is known to positively correlate with expres-within each class. This correlation was significant for
the female-biased (R ⫽0.09;P ⫽0.002) and the non- sion level, it may be that differences in absolute ex-pression level among male-, female-, and non-sex-biased sex-biased genes (R ⫽ 0.05; P ⫽ 0.004), but not for
the male-biased genes (R ⫽ 0.02;P ⫽0.45). genes are responsible for the observed codon bias differ-ences among these groups. To test this possibility, we
Comeron (2004) presented evidence for
transcrip-tion-associated mutational biases (TAMB) in human tes- used the microarray data of Gibson et al. (2004) to estimate the absolute expression level of all genes in tes. This process is expected to alter base composition
by increasing G (relative to C) and T (relative to A) con- our analysis (seematerials and methods). In general, we find that sex-biased genes are expressed at higher tent on the coding strand (Greenet al. 2003). If TAMB
were also common in Drosophila testes, then it would levels than non-sex-biased genes, with male-biased genes expressed 1.4-fold higher and female-biased expressed be expected to lead to increased %GT in the coding
strand of testis-expressed genes and could dispropor- 1.5-fold higher than non-sex-biased genes. To remove the potential influence of absolute expression on codon tionately affect synonymous codon usage in male-biased
genes. To test whether TAMB could explain the differ- bias differences among the three groups of genes, we regressed expression onFOPand compared the residu-ences in codon bias observed among male-, female-, and
non-sex-biased genes, we examined coding-strand GT als. After this correction, male-biased genes still had significantly less codon bias than both female- and non-content of introns occurring in genes of the three
ex-pression classes. As with intron GC contents, we find sex-biased genes (P ⫽9.3⫻ 10⫺13and 2.7⫻10⫺22, re-spectively), while there was no difference between fe-that intron GT contents are remarkably consistent, with
%GT values of 50.1, 50.6, and 50.1 for male-, female-, male- and non-sex-biased genes (P ⫽0.34). and non-sex-biased genes, respectively. Thus, there is
no evidence that TAMB are responsible for the reduced
DISCUSSION codon bias observed in male-biased genes. Furthermore,
TAMB cannot explain the observation that somatic Our survey of synonymous codon usage in sex-biased genes revealed a strong and consistent pattern of re-male-biased genes have significantly less codon bias than
both somatic female-biased and germline male-biased duced codon bias in genes with male-biased expres-sion relative to those with female- and non-sex-biased genes (see above).
Levels of codon bias also have been shown to nega- expression (Table 1). This result is in agreement with that previously reported for a much smaller sample of tively correlate with CDS length (Powell and
Mori-yama1997;Comeronet al. 1999;DuretandMouchi- sex-biased genes (Zhanget al. 2004). TheZhanget al. (2004) study produced conflicting results regarding
lev-roud 1999). Thus, if there were an overall trend for
male-biased genes to be longer than female-biased genes, els of codon bias in female- vs. non-sex-biased genes: comparison of 78 female-biased and 126 non-sex-biased we would expect to see reduced levels of codon bias in
male-biased genes. The genes in our survey, however, genes for whichD. yakubaEST sequences were available indicated significantly greater levels of codon bias in show the opposite trend: male-biased genes tend to be
shorter than both female- and non-sex-biased genes. female-biased genes, while comparison of 92 highly fe-male-biased genes to 99 genes with equal expression For the male-biased genes, the median CDS length is
in codon bias. In the present survey, we compared 1443 genes are considered separately, there is still signifi-cantly less codon bias in male-biased genes than in fe-female-biased and 4535 non-sex-biased genes using a
twofold expression cutoff and observed no significant male- or non-sex-biased genes (Table 2), indicating that the X/autosome distribution of genes cannot explain difference in codon bias. The contradictory results seen
in the first comparison byZhanget al. (2004) may be the observed differences. Second, we see no difference in intron GC or coding-strand GT content among male-, attributable to differences in absolute expression level
among the female- and non-sex-biased genes. Because female-, and non-sbiased genes, which would be ex-pected if the three classes of genes experienced differ-the genes used in this comparison were identified in
an EST screen (Domazet-LosoandTautz2003), they ent mutational biases. Finally, there is no significant difference in local recombination rate among male-, should be biased toward genes that are highly expressed.
Furthermore, since the EST clones were derived from female-, and non-sbiased genes, which would be ex-pected if biased gene conversion were responsible for a mixed pool of males and females in unknown
propor-tion, the expression bias could be stronger for sex-biased synonymous codon usage differences among the three groups of genes.
genes. For example, if females were underrepresented
in the original pool of flies, then a female-biased gene Differences in the type and/or strength of natural selection acting on male-, female-, and non-sex-biased would have to show relatively high levels of expression
to be represented in the EST library. Indeed, using the genes could affect levels of codon bias in the three groups of genes in a number of ways. One possibility is microarray data ofGibsonet al. (2004) to estimate
abso-lute expression level, we find that the genes in the EST that synonymous codon usage in male- and female-biased genes is adapted to match the tRNA pools in the data set show such a bias: the male- and non-sex-biased
genes have 4.5-fold higher expression than those in tissues where these genes are predominantly expressed. For example, synonymous codon usage in male-biased this study, while the female-biased genes have a 7.5-fold
higher expression. This can explain why the average values genes could be adapted to match a testis-specific tRNA pool. There is, however, little support for this hypothe-of codon bias are higher for all three groups hypothe-of genes in
theZhang et al. (2004) data set and why the greatest sis. First, significant differences in codon bias are ob-served whether it is measured asFOPor ENC (Table 1), difference is in the female-biased genes. After
correct-ing for this expression difference by regresscorrect-ing the ex- and the latter measure of codon bias makes no assump-tions about which codons are favored. Second, an analy-pression level onFOPand performing a Mann-Whitney
test on the residuals, we find no significant difference sis of synonymous codon usage in all genes included in our survey indicates that the same synonymous codons between the female- and non-sex-biased genes (P ⫽
0.67). In contrast to the EST data set, we observe no are favored/avoided in male-, female-, and non-sex-biased genes (see supplementary Tables S2 and S3 at effect of absolute expression level on codon bias
differ-ences between female- and non-sex-biased genes in this http://www.genetics.org/supplemental/). Third, there is a negative correlation between codon bias and degree study (seeresults). Because there appears to be little
or no difference in codon bias between female- and of sex-biased expression for male-biased genes (Fig-ure 1A). If synonymous codon usage in male-biased non-sex-biased genes, we conclude that reduced codon
bias is not a general property of sex-biased genes, but genes were adapted to match male-specific tRNA pools, then one would expect codon bias to increase as the instead is specific to genes with male-biased expression.
Thus, an explanation for our findings must be related degree of male-biased expression increased. The above results could be explained if there are not qualitative, to differences, either neutral or selective, between
male-and female-biased (or non-sex-biased) genes. but rather quantitative, differences in tRNA abundance between testes and other tissues. For example, the most Neutral processes, such as mutational or gene
conver-sion biases, are thought to influence patterns of synony- abundant tRNAs could be the same in all tissues, but the extent to which the tRNA pool is biased could be mous codon usage differentially throughout the genome
(KlimanandHey1994;Maraiset al. 2003). Therefore, less in testes than in other tissues. However, the codon bias differences between male- and female-biased genes if male-biased genes are subject to different
replica-tional or recombinareplica-tional conditions than female- and are not limited to genes expressed in sex-specific repro-ductive tissues, but are also seen for genes expressed in non-sex-biased genes, they might be expected to differ
in patterns of codon bias. However, several observations nonreproductive tissues (Table 3), which presumably share the same tRNA pools. Furthermore, genes with argue against such an explanation. First, differences
in the above conditions would need to be irregularly somatic male-biased expression genes show significantly less codon bias than genes with germline male-biased dispersed throughout the genome, because male-,
fe-male-, and non-sex-biased genes are found dispersed expression (Table 3). This would not be expected if synonymous codon usage in male-biased genes were throughout all chromosome arms. A possible exception
is on the X chromosome, where male-biased genes are predominantly influenced by testes tRNA pools. Differences in the strength of purifying selection act-significantly underrepresented (Parisiet al. 2003;Ranz
non-sex-biased genes could also lead to differences in levels of of polymorphism. Finally, there may be a sampling bias toward genes with ana prioriexpectation of either posi-codon bias. For example, it has been proposed that the
strength of selection at synonymous sites in a gene is tive or balancing selection. When all genes showing evi-dence for selection are removed from the analysis (i.e., inversely proportional to gene length (Comeron et al.
1999). Indeed, as is predicted by this model, a negative genes giving a significant result by the test ofMcDonald
andKreitman(1991), the male-biased genes still show correlation between codon bias and CDS length has
been observed in Drosophila (PowellandMoriyama the highest average nonsynonymous/synonymous diver-gence ratio and the lowest average nonsynonymous/ 1997; Comeron et al. 1999; Duret and Mouchiroud
1999). This model, however, cannot explain the codon synonymous polymorphism ratio, although in this case the sample size drops to 7 male-biased and 9 female-bias differences among male-, female-, and non-sex-female-biased
genes seen in our survey, as the male-biased genes tend biased genes.
The negative correlation between codon bias and to be shorter than both female- and non-sex-biased
genes. Thus one would expect male-biased genes to the nonsynonymous substitution rate also could be ex-plained by Hill-Robertson interference between synon-show more codon bias, rather than less, than genes of
the other two classes. ymous and nonsynonymous mutations within a gene
(Akashi1996;BetancourtandPresgraves2002;Kim
Another possibility is that there may be general
differ-ences in selective constraint among male-, female-, and 2004). Under this scenario, the fixation of strongly fa-vored amino acid replacements in adaptively evolving non-sex-biased genes. It has been suggested that there
is a correlation between the level of constraint on synon- proteins results in the fixation of linked, slightly deleteri-ous synonymdeleteri-ous mutations. Thus, if male-biased genes ymous and nonsynonymous sites (Akashi 1994;
Com-eronandKreitman1998). This could explain the ob- were targets of positive selection more often than fe-male- or non-sex-biased genes, one would expect them servation that codon bias is negatively correlated with
both the synonymous and the nonsynonymous substitu- to show reduced levels of codon bias. Because interfer-ence is reduced in regions of higher recombination, tion rate. Since it has been shown that male-biased genes
have significantly higher rates of nonsynonymous substi- one might expect that the positive correlation between codon bias and local recombination rate would be tution than female- and non-sex-biased genes (Zhang
et al. 2004), it may be that male-biased genes are subject stronger for male-biased genes than for female- or non-sex-biased genes. However, male-biased genes show the to less purifying selection at both synonymous and
non-synonymous sites. A possible cause for this may be that, weakest correlation (seeresults). Such a pattern could be explained by a greater rate of adaptive amino acid due to their greater variance in reproductive success,
males have a smallerNethan females. Thus selection is substitution in male-biased genes in regions of higher recombination. If positively selected amino acid replace-expected to be less effective on male traits. Although
all of the genes in our survey are physically present in ments are more frequent in these regions, then there would be more opportunity for the fixation of linked, both sexes (i.e., none are Y-linked), there may be
sex-related differences in the degree of selection that they slightly deleterious synonymous mutations. This would partially counteract the relaxation of Hill-Robertson experience. For example, in the extreme case of a gene
with male-specific expression, purifying selection against interference in the regions of higher recombination described above and weaken the correlation between synonymous or nonsynonymous mutations will occur
only in males and is expected to be weaker because of codon bias and recombination rate. Support for this hypothesis comes from the observation that there is a their reduced Ne. Patterns of polymorphism in
sex-biased genes, however, argue against the above explana- positive correlation between the nonsynonymous sub-stitution rate and the local recombination rate for Acp tion. Zhang et al. (2004) analyzed population genetic
data for 55 D. melanogaster genes and found that, in genes, which are thought to undergo frequent adaptive evolution in general (Swansonet al. 2001;Betancourt
contrast to their elevated ratio of
nonsynonymous-to-synonymous divergence, male-biased genes did not and Presgraves 2002), and for male-biased genes in general (our unpublished results).
have an elevated ratio of
nonsynonymous-to-synony-mous polymorphism relative to female- and non-sex- Zhanget al. (2004) compared ratios of polymorphism and divergence at synonymous and nonsynonymous sites biased genes, as would be expected if they were evolving
under less selective constraint. However, Zhang et al. in male-, female-, and non-sex-biased genes and found evidence for increased adaptive evolution in male-biased (2004) pointed out several caveats to this interpretation.
First, it is based on a small number of sex-biased genes genes. These results also suggest that Hill-Robertson interference between strongly selected nonsynonymous (13 male biased and 12 female biased) for which both
polymorphism and divergence data were available from mutations and weakly selected synonymous mutations is more common in male-biased genes (although see the literature. Second, the data were collected by many
independent groups that employed different popula- the caveats mentioned above). In addition to an elevated rate of nonsynonymous substitution, male-biased genes tion sampling schemes. Thus, there is no control for
Akashi, H., 1995 Inferring weak selection from patterns of polymor-and divergence, at least some of which appear to be
at-phism and divergence at “silent” sites in Drosophila DNA. Genet-tributable to positive selection (Meiklejohnet al. 2003; ics139:1067–1076.
Akashi, H., 1996 Molecular evolution betweenDrosophila
melanogas-Ranzet al. 2003; Nuzhdinet al. 2004). Given that the
ter andD. simulans: reduced codon bias, faster rates of amino majority of expression differences among Drosophila
acid substitution and larger proteins inD. melanogaster.Genetics species are caused by differences incis-regulatory ele- 144:1297–1307.
Akashi, H., 2003 Translational selection and yeast proteome evolu-ments (Wittkopp et al. 2004), it is likely that positive
tion. Genetics164:1291–1303. selection on linked regulatory sequences also results in
Begun, D. J., P. Whitley, B. L. Todd, H. M. Waldrip-DailandA. G.
Hill-Robertson interference that could reduce codon Clark, 2000 Molecular population genetics of male accessory gland proteins in Drosophila. Genetics156:1879–1888. bias in male-biased genes. We wish to emphasize,
how-Bennetzen, J. L., andB. D. Hall, 1982 Codon selection in yeast. ever, that not every male-biased gene in our survey must
J. Biol. Chem.257:3026–3031.
be affected by positive selection to cause the observed Betancourt, A., andD. C. Presgraves, 2002 Linkage limits the power of natural selection in Drosophila.Proc. Natl. Acad. Sci. reduction in codon bias. We can estimate the minimum
USA99:13616–13620. number of genes that need to be affected by seeing how
Betra´n, E., and M. Long, 2003 Dntf-2r, a young Drosophila ret-many of the male-biased genes with the lowestFOPvalues roposed gene with specific male expression under positive
Dar-winian selection. Genetics164:977–988. need to be removed for the difference between
male-Carlini, D. B., andW. Stephan, 2003 In vivointroduction of unpre-and female-biased genes to become insignificant (P⬎
ferred synonymous codons into the DrosophilaAdhgene results 0.05) by the Mann-Whitney test. In this case, it is 215 in reduced levels of ADH protein. Genetics163:239–243.
Civetta, A., andR. S. Singh, 1999 Broad-sense sexual selection, genes, orⵑ17% of the male-biased genes in our survey.
sex gene pool evolution, and speciation. Genome42:1033–1041. A similar analysis indicates that a higher number (⬎500)
Coghlan, A., andK. H. Wolfe, 2000 Relationship of codon bias of the male-biased genes are responsible for the negative to mRNA concentration and protein length inSaccharomyces
cere-visiae.Yeast16:1131–1145. correlation betweenFOP and degree of male-biased
ex-Comeron, J. M., 2004 Selective and mutational patterns associated pression (Figure 1A) and suggests that up to 40% of
with gene expression in humans: influences on synonymous com-the male-biased genes may be affected by positive selec- position and intron presence. Genetics167:1293–1304.
Comeron, J. M., andM. Kreitman, 1998 The correlation between tion. It should be noted, however, that the positive
selec-synonymous and nonselec-synonymous substitutions in Drosophila: tion and relaxed constraint hypotheses are not mutually
Mutation, selection or relaxed constraints? Genetics150:767–775. exclusive. It is possible that some fraction of the male- Comeron, J. M., M. KreitmanandM. Aguade´, 1999 Natural selec-tion on synonymous sites is correlated with gene length and biased genes is subject to increased positive selection,
recombination in Drosophila. Genetics151:239–249. while another fraction experiences less selective
con-Domazet-Loso, T., andD. Tautz, 2003 An evolutionary analysis of straint. It is also possible that this latter fraction is over- orphan genes inDrosophila.Genome Res.13:2213–2219.
Duret, L., 2000 tRNA gene number and codon usage in theC.
ele-represented among highly male-biased genes. If so, the
gans genome are co-adapted for optimal translation of highly fraction of male-biased genes affected by positive
selec-expressed genes. Trends Genet.16:287–289.
tion could be much lower than the above estimates. Duret, L., andD. Mouchiroud, 1999 Expression pattern and, sur-prisingly, gene length shape codon usage inCaenorhabditis,
Dro-In this study, we have shown that male-biased genes
sophila, andArabidopsis.Proc. Natl. Acad. Sci. USA96:4482–4487. have significantly less codon bias than female- and
non-Gibson, G., R. Riley-Berger, L. Harshman, A. Kopp, S. Vachaet al., sex-biased genes on a genomic scale. We propose that 2004 Extensive sex-specific nonadditivity of gene expression in
Drosophila melanogaster.Genetics167:1791–1799. this is at least partially attributable to increased
posi-Gouy, M., andC. Gautier, 1982 Codon usage in bacteria: correla-tive selection acting on structural and/or regulatory
tion with gene expressivity. Nucleic Acids Res.10:7055–7074. changes in male-biased genes. Further studies of poly- Grantham, R., C. Gautier, M. Gouy, M. JacobzoneandR. Mercier,
1981 Codon catalog usage is a genome strategy modulated for morphism and divergence in both sequence and
expres-gene expressivity. Nucleic Acids Res.9:r43–r74. sion are needed to determine the fraction of
male-Green, P., B. Ewing, W. Miller, P. J. ThomasandE. D. Green, 2003 biased genes that are subject to positive selection and Transcription-associated mutational asymmetry in mammalian
evolution. Nat. Genet.33:514–517. the extent to which this selection influences levels of
Grosjean, H., andW. Fiers, 1982 Preferential codon usage in pro-codon bias.
karyotic genes: the optimal codon-anticodon interaction energy and the selective codon usage in efficiently expressed genes. Gene We thank H. Akashi, J. Baines, J. Hermisson, C. Meiklejohn, D.
Pres-18:199–209. graves, J. Ranz, L. Rose, W. Stephan, and N. Stoletzki for critical
read-Hey, J., andR. M. Kliman, 2002 Interactions between natural selec-ing of the manuscript. This work was supported by Deutsche
Forsch-tion, recombination and gene diversity in the genes of Drosoph-ungsgemeinschaft grant PA 903/2-1.
ila. Genetics160:595–608.
Hill, W. G., andA. Robertson, 1966 The effect of linkage on limits to artificial selection. Genet. Res.8:269–294.
Ikemura, T., 1981 Correlation between the abundance ofEscherichia
LITERATURE CITED
colitransfer RNAs and the occurrence of the respective codons in its protein genes: a proposal for a synonymous codon choice
Aguade´, M., 1998 Different forces drive the evolution of theAcp26Aa
andAcp26Abaccessory gland genes in theDrosophila melanogaster that is optimal for theE. colitranslational system. J. Mol. Biol.
151:389–409. species complex. Genetics150:1079–1089.
Aguade´, M., 1999 Positive selection drives the evolution of the Ikemura, T., 1982 Correlation between the abundance of yeast trans-fer RNAs and the occurrence of the respective codons in protein Acp29AB accessory gland protein in Drosophila. Genetics152:
543–551. genes. Differences in synonymous codon choice patterns of yeast and Escherichia coli with reference to the abundance of
isoac-Akashi, H., 1994 Synonymous codon usage inDrosophila
melanogas-ter: natural selection and translational accuracy. Genetics 136: cepting transfer RNAs. J. Mol. Biol.158:573–597.
protein sequence inDrosophila.Mol. Biol. Evol.21:1308–1317. and quantification ofBacillus subtilistRNAs: gene expression level
and species-specific diversity of codon usage based on multivariate Parisi, M., R. Nuttall, D. Naiman, G. Bouffard, J. Malleyet al., 2003 Paucity of genes on theDrosophilaX chromosome showing analysis. Gene238:143–155.
Kim, Y., 2004 Effect of strong directional selection on weakly selected male-biased expression. Science299:697–700.
Parisi, M., R. Nuttall, P. Edwards, L. Minor, D. Naimanet al., 2004 mutations at linked sites: implication for synonymous codon
usage. Mol. Biol. Evol.21:286–294. A survey of ovary-, testis-, and soma-biased gene expression in
Drosophila melanogasteradults. Genome Biol.5:R40.
Kimura, M., 1968 Genetic variability maintained in a finite
popula-Parsch, J., C. D. MeiklejohnandD. L. Hartl, 2001 Patterns of tion due to mutational production of neutral and nearly neutral
DNA sequence variation suggest the recent action of positive isoalleles. Genet. Res.11:247–269.
selection in thejanus-ocnusregion ofDrosophila simulans.Genetics
Kimura, M., 1977 Preponderance of synonymous changes as
evi-159:647–657. dence for the neutral theory of molecular evolution. Nature267:
Powell, J., andE. N. Moriyama, 1997 Evolution of codon bias in 275–276.
Drosophila.Proc. Natl. Acad. Sci. USA94:7784–7790.
Kliman, R. M., andJ. Hey, 1993 Reduced natural selection
associ-Ranz, J. M., C. I. Castillo-Davis, C. D. MeiklejohnandD. L. Hartl, ated with low recombination inDrosophila melanogaster.Mol. Biol.
2003 Sex-dependent gene expression and evolution of the
Dro-Evol.10:1239–1258.
sophilatranscriptome. Science300:1742–1745.
Kliman, R. M., andJ. Hey, 1994 The effects of mutation and natural
Singh, R. S., andR. J. Kulathinal, 2000 Sex gene pool evolution selection on codon bias in the genes of Drosophila. Genetics137:
and speciation: a new paradigm. Genes Genet. Syst.75:119–130. 1049–1056.
Swanson, W. J., andV. D. Vacquier, 2002 The rapid evolution of
Kliman, R. M., andJ. Hey, 2003 Hill-Robertson interference in
reproductive proteins. Nat. Rev. Genet.3:137–144.
Drosophila melanogaster: reply to Marais, Mouchiroud and Duret.
Swanson, W. J., A. G. Clark, H. M. Waldrip-Dail, M. F. Wolfner
Genet. Res.81:89–90.
andC. F. Aquadro, 2001 Evolutionary EST analysis identifies
Marais, G., D. MouchiroudandL. Duret, 2001 Does
recombina-rapidly evolving male reproductive proteins inDrosophila.Proc. tion improve selection on codon usage? Lessons from nematode
Natl. Acad. Sci. USA98:7375–7379. and fly complete genomes. Proc. Natl. Acad. Sci. USA98:5688–5692.
Ting, C. T., S. C. Tsaur, M. L. WuandC.-I Wu, 1998 A rapidly
Marais, G., D. MouchiroudandL. Duret, 2003 Neutral effect of
evolving homeobox at the site of a hybrid sterility gene. Science recombination on base composition in Drosophila.Genet. Res.
282:1501–1504.
81:79–87.
Tsaur, S. C., andC.-I Wu, 1997 Positive selection and the molecular
McDonald, J. H., andM. Kreitman, 1991 Adaptive protein evolu- evolution of a gene of male reproduction,
Acp26AaofDrosophila.
tion at theAdhlocus inDrosophila.Nature351:652–654.
Mol. Biol. Evol.14:544–549.
McVean, G. A., andJ. Vieira, 2001 Inferring parameters of muta- Tsaur, S. C., C. T. TingandC.-I Wu, 1998 Positive selection driving tion, selection and demography from patterns of synonymous the evolution of a gene of male reproduction,Acp26Aa, of Dro-site evolution in Drosophila. Genetics157:245–257. sophila: II. Divergence versus polymorphism. Mol. Biol. Evol.15:
Meiklejohn, C. D., J. Parsch, J. M. RanzandD. L. Hartl, 2003 1040–1046.
Rapid evolution of male-biased gene expression in Drosophila. Wittkopp, P. J., B. K. HaerumandA. G. Clark, 2004 Evolutionary
Proc. Natl. Acad. Sci. USA100:9894–9899. changes incisandtransgene regulation. Nature430:85–88.
Moriyama, E. N., andJ. R. Powell, 1997 Codon usage bias and Wright, F., 1990 The ‘effective number of codons’ used in a gene. tRNA abundance inDrosophila.J. Mol. Evol.45:514–523. Gene87:23–29.
Nurminsky, D. I., M. V. Nurminskaya, D. De Aguiar andD. L. Zhang, Z., T. M. HambuchandJ. Parsch, 2004 Molecular evolution Hartl, 1998 Selective sweep of a newly evolved sperm-specific of sex-biased genes inDrosophila.Mol. Biol. Evol.21:2130–2139. gene inDrosophila.Nature396:572–575.