Team Performance Measurement in Pediatric Resuscitation: Validation Study of a Checklist Tool
By Eric Scott Golike
A Master’s Paper submitted to the faculty of the University of North Carolina at Chapel Hill in
partial fulfillment of the requirements for the degree of Masters of Public Health
in the Public Health Leadership Program
Chapel Hill 2013
__________________________________ Advisor:
__________________________________ Date
__________________________________ Second Reader:
i
Abstract
Background: Poor in-hospital survival of patients receiving pediatric cardiopulmonary resuscitation suggests potential for substantial quality improvement. Achieving best outcomes in pediatric resuscitation require a complex set of team skills, but proficiency in these team skills is difficult for residents to
develop and practicing physicians to maintain. The next step for improvement in pediatric resuscitation survival will likely come from a greater understanding of team effectiveness generated through
performance and outcome measurements. This requires valid and reliable performance assessment tools tailored explicitly to the activities associated with pediatric resuscitation. Objective: To assess the validity and retest the reliability of a pediatric resuscitation performance assessment tool. Methods: We used inter-rater comparisons of overall checklist scores and procedure time points resulting from six team exercises performed by teams at three levels of experience. The teamswere evaluated performing
ii
Acknowledgments
I would like to thank my advisor, Dr. Tolleson-Rinehart both for her expert guidance and push to complete the master’s paper. I would not have been able to finish without her encouragement.
I would like to thank my second reader, Dr. William Mills and our co-investigator Dr. Jessica Katznelson. This paper is built upon their foundation of work and instrument development. Their original vision and assistance with the validation study made the paper possible. I only hope this makes some contribution towards their important research in pediatric resuscitation training.
I appreciate the contributions of Jim Barrick, Dr. Benny Joyner, and the Johns Hopkins SimLab staff for the efficient coordination of the simulation scenarios. I also thank the PEM attendings, residents, and medical student for taking the time to complete the scenarios as participants.
iii
Table of Contents
Abstract ... i
Acknowledgments ... ii
Table of Contents ... iii
Introduction ... 1
Theoretical Perspective: Team Training and Measurement ... 1
Methods ... 5
Instrument ... 5
Teams ... 5
Scenarios ... 6
Performance Sessions ... 6
Data Collection ... 7
Statistical Analysis ... 7
Results ... 8
Characteristics ... 8
Construct Validity ... 9
Inter-rater reliability ... 10
Discussion ... 10
Limitations ... 12
Conclusion ... 13
References ... 14
Tables and Figures ... 16
Appendix A: Systematic Review of Team Pediatric Resuscitation Evaluation Instruments ... A1 Introduction ... A1 Methods ... A1 Search Strategy ... A1 Study Selection ... A1 Results ... A2 Overview ... A2 Simulation Team Assessment Tool (STAT) ... A3 Clinical Performance Tool (CPT) ... A3 Team Performance during Simulated Crisis Instrument (TPDSCI) ... A4 Team Emergency Assessment Measure (TEAM) ... A4 CARDIOTEAM Checklist ... A5 Trauma Team Evaluation Tool ... A5 Comparison ... A6 Conclusion ... A7 References ... A8 Review Tables and Figures ... A9
Introduction
Pediatric cardiopulmonary resuscitation is one of the more complex and skill intensive medical situations. Successful efforts at pediatric resuscitation require a coordinated group of medical providers with effective procedural skills, resuscitation specific knowledge, complex situational awareness, and teamwork (Hunt et al. 2008). This combination of skills can only be mastered and retained through regular practice (Gaies et al. 2007; Wolfram et al. 2003). Since pediatric codes are a relatively rare occurrence, simulation provides an important step in skill development. More recently, recognition of the importance of teamwork skills has led to whole team training (Weaver et al. 2010). This combination of simulation and team training can help reduce medical errors during complex team activities. However, the translation of team training, assessment, and feedback into improved patient outcomes requires rigorous performance assessment Weinberg, Auerbach, and Shah 2009). Team performance in pediatric
resuscitation has seldom been assessed with validated instruments. We developed one such instrument and conducted this study to evaluate the checklist’s validity and reliability.
Theoretical Perspective: Team Training and Measurement
The Institute of Medicine (IOM) publication “To Err is Human” in 1998 brought new focus to the quantity and causes of medical errors. The IOM concluded that medical errors caused between 44,000 and 98,000 deaths annually in the U.S. (Kohn, Corrigan, and Donaldson 2000), a level of preventable harm and system error not previous imagined by the public or health care community. One of the largest sources of these preventable errors is breakdown in communication. A review of sentinel events by the Joint Commission on Accreditation of Healthcare Organizations (JCAHO) between 1995 and 2006 found that 70% involved poor communication as a cause (Weaver et al. 2013, 3). The Joint Commission, IOM, and other public and private entities have endorsed teamwork as a key strategy for addressing these medical errors. In the fifteen years since To Err is Human was published, the field of teamwork in
2
Team based training has the potential to achieve substantial improvements in medical staff performance, patient outcomes, and reduction of costly errors. Yet, the field of teamwork requires further development in the assessment of team performance and team effectiveness before this potential can be achieved.As with other areas of research, team training has its own terminology. A team is two or more individuals working interdependently to achieve a shared goal. Team performance is the achievement of shared goals through a dynamic sum of both teamwork and taskwork. Teamwork refers to the process of collaborative and cooperative actions between team members, while taskwork refers to clinical
competency achievable by an individual. Beyond the scope of team performance, team effectiveness is a judgment about the outcomes that result from completion of team goals (Rosen et al. 2013, 60).
For a complex, low error tolerance industry, medicine was late to embrace team based approaches (Wilson et al. 2005). Team training first appeared in commercial aviation and in the military. Since its adoption in health care, teamwork has progressed through several models. The first approach to teamwork training in medicine was based on Crew Resource Management (CRM) developed in aviation. CRM focuses primarily on building situational awareness and effective communication skills (Thomas 2011). CRM strategies were originally implemented as training strategies in emergency medicine as
“MedTeams,” in the US Air Force as “Medical Team Management,” and in Labor and Delivery units. Outcome measures show CRM is a good basis for developing team skills but not a complete tool for teaching teamwork (Alonso and Dunleavy 2013).
3
draw on the existing evidence for team competencies in other disciplines to define critical aspects shown to improve team performance. One such program, TeamSTEPPS, is based on the critical competencies of leadership, situation monitoring, backup behavior and communication (Sheppard, Williams, and Klein 2013).The evidence of improvements in teamwork competencies and team performance continues to grow, but the effectiveness research of team training on patient outcomes is relatively limited (Driskell et al. 2013, 201). This is partly due both to the complexity of measuring patient outcomes and attributing them to teamwork, and the lack of specific team training. The composition and goals of teams
encountered in medicine is astoundingly diverse (Andreatta 2010). Current generic team approaches such as TeamSTEPPS can provide a foundation for team behaviors, but still do not fully address the problem of medical errors. A recent analysis of data from 2010, 2011, and 2012 showed poor communication was an attributable cause in 66% of medical error sentinel events (JACHO 2013), a very slight reduction in decade-old levels (Weaver et al. 2013). As seen with the dramatic improvement teamwork training has accomplished in aviation and business (Driskell et al. 2013), teamwork training has potential to address these complex error issues, but will require greater understanding of teamwork variables particular to health care and specialized to the diverse health care team types. This development will require measures of team specific performance and effectiveness (Baker and Gallo 2013).
Measurement is a systematic process of assigning value to tested performance for interpretation outside the test. This is accomplished through the use of a testing metric called an instrument or tool. Measurement has the potential to improve team training through both effective team feedback and better systemic understanding of how to implement team training (Baker and Gallo 2013). There have been two methods of team performance measurement: self-report and observation. Measurement by self-report asks participants to evaluate their own achievement of teamwork competencies. This may effectively gauge team attitudes but has problematic bias as an indicator of individual skills and overall performance (Rosen et al. 2013, 72). Observation measurement requires one or multiple evaluators to view
4
to rate performance based on three different scale forms: global rating, behaviorally anchored, or event-based. Global rating scales rely on expert evaluation of whole overall performance. Behavior based scales, called competency based in a review of the literature (see Appendix A), require an evaluator to score distinct competencies such as leadership, communication, or systems-based care. Event-based rating requires an observer to assess well defined events typically in a checklist form (Rosen et al. 2013, 73-74). These formats may evaluate teamwork competencies, procedural taskwork, or both. Baker and Gallo (2013, 235) argue the best understanding of effectiveness comes through assessment of overall team performance encompassing both teamwork and taskwork, thus the best instrument format should be specific to the intended team, its job, and a clear interpretation of its results.Effective format tests must also be reliable and valid. Reliability refers to the consistency of the instrument results. For observer evaluations, inter-rater reliability (IRR) assesses the consistency between independent evaluators of a performance (Linn and Gronlund 2000, 107-118). Validity is an evaluation of the evidence supporting adequate and appropriate interpretation of instrument results. Test validity is considered a unified concept, but thorough validity measurement requires attention to each of the underlying domains of validity (Messick 1995). Content validity addresses how well the instrument covers a representative sample of intended material while construct validity speaks to the extent to which the tool measures the desired content. Concurrent validity predicts the performance on another well validated measurement. Consequential validity evaluates how well instrument results are a predictor of real team outcomes (Baker and Gallo 236-237; Messick 1995). Establishing validity requires qualitative assessment of content scope and competency basis along with quantitative evidence demonstrating an acceptable degree of construct, concurrent, and consequential validity (Messick 1995).
5
and establish standards for validation of team instruments. These steps are critical to develop the next generation of team training with evidence-based improvements in patient outcomes. Second, these steps allow targeting team training toward the areas with maximum potential for improvements. Only with the refinement of performance measurement will health care be able to use team training to improve patient outcomes and reduce costly errors to the extent the IOM first envisioned.Methods
Instrument
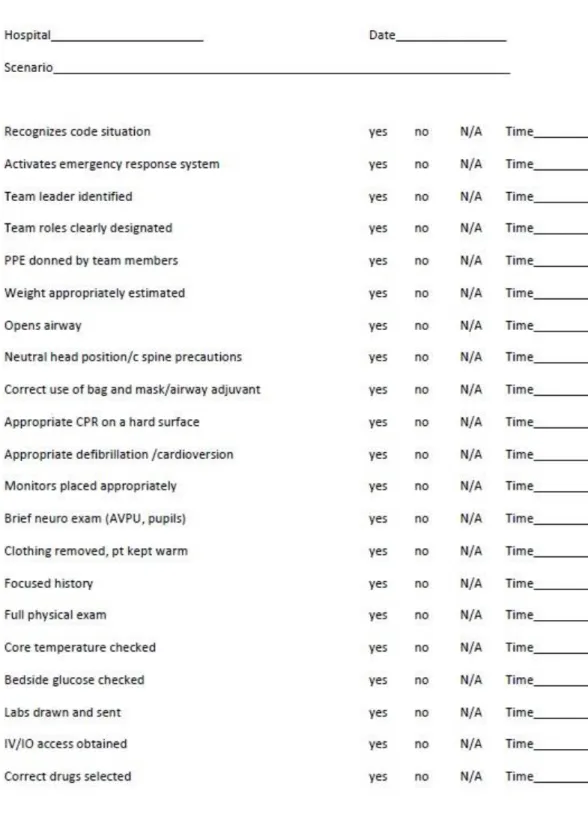
Experts in pediatric emergency medicine from the University of North Carolina at Chapel Hill (UNC) and the Johns Hopkins University (JHU) created a checklist format instrument for evaluating pediatric resuscitation scenarios. The content was developed from the pediatric advanced life support (PALS) competencies with input from critical care, emergency medicine and pediatric experts. Field tests prompted certain amendments and led to a 35 item, dichotomous (yes-no) checklist with item time recording (Katznelson and Mills 2012). A previous study of the checklist inter-rater reliability evaluated multi-discipline teams in pediatric resuscitation and found an overall kappa of 0.65 (Katznelson and Mills 2012). This checklist has substantial potential but requires validation before results are useful. Our goal is to assess the checklist validity by comparing the performance of three different experience levels over multiple pediatric resuscitation scenarios.
Teams
6
simulation training. Participants were late 3rd year medical students on their pediatric clerkship, pediatric residents with one to two months left in their first year, or practicing PEM physicians at one of the academic medical centers. The PEM participants had between 1 and 17 years of experience in pediatric emergency medicine since completion of their fellowship. Six total teams, 2 at each experience level, were recruited for the study.Scenarios
The trial used three separate simulation scenarios covering pediatric crisis situations in (1) cold water drowning, (2) carbon monoxide poisoning presenting with seizures, and (3) progressing septic shock. The scenarios were created for a high-fidelity mannequin by one of the study investigators who is a teaching professor of pediatric emergency medicine. These three scenarios were designed to cover a broad range of procedural, diagnostic, and patient management challenges encountered in pediatric resuscitation. All of the scenarios were piloted both by study investigators and by a Pediatric Emergency Medicine physician with significant simulation expertise who is not part of the study team. In addition, all three have successfully been used in team resuscitation training sessions in multiple settings. Expected time for team completion of these scenarios ranges from 5-20 minutes depending on team speed and performance.
Performance Sessions
7
circulating nurse was standard in each scenario. The nurse would assist the team to locate supplies, prepare procedure equipment, and draw up medicine only as directed by team members without direct interaction in procedures. Participants were required to perform their desired procedures directly on the mannequin. Patient feedback was provided primarily through the simulator and monitor. The instructor gave initial presenting patient information and only upon team request or diagnostic performance, provided detailed family history, physical exam signs, and laboratory information. The evaluator had no interaction with the team during the scenario. Each team completed the three successive scenarios with a short break between each to reset the simulation. The individual scenarios took between 6 and 15 minutes.Data Collection
Data were collected by two evaluators. One evaluator was present in the room with the team and completed the checklist in real time as the team performed. The sessions were video recorded from two angles, allowing a second evaluator to independently score the same scenarios at a later time. Overall score is defined by the number of ‘yes’ checks on the checklist used by each evaluator. The maximum checklist score is 35; however, some of the scenarios may not require the completion of all items. The checklist prompts evaluators to record time points for each completed item. The author of this master’s paper determined four key item time points based on their necessity for patient care and time-dependent effect on patient outcome. Key procedure time points were defined as start time to (1) initiate appropriate ventilation, (2) attach cardiac monitors, (3) establish venous or interosseous access, and (4) give first appropriate medication. This author tabulated overall team scores and time points from scored checklists.
Statistical Analysis
8
performed all calculations with Stata12 (StataCorp, College Station, TX). Prior to data collection, we defined p ≤ 0.05 as significant.Construct validity refers to how well the interpretation of results are a true reflection of the actual skills assessed by the test. We choose experience level as a proxy for better team performance in pediatric resuscitation. We treat each scenario performance as an independent event for the team experience level. As such there are 18 independent scores, 6 for each experience level. Score data came from the in-room evaluator only. One-way analysis of variance (ANOVA) was used to compare overall performance among all levels; t-testes compared difference between paired groups.
Key time points came primarily from the in-room evaluator with gaps filled by the second evaluator. Time data points were absent for teams failing to adequately complete a key item. This author judged the existing time data to have a non-normal distribution, which is consistent with other team performance instruments’ non-parametric analysis (Holcomb et al. 2002). To account for the missing data points and the non-normal time distribution, comparison of completion speed with experience level was performed based on rank. If a team did not complete one of the key time point procedures, it was assigned the highest rank value. Kruskal-Wallis ANOVA was used to test significance of time ranks for all
experience levels. Wilcoxon rank-sum directly compared completion rank between groups.
Inter-rater reliability (IRR) assesses the correlation between independent raters scoring same performance. This checklist has already shown good inter-rater reliability testing multidisciplinary emergency medical teams. We reconfirm this IRR using Cohen’s kappa to assess five of our team performances.
Results
Characteristics
9
participants completed the survey. Table 1 demonstrates the survey results reported as a fraction of experience level respondents. The survey shows an expected higher level of resuscitation training and skill self-appraisal by the PEM participants. The three groups had similar levels of exposure to and resuscitation training with a human patient simulator (as opposed to actual clinical experience). Third year medical students and first year pediatric residents were closer to one another in their level of training. The medical students actually self-assessed greater comfort participating in simulation than did the residents.Table 1. Participant resuscitation background survey by experience group about here
Construct Validity
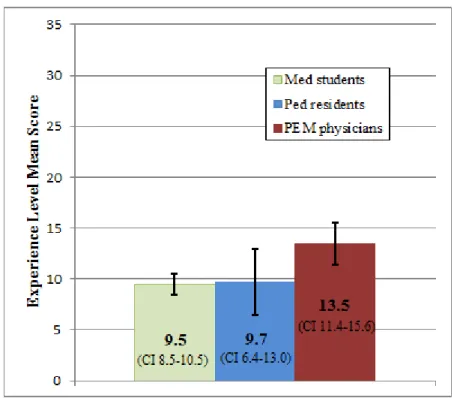
The team performance scores ranged from 5 to 16 by the first evaluator. Individual team score by scenario is seen in figure 1. The mean and confidence interval among all experience levels was computed as seen in Figure 2.
Figure 1. Individual scenario team overall scores about here
Figure 2. Means and confidence intervals of experience level scores about here
ANOVA demonstrated a significant overall difference between groups (p < 0.014). A paired comparison showed a significant difference in scores between the PEM physicians and medical students (p<0.009) and between PEM physicians and pediatric residents (p<0.012), but average medical student and resident team scores were essentially similar (p <0.90). All paired mean differences and probabilities are reported in Table 2. These differences were to be expected, and indicate the checklist can discriminate by experience level.
Table 2. Mean score difference and t-test significance between groups about here
Mean comparison of the four key time points show a trend for shorter times with an increase in experience level, as seen in Table 3. However, comparing times by rank analysis could only show
10
versus students also showed a definitive difference in initial ventilation (p<0.078) and a near-significant difference in giving first medication (p<0.055).Table 3. Mean time from start till key procedure by experience group about here
Table 4. Significance of key time point differences by Wilcoxon rank-sum about here
Inter-rater reliability
The five representative scenarios completed by two evaluators were compared by Cohen’s kappa for inter-rater reliability. Comparison of the two rater checklists for the scenarios individually produced a kappa range from 0.59 – 0.88. The overall kappa is 0.68 with 95% confidence interval 0.60 – 0.75.
Discussion
The literature does not agree on a single process for team instrument validation, but our trial conforms to those currently used in the literature (see Appendix A). The design of the PEM, resident, and medical student teams was to provide three discrete levels of performance. The sample of 6 teams was determined by convenience, not a statistical estimation of power. Hence, as expected, this study provides evidence for construct validity more through the established trends than through finding statistical significance in the differences.
11
Studies show the least experienced individuals tend to have the greatest over-evaluation of theirperformance (Kruger and Dunning 1999).
The overall team performance scores by scenario presented in Figure 1 show greater
consolidation in the cold water drowning scenario. This was the first of the three scenarios for each team. These teams had never worked together as a unit. Acclimation to the simulation environment and new team group may have hindered potential performance and led to the clustered results.
The overall performance score was the most variable for the pediatric resident teams. All of the groups rotated team leader by scenario. The residents recruited for this study came from diverse medical school backgrounds with different team competencies in the curriculum. Greater leadership from some pediatric residents may account for performance variation. Additionally there may have been a skill gap between the resident groups at each university. The variability of resident scores generates a large standard error, which prevents differentiation between the resident and medical student performance.
Unlike that of the pediatric residents, the medical student team performance was very consistent, ranging from 8 – 11 in overall score. This consistency may come from a narrow and effective focus on their limited set of clinical skills and knowledge. The PEM physicians did consistently score better than the other groups. Despite the small sample size, the mean difference was significant between the PEM physicians and the two trainee groups. These data demonstrate the checklist’s ability to differentiate between the PEM experts and non-expert resident and student teams.
12
The inter-rater reliability assessed here by Cohen’s kappa of 0.68 would be considered substantial agreement in Landis and Koch’s (1977) commonly cited scale. This IRR matches a previous checklist assessment and confirms that the scoring reliability of our physician/medical student teams is comparable to the multi-disciplinary teams.Limitations
The sample size was a major limiting factor in this assessment both for study design and statistical conclusions. Working with a small sample size requires limiting the potential influence of unpredictable variables such as participant backgrounds. We chose to use homogenous teams of all physicians/medical students instead of multi-discipline medical teams to limit this influence. We also used a survey to confirm participant background consistent with expectations. Even with controlling for background, the confidence interval for both mean scores and completion speed was too large to
differentiate between medical students and residents. Another validation method, which limits bias from individual participants, is to retest the same team before and after specific pediatric resuscitation training. This approach was used by Holcomb et al. (2002) and Donoghue et al. (2011) and presents a potential next step for additional construct validation evidence.
13
Conclusion
This study establishes solid construct validity differentiating expert from non-expert medical teams and reconfirms good inter-rater reliability. The checklist score analysis did not show substantial difference between the medical student and first year pediatric resident teams. Across all three team levels, the more experienced teams show a trend for faster completion of key procedures. In the future a larger sample size, comparison with other standardized instruments, and translation of results into patient outcomes may provide greater evidence for checklist validation; however, this study employs methods and analysis consistent with the best medical team instrument validation studies. The statistically
14
References
Alonso, Alexander, and Dana M. Dunleavy. 2013. “Building Teamwork Skills in Healthcare: the case for communication and coordination competencies.” In Improving Patient Safety Through Teamwork and Team Training, edited by Eduardo Salas and Karen Frush, 41-58. New York, NY: Oxford University Press.
Andreatta, Pamela B. 2010. “A typology for health care teams.” Healthcare Management Review 35(3): 345-354.
Baker, David P., and Jonathan Gallo. 2013. “Measuring and Diagnosing Team Performance.” In Improving Patient Safety Through Teamwork and Team Training, edited by Eduardo Salas and Karen Frush, 234-238.
Wilson, K.A., et al. 2005. “Promoting health care safety through training high reliability teams.” Quality and Safety in Health Care 14: 303-309.
Donoghue, Aaron, et al. 2011. “Design, Implementation, and Psychometric Analysis of a Scoring Instrument for Simulated Pediatric Resuscitation: A Report from the EXPRESS Pediatric Investigators.” Simulation in Healthcare 6: 71-77.
Driskell, Tripp, et al. 2013. “Does Team Training Work? Where is the Evidence?” In Improving Patient Safety Through Teamwork and Team Training, edited by Eduardo Salas and Karen Frush, 201-217.
Gaies, Michael G., et al. 2007. “Assessing Procedural Skills Training in Pediatric Residency Programs.” Pediatrics 120 (4): 715-722.
Holcomb, John B., et al. 2002. “Evaluation of Trauma Team Performance Using an Advanced Human Patient Simulator for Resuscitation Training.” J of Trauma: Injury, Infection, and Critical Care 52: 1078-1086.
Hunt, Elizabeth A., et al. 2008. “Simulation of In-Hospital pediatric Medical Emergencies and
Cardiopulmonary Arrests: Highlighting the Importance of the first 5 Minutes.” Pediatrics 121(1): e34-e43.
Joint Commission (JCAHO). 2013. “Sentinel Event Data: Root Causes by Event Type.” The Joint Commission, February 7.
http://www.jointcommission.org/assets/1/18/Root_Causes_Event_Type_04_4Q2012.pdf
Katznelson, Jessica, and William Mills. 2012. “Project CAPE.” Unpublished data.
Kohn, Linda T., Janet M. Corrigan, and Molla S. Donaldson. 2000. To Err is Human: Building a Safer Health System. Washington, DC: National Academy Press.
15
Landis, Richard J., and Gary G. Koch. 1977. “The Measurement of Observer Agreement for CategoricalData.” Biometrics 33: 159-174.
Linn, Robert L., Norman E. Gronlund. 2000. Measurement and Assessment in Teaching. 8th ed. Upper Saddle River, NJ: Prentice-Hall: 73-136.
Messick, Samuel. 1995. “Standards of Validity and the Validity of Standards in Performance Assessment.” Education Measurement 14(4): 5-8.
Rosen, Michael A., et al 2013. “How Can Team Performance Be Measured, Assessed, and Diagnosed.” In Improving Patient Safety Through Teamwork and Team Training, edited by Eduardo Salas and Karen Frush, 59-77. New York, NY: Oxford University Press.
Sheppard, Faye, Marcie Williams, and Victor R. Klein. 2013. “TeamSTEPPS and patient safety in healthcare.” Journal of Healthcare Risk Management 32(3): 5-10.
Thomas, Eric J. 2011. Improving teamwork in healthcare: current approaches and the path forward. British Medical Journal of Quality and Safety 20: 647-650.
Weaver, Sallie J., et al. 2010. “The Anatomy of Health Care Team Training and the State of Practice: A Critical Review.” Academic Medicine 85 (11): 1746-1760.
Weaver, Sallie J., et al. 2013. “The Theoretical Drivers and Models of Team Performance and Effectiveness for Patient Safety.” In Improving Patient Safety Through Teamwork and Team Training, edited by Eduardo Salas and Karen Frush, 3-26. New York, NY: Oxford University Press.
Weinberg, Eric R., Marc A. Auerbach, and Nikhil B. Shah. 2009. “The use of simulation for pediatric training and assessment.” Current Opinion in Pediatrics 21: 282-287.
16
Tables and Figures
Table 1. Participant resuscitation background survey by experience group
Figure 1. Individual scenario team overall scores
PEM Physicians Pediatric Residents Medical Students
Completed PALS training 6/6 4/4 0/6
Completed ACLS training 6/6 2/4 3/6
Self assessment of previous resuscitation training
Adequate 6/6 0/4 0/6
Neutral 0/6 2/4 2/6
Uncomfortable 0/6 2/4 4/6
Previous training sessions with a human patient simulator
≥ 5 5/6 4/4 4/6
3-4 0/6 0/4 1/6
≤ 2 1/6 0/4 1/6
Participation in team mock code simulation last 3 years 5/6 3/4 4/6 Participation in real pediatric code situation last 3 years 6/6 2/4 0/6 Current comfort level participating in pedaiatric code situation
Comfortable with active team role and as team leader 6/6 0/4 0/6
Comfortable with active team role only 0/6 0/4 3/6
Uncomfortable 0/6 4/4 3/6
17
Figure 2. Mean and confidence intervals of experience level scores
Table 2. Mean score difference and t-test significance between groups
Table 3. Mean time from start till key procedure by experience group
Establish
ventiation [min]
Apply cardiac
monitors [min]
IV/IO
access [min]
First medication
[min]
Med Students
5.2
1.8
4.6
6.3
Ped Residents
3.8
1.4
2.0
4.1
18
Table 4. Significance of key time point differences by Wilcoxon rank-sum
Medical Students vs Pediatric Residents vs PEM Physicians vs
p > |t| p > |t| p > |t|
Medical Students Ventilation X 0.335 0.078
Monitors X 1.000 0.630
IV/IO access X 0.149 0.020
First medication X 0.631 0.055
Pediatric Residents Ventilation 0.335 X 0.631
Monitors 1.000 X 0.423
IV/IO access 0.149 X 0.127
First medication 0.631 X 0.109
PEM Physicans Ventilation 0.078 0.631 X
Monitors 0.630 0.423 X
IV/IO access 0.020 0.127 X
A1
Appendix A: Systematic Review of Team Pediatric Resuscitation
Evaluation Instruments
Introduction
There are currently no guidelines specifying the best methods for validating team performance instruments. I have conducted this systematic review of the current literature to gain an understanding of the existing measurement instruments for team overall performance in pediatric resuscitation and the methods for their validation.
Methods
Search Strategy
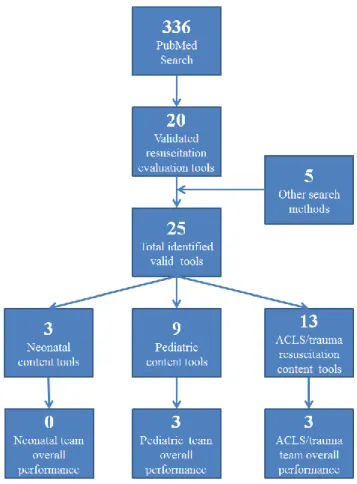
I conducted a systematic literature search using specific eligibility to find all published and validated instruments for overall team performance in pediatric resuscitation. The search was not initially limited to pediatric specific instruments with the expectation that non-specific trauma resuscitation tools may be applicable to pediatric cases. Criteria for search required PubMed accessible, English language articles detailing an instrument able to evaluate a resuscitation scenario performed with a high-fidelity simulation scenario. The search had no time limitations. Several combinations of terms were tried with the best results from a combination of resuscitation, assessment or evaluation, and simulation. A PubMed search with this key word combination resulted in 336 articles. Additional key word searches in EBSCO, article citation reviews, and journal specific searches in Resuscitation and Simulation in Healthcare were conducted to identify missed articles.
Study Selection
A2
instruments to separate to separate evaluation of individual participant versus team performance and separate the construct focus between neonatal, pediatric, and adult trauma resuscitation. The final selection required specific criteria for (1) assessment of a team group, (2) assessment of overall performance, and (3) demonstration of validity. The instruments “OSCAR” (Walker et al. 2011), “IPETT” (Lambden et al. 2013), and “TRACS” (Brett-Fleeger et al 2008) were conducted in team settings but only evaluated individual performance. Overall performance was defined as instrument results intended to provide a translation into patient outcomes. A combination of teamwork and taskwork is the preferred method of evaluating team performance, but was not an exclusion criteria. Several excluded instruments measured the level of teamwork skills without a translation into team effectiveness. Finally, the studies must present reasoning for instrument validity. Six publications met all of these criteria and were included in the analysis as seen in Figure A-1.Figure A-1. Literature search and selection process about here
Results
Overview
The six publications are relatively recent with the oldest published in 2002. Three of these instruments were developed specifically for pediatric resuscitation while the others cover emergency medical resuscitation, adult cardiac arrest, and trauma resuscitation. They encompass both task-entry and competency-centered formats with various point assignment scales and rubrics. The content of each article has a different weight for teamwork factors as a part of the overall score. Cooper et al. (2010) puts the most weight on teamwork, while Calhoun et al. (2011) and Andersen et al. (2010) only score technical task completion. There is no standard validation method between these studies, but the inter-rater
reliability is consistently reported in five of the studies. A comparison of the six instruments is presented in Table A-1.
A3
Simulation Team Assessment Tool (STAT)
Reid et al. (2012) developed the Simulation Team Assessment Tool (STAT) specifically for pediatric resuscitation based on pediatric advanced life support (PALS) curriculum and other published individual checklists. The format is a 94 item checklist judging both taskwork and teamwork factors. Each item is awarded 0, 1, or 2 points. A construct validation attempt was conducted by differentiating performance between two novice teams of 3 pediatric medicine residents with two teams of 3 pediatric emergency medicine physicians (PEM) and critical care fellows. Each team completed a single pediatric septic shock scenario on a high-fidelity pediatric simulator. The overall mean score difference between expert and resident teams was found significant by analysis of variance (ANOVA). The inter-rater reliability was calculated by six raters scoring those same 4 performances and reported by intraclass correlation coefficient (ICC) as 0.81.
The STAT checklist is likely the most comprehensive of the instruments reviewed. It assesses basic and advanced technical skill domains and the teamwork areas of leadership and team management. The use of training level as a proxy for expected improved performance is a good indicator for validation. While numerically significant, the small sample size used and no provision for potential confounding variables may somewhat limit the construct validity argument. The inter-rater reliability was strong but would be more credible with a larger sample size.
Clinical Performance Tool (CPT)
A4
with a Wilcoxon rank sum. Seven raters scored all 16 performances to demonstrate overall rater reliability by ICC at 0.63. The base individual performance checklist for CPT has already shown evidence for validity (Donoghue et al. 2010). This suggests corresponding content validity for CPT. The construct validation approach based on repeat performance is a sound method for improving construct validity; however, the study used a small number of heterogeneous teams performing the same scenario with a twenty minute debrief as the only intervention. This validation set-up provides some evidence of an effective debrief session, but offers little support for a robust instrument able to evaluate team performance. The reliability was also poor for a widely used instrument.Team Performance during Simulated Crisis Instrument (TPDSCI)
Based on PALS and existing literature for pediatric resuscitation, TPDSCI developed by Calhoun et al. (2011) approached the assessment process as a competency-centered instrument. The instrument requires three raters to evaluate five major competencies with 1 to 5 points based on a defined rubric. Three of these competencies focus on taskwork and two on teamwork performance domains. Calhoun et al. (2011) did not conduct a formal construct validation trial. The authors argue for construct validity based on the heterogeneous team scores. Forty-four different multi-discipline teams (residents, nurses, respiratory therapists, and pharmacists) were evaluated by three raters to calculate the IRR of 0.82.
TPDSCI has attempted to simplify the PALS goals into five key competencies. This likely provides a better representation of the overall PALS material than task-entry checklists, but may be more susceptible to variation between raters. The study found good IRR by a well powered investigation. The argument for construct validity based on a broad range of overall scores offers near no evidence for validation.
Team Emergency Assessment Measure (TEAM)
A5
assessing overall performance. Cooper et al. report good results from a preliminary investigation of construct validity through a principle factor analysis of 56 video-recorded resuscitation performances. Two expert scoring of six video-performances resulted in an IRR of 0.55. Concurrent validity was claimed to be significant by assessing the correlation between overall checklist score and a ten point “global rating” of team performance conducted by the same two raters.The TEAMS tool values teamwork more than the team technical performance and seems to be a poor representation for the full scope of pediatric resuscitation competencies. The mathematical
validation assessment based on single factor analysis is only a preliminary attempt. Further construct validity evidence would require an actual validity trial as Cooper et al. acknowledge. The overall inter-rater inter-rater reliability is low for an evaluation tool. Additionally, the concurrent validation was an inappropriate claim. The global rating compared in this study is not a validated measure and cannot demonstrate instrument validity.
CARDIOTEAM Checklist
Andersen et al. (2010) compress both teamwork factors and ACLS competencies into a brief 22 item dichotomous (yes/no) checklist. The taskwork centered items address skills in cardiac arrest, circulation, and technology/procedure domains. Eight trained raters used the checklist to assess 9 pre-recorded cardiac arrest resuscitations. The overall inter-rater reliability was 0.9. From these assessments Andersen et al. claim a concurrent validity by comparing rater scores to reference values determined by three expert raters. This may help show reliability, but is not a measurement concurrent validity. The ACLS design, brevity, and lack of validation evidence limit use of this checklist.
Trauma Team Evaluation Tool
A6
and skill level difference. Ten multi-disciplinary teams (physicians, nurses, medics) and 5 expert teams (experienced trauma surgeons and nurses) participating in a 28-day trauma training experience were scored initially and on completion of the course. Teams showed statistically significant improvement from initial to final assessment in four out of five skill areas and six out of eight timed tasks. The 5 expert teams scored statistically better than non-expert teams in all skill areas and timed tasks for initialperformance, but the difference was not significant between final performances. This study did not assess inter-rater reliability.
Trauma Team Evaluation Tool is a very comprehensive assessment of trauma and ACLS skills, however, it may not be fully adaptable to pediatric resuscitation situations. The construct validation method was the most comprehensive out of the six reviewed. However, the study does not provide data on team backgrounds and mean team improvement. This extra information would provide a better interpretation of the validation strength. The convergence of expert and non-expert team performance for the final assessment may provide further evidence for validity; however, the wrong statistical test was used for this interpretation. Despite the strong validation trial set-up, the study seems to be a preliminary attempt at instrument development and is lacking the inter-rater reliability data and statistical
transparency seen in the more recent articles.
Comparison
A7
TPDSCI), report insufficient performance statistics (Trauma Team Evaluation Tool), and fail to address potential confounding variables. This author believes instrument assessment based on differentiating team experience level, as seen by Reid et al. (2012) and Holcomb et al. (2002), is the best first step forconstruct validation. A second method assessing the same team improvement after a standardized team training program, as attempted by Donoghue et al. (2011), would build to that base evidence. Two studies made claims of concurrent validity but were inappropriately based on a comparison to measures lacking validation.
The inter-rater reliability as reported by ICC varied from 0.55-0.9 between the five reporting articles. There was no standardized number of evaluators or performances for this calculation and only two studies provided a confidence interval. The studies that evaluated observer-agreement for multi-discipline team and multiple scenario performance provide the best information on expected reliability.
Table A-2. Pediatric resuscitation instrument strength comparison about here
Conclusion
A8
References
Andersen, Peter Oluf, et al. 2010. “Development of a formative assessment tool for measurement of performance in multi-professional resuscitation teams.” Resuscitation 81: 703-711.
Calhoun, Aaron, et al. 2011. “A Multirater Instrument for the Assessment of Simulated Pediatric Crises.” J of Graduate Medical Education 1: 88-94.
Cooper, Simon, et al. 2010. “Rating medical emergency teamwork performance: Development of the Team Emergency Assessment Measure (TEAM).” Resuscitation 81: 446-452.
Donoghue, Aaron, et al. 2010. “Reliability and validity of a scoring instrument for clinical performance during Pediatric Advanced Life Support simulation scenarios.” Resuscitation 81: 331-336. Donoghue, Aaron, et al. 2011. “Design, Implementation, and Psychometric Analysis of a Scoring
Instrument for Simulated Pediatric Resuscitation: A Report from the EXPRESS Pediatric Investigators.” Simulation in Healthcare 6: 71-77.
Holcomb, John B., et al. 2002. “Evaluation of Trauma Team Performance Using an Advanced Human Patient Simulator for Resuscitation Training.” J of Trauma: Injury, Infection, and Critical Care 52: 1078-1086.
Lambden, Simon, et al. 2013. “The Imperial Paediatric Emergency Training Toolkit (IPETT) for use in paediatric emergency training: Development and evaluation of feasibility and validity.” Resuscitation 84: 831-836.
Reid, Jennifer, et al. 2012. “The Simulation Team Assessment Tool (STAT): Development, reliability and validation.” Resuscitation 83: 879-886.
A9
Review Tables and Figures
Figure A-1. Literature search and selection process
A10
B1
Appendix B: Study Tools and Data
B2
B3
B4
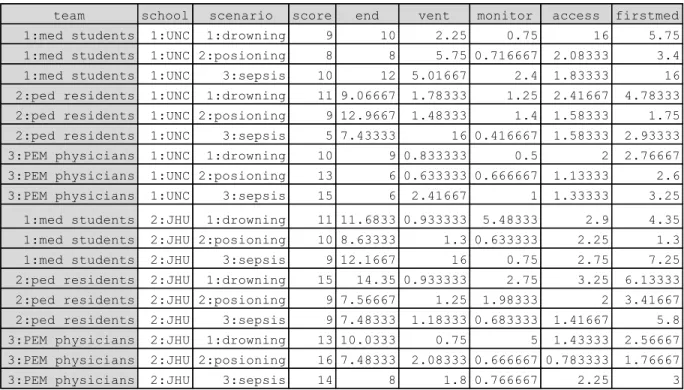
Table B-1. Stata input: team performance scores and key time values
Table B-2. Mean overall team score differences and probability by t-test
Table B-3. Time point rank-sum and difference probability by Kruskal-Wallis and Wilcoxon-Rank sum
team school scenario score end vent monitor access firstmed
1:med students 1:UNC 1:drowning 9 10 2.25 0.75 16 5.75
1:med students 1:UNC 2:posioning 8 8 5.75 0.716667 2.08333 3.4
1:med students 1:UNC 3:sepsis 10 12 5.01667 2.4 1.83333 16
2:ped residents 1:UNC 1:drowning 11 9.06667 1.78333 1.25 2.41667 4.78333
2:ped residents 1:UNC 2:posioning 9 12.9667 1.48333 1.4 1.58333 1.75
2:ped residents 1:UNC 3:sepsis 5 7.43333 16 0.416667 1.58333 2.93333
3:PEM physicians 1:UNC 1:drowning 10 9 0.833333 0.5 2 2.76667
3:PEM physicians 1:UNC 2:posioning 13 6 0.633333 0.666667 1.13333 2.6
3:PEM physicians 1:UNC 3:sepsis 15 6 2.41667 1 1.33333 3.25
1:med students 2:JHU 1:drowning 11 11.6833 0.933333 5.48333 2.9 4.35
1:med students 2:JHU 2:posioning 10 8.63333 1.3 0.633333 2.25 1.3
1:med students 2:JHU 3:sepsis 9 12.1667 16 0.75 2.75 7.25
2:ped residents 2:JHU 1:drowning 15 14.35 0.933333 2.75 3.25 6.13333
2:ped residents 2:JHU 2:posioning 9 7.56667 1.25 1.98333 2 3.41667
2:ped residents 2:JHU 3:sepsis 9 7.48333 1.18333 0.683333 1.41667 5.8
3:PEM physicians 2:JHU 1:drowning 13 10.0333 0.75 5 1.43333 2.56667
3:PEM physicians 2:JHU 2:posioning 16 7.48333 2.08333 0.666667 0.783333 1.76667
3:PEM physicians 2:JHU 3:sepsis 14 8 1.8 0.766667 2.25 3
Vent rank sum Monitor rank sum Access rank sum Firstmed rank sum
Med students 74 60 80.5 72
Ped residients 54 62 57.5 64
PEM phyiscians 43 49 33 35
p > X2 0.2359 0.7508 0.109 0.109
Resident vs Student p>|z| 0.335 1 0.1488 0.631
PEM vs Student p> |z| 0.0782 0.6298 0.02 0.0547
B5