Kehan Luo. Machine Learning Approach for Genre Prediction on Spotify Top Ranking Songs. A Master’s Paper for the M.S. in I.S degree. April, 2018. 37 pages. Advisor: David Gotz
This paper analyzed the audio features and genres of top ranking songs on Spotify from January to August in 2017. The dataset consists of daily top ranking songs, their audio features and genres. The data was collected from Kaggle.com, Spotify Web API, and Discogs AIPs. Analysis contains summary statistics, principal component analysis, and machine learning classifier implementation and evaluation. The principal component analysis converted nine audio features into three principal components and they are named as sound, words in lyrics, and rhythm according to the description of audio features they include. The machine learning method takes audio features and genres as input and predicts genres for songs in the test set based on their audio features. The
classifier achieved 46.9% accuracy which is not as good as expected. Detailed procedures, results and analysis are provided.
Headings:
MACHINE LEARNING APPROACH FOR GENRE PREDICTION ON SPOTIFY TOP RANKING SONGS
by Kehan Luo
A Master’s paper submitted to the faculty of the School of Information and Library Science of the University of North Carolina at Chapel Hill
in partial fulfillment of the requirements for the degree of Master of Science in
Information Science.
Chapel Hill, North Carolina April 2018
Approved by
Table of Contents
INTRODUCTION ... 2
RELATED WORK ... 4
Online Music Services ... 4
Music Analysis... 5
Classification... 6
METHOD ... 8
Data Collection ... 8
Data Processing ... 12
Modeling ... 18
EVALUATION AND RESULTS... 19
Evaluation ... 19
Results ... 19
DISCUSSION AND CONCLUSION ... 29
Discussion ... 29
Conclusion ... 31
INTRODUCTION
Spotify is one of the most popular on-demand music services. The number of users of Spotify is still increasing. As a music service application, Spotify provides song ranking which is updated on a daily basis. People use music service nearly every day in their daily life, scientists and developers are paying more and more attention to the analysis of music and its related applications. There are researches that focus on
underlying technologies, working mechanisms, user experience and other specific topics in music analysis field.
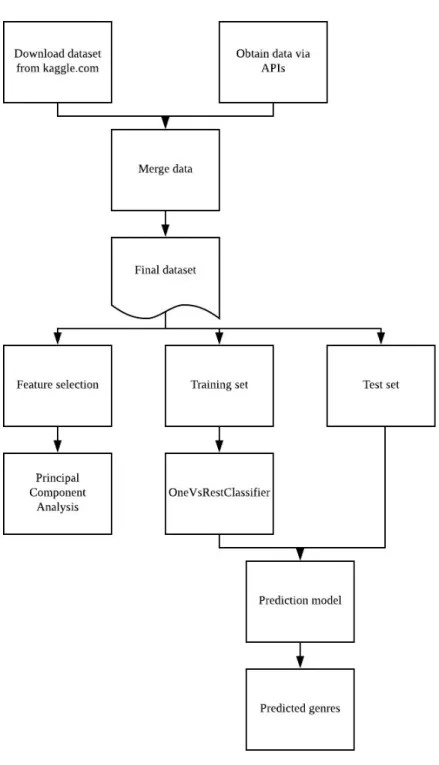
The data was collected from multiple sources and merged together into the final dataset. The ranking information of Spotify daily top 200 songs was downloaded from Kaggle.com, a data science website. The audio features of each song were obtained by Spotify Web API. Since Spotify does not label songs with their genres, the genre information of each song was obtained from Discogs, a music database website, via its API. The data from three sources was merged together to get a final clean formatted dataset for analysis. The analysis includes summary statistics of each genre and Principal Component Analysis (PCA) to classify audio features.
After analyzing audio features and genres of daily top ranking songs on Spotify, a prediction method was implemented to predict the genre of top rankings songs using their audio features. Since it is a prediction method, machine learning approach was introduced to solve this problem. The machine learning method, OneVsRestClassifier, generated a model after learning the pattern between audio features and genres in the training set and predict genres for songs in the test set using their audio features. The accuracy of
RELATED WORK
Online Music Services
The on-demand music streaming services offer streaming of full-length content via the Internet without the listeners necessarily purchasing a file or download it. Spotify is one of the most popular on-demand music services. It has 60 million subscribers as of July 2017 and 70 million subscribers as of January 2018 (Plaugic, 2018). The number of users of Spotify is still increasing. It ranked one of the most popular online music services in recent years. Its catalog of well over 30 million songs also assures the widely adoption and a large number of users (Hall, 2018). Kreitz (2010), Loiacono (2014), Verkoelen focused on more general issues about Spotify technologies and its popularity. Verkoelen conducted detailed research and analyzed the strengths and weaknesses of Spotify technologies. Loiacono (2014) studied the reasons why Spotify is popular and how effective it is in satisfying a need for personalized radio, which give an insight in how Spotify works and its influence. For more specific analysis, Dielenman (2011), Kim (2009), McFee (2011) and Rafailidis (2010) studied the similarity metrics of music ranking, ranking approaches and user modeling of Spotify.
Kreitz (2010) and Verkoelen focused on the underlying technologies of Spotify and reveal the mechanism of how it works. Researches in many fields have conducted analysis of Spotify and its users, such as information retrieval, human behavior,
technical issues about Spotify. In this paper, researchers studied the protocols and peer-to-peer architecture used by Spotify. They are useful to get a general understanding of the mechanism of how Spotify works. This study also developed measurements of service performance and studied user behavior of Spotify. They studied user access patterns and how the peer-to-peer network affects the access patterns of users.
Music Analysis
Many music analysis tasks case in a music classification setting based on features and comparison among music classes. Chai’s study (2001) focused on the classification of folk music based on monophonic melodies using hidden Markov models. The results
of his study show that melodies of music carry some features to distinguish folk music.
This study shed light on the application of music classification tasks by genres.
McKinney (2003) evaluated four audio feature sets in their ability to classify five general audio classes and seven popular music genres. This study implemented a standard
Gaussian framework for classification and the result shows that audio classification can be improved by better audio features. Mandel’s study (2005) focused on a system uses support vector machines to classify songs based on features. The result indicates the advantage of using both song-level features and SVM classifier. Bergstra (2006) presented a supervised learning algorithm to predict musical genre and artist based on
audio waveform which was demonstrated on three databases to be effective. Scaringella
(2006) reviewed the techniques of audio feature extraction and classification for genre
classification tasks. This study followed a standard taxonomy by dividing audio features
Classification
The machine learning is divided into three types: supervised learning, unsupervised learning and reinforcement learning, depending on whether the system is available to learn “signal” or “feedback”. Supervised learning aimed at learning a pattern between inputs and outputs. The machine is given input-output pairs, and it finds patterns in data from training. The given dataset is called training set that used to train the machine. This is a well-defined problem because the output is known and the predicted output is compared with the actual one. The input could be a vector with certain dimensions or a complex structured object. In principle, the form of output can be anything. But in most methods, the output is assumed to be a categorical or nominal variable, or to be a real-valued scalar. When the output is categorical decision, the problem is known as classification.
Principal component analysis (PCA) (Abdi, 2010) is a statistical procedure that uses an orthogonal transformation to convert a set of possibly correlated variables into a set of values of linearly uncorrelated variables called principal components. This transformation is defined in such a way that the first principal component has the largest
possible variance which means it accounts for as much of the variability in the data as possible, and each succeeding component in turn has the highest variance possible under the constraint that it is orthogonal to the preceding components. The resulting vectors are an uncorrelated orthogonal basis set. PCA is sensitive to the relative scaling of the original variables.
classification methods were implemented. According to Fu’s survey (2011), the common choices for classifiers for music classification tasks are K-nearest neighbor (Cover, 1967), support vector machine (Boser, 1992), and GMM classifier (Duda, 2012). There are various other options such as logistic regression (Morchen, 2006; Shen, 2009), artificial neural networks (Scaringella, 2005), decision trees (Mierswa, 2005), linear discriminant analysis (Lee, 2009), nearest centroid (Lee, 2009), and sparse representation-based classifier (Panagakis, 2008). The support vector machine is one of the most popular classifier used for music classification. It is a binary classifier based on the large margin principle. It takes labeled instances as input and finds an optimal hyperplane that
maximizes the distance between support vectors and the hyperplane. The support vectors are the instances that are closest to the hyperplane whose labels are confusing to the model. If the data will be divided into more than two classes, a kernel function is used to enlarge the feature space.
OneVsRestClassifier is a multilabel classification method based on the idea of support vector classifier. This function is available in a machine learning package, scikit-learn package for machine scikit-learning in Python. Its strategy is to fit one classifier per class. For each classifier, the class is fitted against all the other classes. In addition to its
METHOD
Data Collection
The data sources of this study are Kaggle.com, Spotify Web API and Discogs API. The data consists of original existed dataset and data collected by web APIs. The original dataset was collected from Kaggle.com, a data science website holds datasets shared by users. This dataset contains the daily top ranking of 200 most listened songs in 53 countries from January 1st to August 17th in 2017. Each data entry has ranking
Audio feature Value type Value description
acousticness float A confidence measure from 0.0 to 1.0 of whether the track is acoustic. 1.0 represents high confidence the track is acoustic.
danceability float Danceability describes how suitable a track is for dancing based on a combination of musical elements including tempo, rhythm stability, beat strength, and overall regularity. A value of 0.0 is least danceable and 1.0 is most
danceable.
duration_ms int The duration of the track in milliseconds. energy float Energy is a measure from 0.0 to 1.0 and
represents a perceptual measure of intensity and activity. Typically, energetic tracks feel fast, loud, and noisy. For example, death metal has high energy, while a Bach prelude scores low on the scale. Perceptual features
contributing to this attribute include dynamic range, perceived loudness, timbre, onset rate, and general entropy.
"Ooh" and "aah" sounds are treated as instrumental in this context. Rap or spoken word tracks are clearly "vocal". The closer the instrumentalness value is to 1.0, the greater likelihood the track contains no vocal content. Values above 0.5 are intended to represent instrumental tracks, but confidence is higher as the value approaches 1.0.
key int The key the track is in. Integers map to pitches using standard Pitch Class notation. E.g. 0 = C, 1 = C♯/D♭, 2 = D, and so on.
liveness float Detects the presence of an audience in the recording. Higher liveness values represent an increased probability that the track was performed live. A value above 0.8 provides strong likelihood that the track is live.
(amplitude). Values typical range between -60 and 0 db.
mode int Mode indicates the modality (major or minor) of a track, the type of scale from which its melodic content is derived. Major is represented by 1 and minor is 0.
speechiness float Speechiness detects the presence of spoken words in a track. The more exclusively speech-like the recording (e.g. talk show, audio book, poetry), the closer to 1.0 the attribute value. Values above 0.66 describe tracks that are probably made entirely of spoken words. Values between 0.33 and 0.66 describe tracks that may contain both music and speech, either in sections or layered, including such cases as rap music. Values below 0.33 most likely represent music and other non-speech-like tracks.
duration.
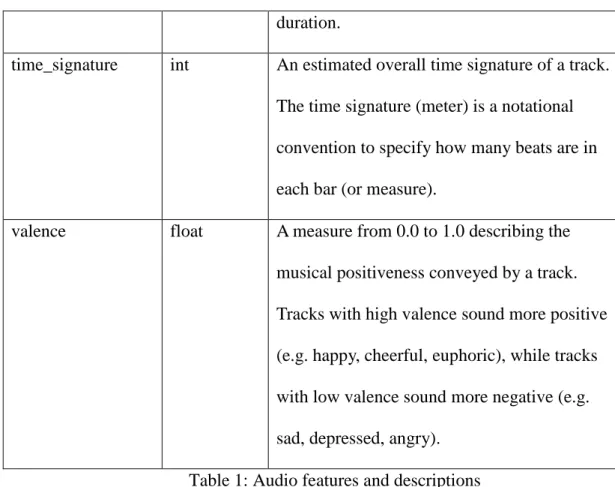
time_signature int An estimated overall time signature of a track. The time signature (meter) is a notational convention to specify how many beats are in each bar (or measure).
valence float A measure from 0.0 to 1.0 describing the musical positiveness conveyed by a track. Tracks with high valence sound more positive (e.g. happy, cheerful, euphoric), while tracks with low valence sound more negative (e.g. sad, depressed, angry).
Table 1: Audio features and descriptions
Data Processing
The data collected from three data sources was merged together into a complete final dataset. This study focused on analyzing the daily top 200 songs in the United States from January 1st to August 17th in 2017. The data processing procedures are shown in the
Figure 1: Data processing procedures
track name, artist name, date of each top-ranking song. The dataset was saved in a csv file for efficient future processing.
Second, audio features of each song were obtained by Spotify Web API. To obtain audio features from Spotify Web API, it requires the unique ID of each track. Spotify Web API takes in different search key to form corresponding HTTP request and return response in JSON format. The request for unique track ID takes track name and artist name to build a HTTP request that will be sent to the Spotify server in curl command. After obtaining ID for each track, the ID can be attached to another HTTP request to obtain audio features. Therefore, a Python program was developed to read each data entry in the dataset. For each data entry, track name and artist name were extracted and
attached to the HTTP request to obtain its unique Spotify ID. Since the request should be sent in curl command format, the curl command was converted to a section of Python code so that it can be handled in the Python program for reading and writing data. The response is in JSON format and only the unique Spotify ID was extracted from the
response by the Python program. After obtaining the unique Spotify ID, it was attached to another HTTP request to obtain audio features. The request is also a curl command which was converted to a section of Python code and ran within the program. The response is in JSON format and it was handled by the Python program to extract audio features. Each data entry was saved in a new csv file with its ranking position, track name, artist name, date, and a set of audio features.
The program reads each song’s track name and artist name from the dataset and attaches them to a HTTP request. The request was formatted as curl command first and then converted into Python code. The API sent HTTP request to Discogs’s database and return response in a JSON format. The Python code reads the JSON response and extracts the genre of each data entry. Since some songs have more than one genre, the first listed genre was considered as the primary or most possible genre for that songs because genres are not listed in alphabetic order in the response. The genre information was saved in a csv file with the track names and artist names.
The next step is to merge data from three sources together. The first data file has data from Kaggle.com. It contains ranking position, track name, artist name and date of daily top 200 ranking songs on Spotify. The second file contains audio features of each song obtained from Spotify Web API. The third file is the genre information of each song obtained from Discogs API. To merge three data files in an efficient way, a Python program was developed to read track name and artist name from the ranking file. Then it uses track name and artist name to get audio features and genre information from other two files. The ranking position, track name, artist name, date, audio features and genre information were saved into a csv file to build the final dataset.
The challenge of data processing is to obtain data from multiple sources and merge them together to get a clean and formatted final dataset. To obtain more information, two APIs were applied to collect data from two websites. The Spotify Web API has time limit for each access token. New access token must be required from Spotify Developer
multilayered. In order to get clean and well formatted data from two data sources, two Python programs were developed to handle data from two APIs separately.
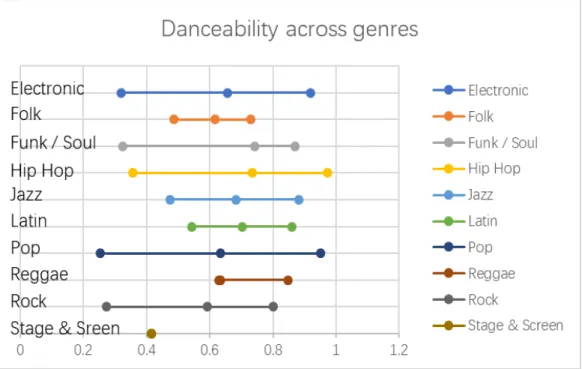
For overview analysis based on genres, the dataset was divided into subsets based on genres. According to the genre information collected from Discogs API, the whole dataset has ten different genres and each subset is the data of songs in one specific genre. The overview analysis provided summary statistics of each genre including mean value, range, and standard deviation. The analysis also focused on four representative audio features, danceability, energy, speechiness and valence, across genres. For example, to compare the danceability across genres, danceability data of each genre was extracted from the dataset and plotted into a scatter diagram.
There are 13 audio features obtained from Spotify Web API. The relationship among audio features are considered in the analysis. Some audio features might be correlated to others while some are not. Audio features were grouped into sets and each set is
features are acousticness, danceability, energy, instrumentalness, liveness, loudness, speechiness, tempo, and valence. The PCA algorithm converted possibly correlated audio features into a set of linearly uncorrelated audio features. In this procedure, audio features of all data entries were extracted from the dataset and fed to the PCA algorithm.
The machine learning method implemented for multilabel classification is named as OneVsRestClassifier. It is a model used for multilabel learning and prediction. The problem in this study is learning the pattern between audio features and genres
(multilabel) of instances and predicting the genre (label) of instances in the test set. This method fits into the scenario of this study. Since this method can only process numeric label values, the names of genres were replaced by number codes (0: Electronic, 1: Folk, 2: Funk/Soul, 3: Hip Hop, 4: Jazz, 5: Latin, 6: Pop, 7: Reggae, 8: Rock, 9: Stage & Screen). This method fits one classifier per class, so it will not introduce bias or noise by replacing genre names by numeric codes. To implement machine learning method to find the pattern between audio features and genres, the dataset was divided into training set and test set. The training set consists of the data from January 1st to May 29th (ranking
Figure 2: Labeled song example
Modeling
The songs should be categorized into genres based on their audio features. Since there are 10 genres obtained from Discogs website, the model needs to conduct multilabel learning. To build the OneVsRestClassifier, dataset should have features and labels. According to the data processing procedure, some audio features were found to be not informative so that they were excluded. The audio features kept for the model are acousticness, danceability, energy, key, liveness, loudness, speechiness, tempo and valence. The labels are ten music categories, Electronic, Folk, Funk/Soul, Hip Hop, Jazz, Latin, Pop, Reggae, Rock, and Stage & Screen. The model took audio feature and genre of each song in the training set as input and find a pattern between them. After learning process, a classifier for each label was built. Then the model was given song’s audio features in the test set. The model predicted their genres as an output for songs in the test set.
EVALUATION AND RESULTS
Evaluation
The classifier was trained using the training set and tested by the test set. The
training set consists of the data from January 1st to May 29th (ranking information on May 30th was missing) while the test set is data from June 1st to August 17th. The proportion of training set is about 58.8% of the whole dataset. Since the dataset contains data from 8 months, the test set would not be sufficient to be informative if the training set was increased to 80% of the whole dataset. After the learning process, the test set was given to the model with only audio features of each song. The model predicted the genres using audio features based on the learning process.
The model was evaluated by the accuracy of predicted genres compared with actual genres in the test set. For each genre, the precision and recall were calculated to measure the performance of the prediction model. To get an overview of several representative audio features across genres, the summary statistics such as mean value, range and standard deviation were calculated.
Results
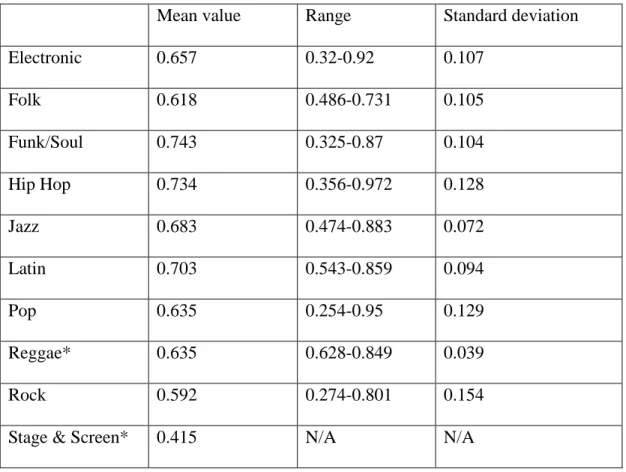
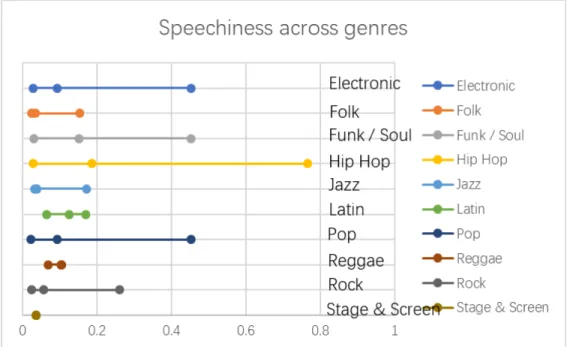
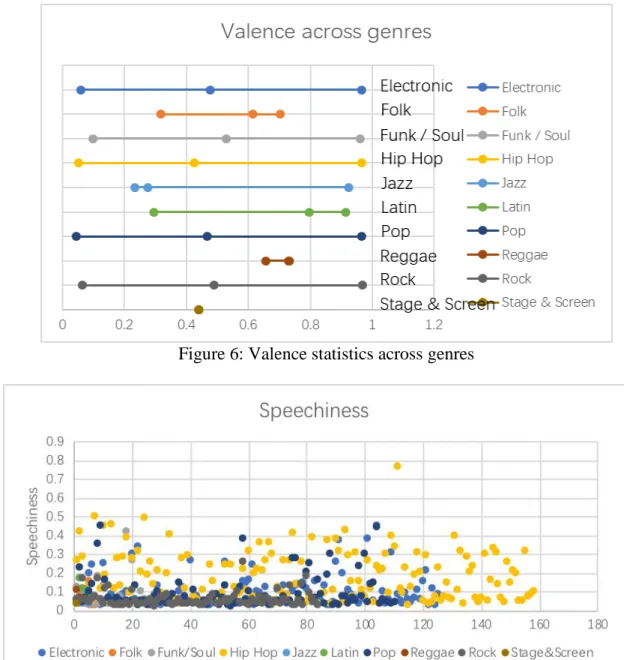
The genre-based analysis did not reveal much information as expected. Although the summary statistics revealed insufficient differences among genres, there are several conclusions can be made from the statistic figures of danceability, energy, speechiness and valence. Most genres have a wide range of danceability value which means songs in most genres can be highly danceable or not danceable. However, Reggae songs in the dataset have higher danceability than other genres with a lower limit above 0.6. Only Latin and Reggae songs have a relatively centralized distribution. One thing to notice is that the Rock genre has the widest range of energy from 0.156 to 0.978. It indicates that not all rock songs have a strong energy. Almost all genres have low speechiness value which means not much spoken words are detected in the tracks. All genres except for Hip Hop fall into the range from 0.33 to 0.66 in speechiness, which indicates that the track contains music and words. The valence value describes the musical positiveness conveyed in the track. Most genres have a wide range means that songs in different genres can be either positive or negative. When compared these four audio features across genres, it is noticeable that Reggae songs have a smaller range in all four audio features. This is a distinguishable characteristic of Reggae music with other genres.
two genres (marked with * in tables) that have less than five different songs, especially there is only one song belongs to the Stage & Screen genre. Songs’ data from these two genres are not significantly informative for the analysis process.
Mean value Range Standard deviation
Electronic 0.657 0.32-0.92 0.107
Folk 0.618 0.486-0.731 0.105
Funk/Soul 0.743 0.325-0.87 0.104
Hip Hop 0.734 0.356-0.972 0.128
Jazz 0.683 0.474-0.883 0.072
Latin 0.703 0.543-0.859 0.094
Pop 0.635 0.254-0.95 0.129
Reggae* 0.635 0.628-0.849 0.039
Rock 0.592 0.274-0.801 0.154
Stage & Screen* 0.415 N/A N/A
Figure 3: Danceability statistics across genres
Mean value Range Standard deviation
Electronic 0.663 0.245-0.995 0.157
Folk 0.632 0.469-0.915 0.165
Funk/Soul 0.657 0.18-0.835 0.148
Hip Hop 0.614 0.297-0.974 0.136
Jazz 0.684 0.121-0.762 0.203
Latin 0.776 0.677-0.823 0.039
Pop 0.624 0.214-0.924 0.156
Reggae* 0.696 0.619-0.698 0.014
Rock 0.672 0.156-0.978 0.154
Stage & Screen* 0.145 N/A N/A
Figure 4: Energy statistics across genres
Mean value Range Standard deviation
Electronic 0.093 0.0284-0.452 0.081
Folk 0.034 0.0252-0.154 0.007
Funk/Soul 0.151 0.031-0.452 0.140
Hip Hop 0.185 0.0291-0.765 0.128
Jazz 0.038 0.0328-0.171 0.022
Latin 0.125 0.0643-0.17 0.043
Pop 0.094 0.0232-0.453 0.084
Reggae* 0.104 0.0695-0.105 0.006
Rock 0.057 0.0236-0.26 0.027
Stage & Screen* 0.036 N/A N/A
Figure 5: Speechiness statistics across genres
Mean value Range Standard deviation
Electronic 0.476 0.059-0.965 0.191
Folk 0.615 0.317-0.702 0.057
Funk/Soul 0.528 0.0997-0.962 0.167
Hip Hop 0.425 0.0514-0.965 0.206
Jazz 0.275 0.233-0.925 0.128
Latin 0.796 0.294-0.913 0.176
Pop 0.468 0.044-0.965 0.226
Reggae* 0.730 0.656-0.732 0.013
Rock 0.488 0.0641-0.969 0.220
Stage & Screen* 0.44 N/A N/A
Figure 6: Valence statistics across genres
Figure 7: Speechiness distribution
possible variance decreases. In other words, energy, loudness and acousticness account for as much of the variability in the dataset as possible. According to the description of each audio features, the three components were named as sound component, words component, and rhythm component. The results revealed that a song can be described by three main characters, sound, words in the lyrics, and rhythm.
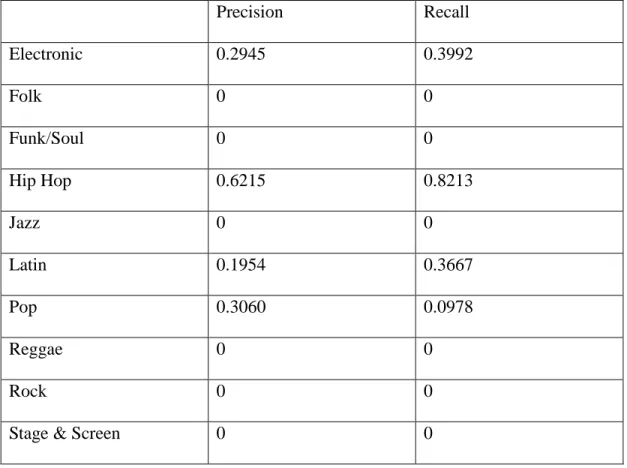
The machine learning method achieved an overall accuracy of 46.9%. The precision and recall for each genre is shown in Table 6. There are 0s in the table because the model produced 0 true positive for several genres or there is no song in the test set that was predicted to belong to certain genres.
Precision Recall
Electronic 0.2945 0.3992
Folk 0 0
Funk/Soul 0 0
Hip Hop 0.6215 0.8213
Jazz 0 0
Latin 0.1954 0.3667
Pop 0.3060 0.0978
Reggae 0 0
Rock 0 0
Stage & Screen 0 0
Table 6: Precision and recall for each genre
& Screen songs are 0. The model did not predict any song to be Folk, Funk/Soul or Rock music. However, the model predicted some songs to be Jazz, Reggae or Stage & Screen while they actually belong to another genre. The precision and recall data can explain the low accuracy of the model in predicting song genres based on audio features.
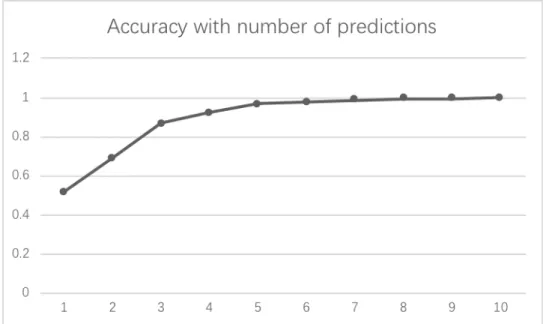
To analyze the accuracy, the probability of all labels for each song in the test set is outputted as a reference. The mean value of probability of predicted label is 0.619. Compared the probabilities with predicted genre as well as true genre, the model has more confidence in predicting Hip Hop songs. Some incorrect predictions were sampled from all incorrect prediction instances and analyzed based on the probability of labels. The result shows that the machine learning model cannot distinguish well among Electronic music, Hip Hop music, and Pop music. For example, the model predicted a song belongs to Hip Hop with the highest probability. However, the true genre might be Electronic or Pop with the second or third highest probability. In all predictions with probability higher than 0.90, most of them are Hip Hop songs and the model predicted them as the correct genre. The proportion of incorrect predictions with higher than 0.90 probability is 11.7%. These songs are predicted as Electronic by the model while they are actually Hip Hop songs. This result indicates that Electronic songs and Hip Hop songs have similar audio features so that the model makes mistake in some cases.
The result shows that some genres are similar in audio feature combinations so that the model could get a wrong genre within the first four possible genres. The top four possible genres could make the model achieve more than 90% accuracy.
DISCUSSION AND CONCLUSION
Discussion
This study involves collecting, processing and analyzing music data. The data collected from existed dataset and web APIs can be considered as raw data without preprocessing. The raw data was not in a format that can be analyzed and reveal the insight information of the dataset. It is difficult to further process massive raw data with summary statistics and machine learning model. The three main parts of the data used in this study are general information (track name, artist, ranking), genre, and audio features. During the data collection process, 13 audio features of each top-ranking song were collected from Spotify Web API. Some features are considered not informative in
describing different songs so that they were excluded during data processing and analysis procedures.
One of the challenges is to link audio features with corresponding genres. Summary statistics such as mean value, range and standard deviation is not enough to compare characteristics among genres. The existence of outliers would cause a similar mean value or range of different genres. Among all audio features, one feature might be correlated with some features while uncorrelated with others. Grouping audio features into
categories. In this study, the Principal Component Analysis (PCA) was implemented to covert audio features that are possibly correlated into linearly uncorrelated principal components. This procedure categorized audio features into three principal components.
incorrect predictions, but in fact it is only one incorrect prediction. This reason explains the low accuracy of prediction.
Conclusion
Spotify daily top-ranking songs can be described by audio features obtained using Spotify Web API and related to genres by Discogs API. However, direct analysis with raw data by summary statistics cannot reveal the underlying information of audio feature and genres. Some audio features are correlated with each other so that it is important to divide them into sets of principal components. In this study, Principal Component
Analysis (PCA) was implemented to covert audio features into three linearly uncorrelated principal components with each of them consists of several audio features. The three categories of audio features are named as sound component, words component, and rhythm component. The sound component consists of energy, loudness and acousticness. The word component consists of speechiness and valence. The rhythm component consists of danceability, liveness and valence. This approach enhances the understanding of related and similar audio features that can describe certain characteristics of a sound track.
REFERENCE
Abdi, H., & Williams, L. J. (2010). Principal component analysis. Wiley interdisciplinary reviews: computational statistics, 2(4), 433-459.
Bergstra, J., Casagrande, N., Erhan, D., Eck, D., & Kégl, B. (2006). Aggregate features and a da b oost for music classification. Machine learning, 65(2-3), 473-484.
Boser, B. E., Guyon, I. M., & Vapnik, V. N. (1992, July). A training algorithm for
optimal margin classifiers. In Proceedings of the fifth annual workshop on Computational learning theory (pp. 144-152). ACM.
Chai, W., & Vercoe, B. (2001, June). Folk music classification using hidden Markov models. In Proceedings of International Conference on Artificial Intelligence (Vol. 6, No. 6.4). sn.
Cover, T., & Hart, P. (1967). Nearest neighbor pattern classification. IEEE transactions on information theory, 13(1), 21-27.
Dhanaraj, R., & Logan, B. (2005, August). Automatic Prediction of Hit Songs. In ISMIR (pp. 488-491).
Fu, Z., Lu, G., Ting, K. M., & Zhang, D. (2011). A survey of audio-based music classification and annotation. IEEE transactions on multimedia, 13(2), 303-319. Hall, P. (2018, February 6). The best music streaming services. Retrieved from https://www.digitaltrends.com/music/best-music-streaming-services/
Kim, Y., Suh, B., & Lee, K. (2014, July). # nowplaying the future billboard: mining music listening behaviors of twitter users for hit song prediction. In Proceedings of the first international workshop on Social media retrieval and analysis (pp. 51-56). ACM.
Kreitz, G., & Niemela, F. (2010, August). Spotify--large scale, low latency, P2P music-on-demand streaming. In Peer-to-Peer Computing (P2P), 2010 IEEE Tenth International Conference on (pp. 1-10). IEEE.
Lee, C. H., Shih, J. L., Yu, K. M., & Lin, H. S. (2009). Automatic music genre classification based on modulation spectral analysis of spectral and cepstral features. IEEE Transactions on Multimedia, 11(4), 670-682.
Loiacono, C. (2014). Internet Radio: An Analysis of Pandora and Spotify.
Mandel, M. I., & Ellis, D. (2005, September). Song-Level Features and Support Vector Machines for Music Classification. In ISMIR (Vol. 2005, pp. 594-599).
McFee, B., & Ellis, D. (2014). Analyzing Song Structure with Spectral Clustering. In ISMIR (pp. 405-410).
Morchen, F., Ultsch, A., Thies, M., & Lohken, I. (2006). Modeling timbre distance with temporal statistics from polyphonic music. IEEE Transactions on Audio, Speech, and Language Processing, 14(1), 81-90.
Panagakis, I., Benetos, E., & Kotropoulos, C. (2008). Music genre classification: A multilinear approach. In ISMIR (pp. 583-588).
Plaugic, L. (2018, January 4). Spotify now has 70 million subscribers. Retrieved from https://www.theverge.com/2018/1/4/16850742/spotify-subscriber-count-70-million-users Rafailidis, D., Nanopoulos, A., & Manolopoulos, Y. (2010). Building tag-aware groups for music high-order ranking and topic discovery. International Journal of Multimedia Data Engineering and Management, 1(3), 1-18.
Scaringella, N., Zoia, G., & Mlynek, D. (2006). Automatic genre classification of music content: a survey. IEEE Signal Processing Magazine, 23(2), 133-141.
Scaringella, N., & Zoia, G. (2005, September). On the Modeling of Time Information for Automatic Genre Recognition Systems in Audio Signals. In ISMIR (pp. 666-671).
Shen, J., Shepherd, J., Cui, B., & Tan, K. L. (2009). A novel framework for efficient automated singer identification in large music databases. ACM Transactions on Information Systems (TOIS), 27(3), 18.
Sklearn.multiclass.OneVsRestClassifier. Retrieved from
http://scikit-learn.org/stable/modules/generated/sklearn.multiclass.OneVsRestClassifier.html#sklearn. multiclass.OneVsRestClassifier.predict_proba