Gentrification and Education at a Crossroads:
The Correlation between Neighborhood Change and Student Achievement Tasia S. Harris
Abstract
This thesis explores the relationship between gentrification and student achievement in New York State. Gentrification, established by Ruth Glass (1964) as a class issue contextualized by urban geographies, has historically been investigated from the perspective of the gentrifier. Much of the early gentrification research has been focused on defining the gentrifier and the factors that cause gentrification to come about. More recently, researchers have begun to turn their attention to the impact on the existing populations where gentrification takes place. However, these efforts are primarily concerned with the impact gentrification has on the accessibility of affordable housing or how it affects the business landscape. The literature on its relationship with education is very scarce.
Acknowledgements
I would like to thank my advisor Dr. Steven Hemelt for his encouragement and guidance from the beginning to the end of this process. His continued support helped me throughout the conception, research, and writing of this thesis. I could not have imagined a better advisor and mentor for my undergraduate research experience.
Table of Contents
Chapter 1: Introduction………5
Context and Significance……….5
Research Question………...7
Roadmap………..8
Chapter 2: Literature Review………...9
Core Tenets of Gentrification Research………...9
Quantifying Student Achievement……….12
Gentrification and Student Achievement………...14
Qualitative Research………..15
Quantitative Research………17
Significance and Implications of this Study………..18
Chapter 3: Data and Methods………....20
Data Sources………..20
Variables of Interest………...21
Analysis……….22
Bivariate Regression………..22
Multivariate Regression #1………22
Multivariate Regression #2………23
Measurement………..23
Chapter 4: Results………25
General Findings………25
Effect by Subject………27
Effect of Gentrification on Student Achievement as Measured by Mean Test Scores…..27
Effect of Gentrification on Student Achievement as Measured by Proficiency…………30
Chapter 5: Conclusions………...32
The Relationship Between Gentrification and Student Achievement………...32
Limitations……….33
Policy Implications………34
References……….35
Table of Figures Table 1: Methods of Measuring Student Achievement……….………13
Table 2: Association Between Measures of Gentrification and Reading and Math Test Scores for 39 counties in New York State Over 7 Years (2006 to 2012)………..…...26
Table 3: Association Between Measures of Gentrification and Reading and Math Proficiency for 39 Counties in New York State Over 7 Years (2006-2012)………....…..28
Chapter 1: Introduction
Context and Significance
In the summer of 2014, protesters lined up on the busy street of Flatbush Avenue in Brooklyn, New York, inhibiting the construction of a 23-story high-rise luxury condominium. Just a few weeks prior, they had gathered at the steps of City Hall voicing their concerns surrounding the implications of this development project. One protestor Leah Margulies asked of City Hall and the development companies, “our median income is $41,000 for a family of four—does it make sense to insert a building where studios cost $1900 [per month]?” (Curbed, 2014). Though they were able to secure a restraining order to halt the construction, a month later, a judge lifted the restraining order allowing for the continued development of the tower.
This story is not unique to Flatbush Avenue. To answer Ms. Margulies question, building studios that cost $1900 per month makes sense when they are meant to attract new residents who contribute to a steadily increasing median income. In the Williamsburg neighborhood of Brooklyn, NY, the median income range rose from $25k to $55k in 1990 to $53k to $80k by 2012. The West Harlem/Morningside Heights neighborhood of Manhattan experienced a similar upward trend in median income over the same 22 years. Heat maps created by the United States Census Bureau show that over this same time frame, cities like Oakland, Washington, DC and Philadelphia have seen their median household income increase at similar rates. These changes in median income and the rate of development projects are just two indicators of the larger urban geographical phenomenon of gentrification.
development and urban policy. Spanning several spheres of social issues, such as demographic composition, housing, and economics, it has drawn numerous researchers over the past four to five decades to examine its characteristics, causes, and, more recently, its impact within these different realms of social policy. While researchers have examined the implications gentrification holds for affordable housing, the business landscape, or the tension it inevitably creates between original residents and newcomers as neighborhoods undergo significant demographic changes, there has been very little done to examine gentrification in relation other equally pertinent public issues.
Originally described by sociologist Ruth Glass as a class issue embedded in the context of urban geographies (Glass, 1964), gentrification has continued to be depicted as a class issue. Issues of class are not without warrant for change, but gentrification as a class issue has not garnered enough public attention to demand that policymakers take an active role in mitigating any consequences of these processes of neighborhood change. In addition to its reputation as a class issue, part of this neglect to address gentrification as an issue of public policy is due to the fact that the process has historically been seen from one perspective: that of the gentrifier. Early research on gentrification was primarily focused on describing the phenomenon and determining the cause of what seemed to be irrational behavior on the part of young wealthy individuals (Kozak 2014). This perspective did not speak to what the impacts of these class-based geographical decisions might be on people and structures of existing working class neighborhoods.
namely its role in the elimination of affordable housing and the displacement of working class and minority individuals (Kozak, 2014). The second perspective has undertaken the investigation of the role of the public sphere in facilitating the advancement of gentrification, as there exist certain policies, or lack thereof, that provide a platform for housing and business development projects to draw young upper class individuals into traditionally working class neighborhoods (Bates, 2013). These two major additions to the gentrification debate have moved the discourse away from its descriptive tradition towards a critical perspective that demands the attention of policymakers. Research Question
The goal of this thesis is to examine the impact of gentrification on the academic achievement of public school students. I will examine the association between specific indicators of gentrification (median income, racial composition, and education attainment levels) and student achievement (standardized test scores in third grade English Language Arts and Math) in counties across New York State over a period of seven years (2006 through 2012). These three indicators of gentrification capture common themes in the characterization of gentrification: the influx of upper middle class, predominantly white, highly educated individuals. In terms of student achievement, the purpose of using third grade test scores is to capture the impact of the independent variables as much as possible by focusing on students who would have standardized achievement data, but who would also be young enough to not have experienced several years of schooling before gentrification began (Keels, Burdick-Will, & Keene, 2013).
emergent subset of gentrification studies. Lastly, if I find that these processes are having any impact at all on student achievement in public schools, it will reaffirm claims made by researchers in the housing, economic, and social realms that gentrification is a public issue to be addressed in policy.
Roadmap
Chapter 2: Literature Review
Core Tenets of Gentrification Research
Glass’ idea of gentrification as a class issue that plays out within the context of urban
geographies (Glass, 1964) has remained at the root of gentrification studies and research. Over the
past several decades, researchers, regardless of the goals of their studies, have continued to define
and measure gentrification as a function of class difference and displacement. Since the term’s
debut in Glass’ 1964 piece, researchers have rearticulated her findings. Zukin (1987) defines
gentrification as, “the conversion of socially marginal and working-class areas of the central city
to middle-class residential use” (Zukin, 2). Atkinson (2000) in a study on displacement in London
defines it as, “a process of class succession and displacement in areas broadly characterized by
working-class and unskilled households” (Atkinson, 1). Later Baxter (2009), continued in Glass’
trend by defining the process as
…the ‘upgrading’ of geographic space so that it reflects middle class values…gentrification is a gradual process, occurring over years and even decades. It entails middle class households moving into a disinvested, economically-depressed area, buying real properties, renovating them and, by virtue of doing so, increasing property values. The property appreciation in turn increases contract rents and property tax bills, often resulting in a lower class household displacement…(Baxter, 2009)
As recently as 2014, scholars defined gentrification as a process that “traditionally occurs when
middle-class families move in and renovate economically depressed, inner-city neighborhoods,
which often results in the displacement of the existing, working-class residents” (Kozak, 2014).
That this trend of working class displacement by the middle class ever transpired, and
continues to occur, defies neoclassical urban models of the Chicago School. These models
predicted a “natural process” whereby consumers would sacrifice distance to urban centers for
Movement” this anomaly initiated what is now another prominent aspect of gentrification research:
defining the type of middle class individuals who would choose to go against the natural process
and occupy these spaces.
This recognition that gentrification is comprised of transformations that encompass both
physical changes (i.e. deindustrialization, suburbanization, and the disinvestment in ethnic
enclaves and lower class areas of the inner city), as well as social and cultural changes (i.e. the
unexpected preferences of the middle class), prompted David Ley to forge the term “the new
middle class” (Lees, 2012). Though David Ley’s gentrification research focused primarily on
Canadian cities, his findings are applicable to international gentrification trends. In a more recent
piece since Ley first posited the term, Ley describes the new middle class using a stage model:
In the model, a lower-middle class of professionals and pre-professionals (students) seeking inexpensive housing in the inner city comprises the first wave of gentrification. The presence of artists among this group has been a strong predictor of subsequent gentrification (Ley, 1996, 2003). Artists gravitate towards central locations with low rents and high degrees of social diversity. Soon after their arrival, they are joined by a broader stratum of social and cultural workers, the ‘cultural new class’ including arts, design and media workers, educators and social and health care workers. Although generally highly educated professionals, this sub-group of the new middle class shares something of the artists’ valuation of bohemian landscapes and urban authenticity (Lloyd, 2006). These residents, in turn, are succeeded in a third stage by increasingly affluent gentrifiers in an ascending economic hierarchy, including corporate lawyers, medical specialists, business people and capitalists (Danyluk & Ley, 2006).
The idea of the new middle class as a progression along a gradient of groups with different
characteristics and preferences provide a method of measuring the process of gentrification that is
primarily driven by the individual.
The establishment of a widely accepted definition of gentrification and of the general
characteristics and demographics of gentrifiers is crucial to research on gentrification, as efforts to
measure its beginnings, rate of neighborhood change, or its impact depend on a clear definition of
the phenomenon as well as its agents of change. Though it seems that class based explanations of
thought regarding the factors driving middle class preferences as well as the unique role of race in
the United States, complicate both the definition of gentrification and theories of its cause.
Due to policies and practices that have historically favored whites over blacks and other
people of color in the United States, income and class divisions fall along racial lines. This frequent
intersection of race and other social identifiers means that gentrification is not only witnessed and
interpreted as a class struggle, but equally as one of color, where neighborhoods with
predominantly minority residents become predominantly white in tandem with the class status
change of the neighborhoods.
The relationship between race and other social identifiers that have been used to account
for gentrification (i.e. class status and income) has prompted several researchers to also include
race as a measure of gentrification. Glick (2008) highlights the intersection of class and race as he
explores the impact of gentrification by white middle class individuals on Black and Latino
homeowners. Hwang (2014) echoes this intersection as she states “gentrification in US cities has
been problematic for low-income minorities” (Hwang, 2). Formoso, Weber, & Atkinson (2010)
also conflate class and race in their study on the impact of gentrification on children’s well-being:
…before change occurs, the condition of a gentrifying neighborhood is deficient relative to other parts of an urban area in terms of median household income, aggregate property value, and crime, and vacancy rates…these neighborhoods, prior to the change, often were predominantly comprised of ethnic minorities (Formoso, Weber & Atkinson, 2010).
The persistent intersection of race and class in gentrification research suggests that race remains
as much a key indicator of gentrification as class and income.
In addition to race, defining gentrification is also complicated by the competing ideas of
production-based theories and consumption-based theories of the cause of gentrification.
Consumption-based theories reaffirm what Ley has declared as the agent of gentrification:
created by capitalism as the factor driving investors towards gentrification (Kozak, 2014).
Billingham (2013) defines gentrification as “the manifestation of efforts by municipal
governments to spur economic development by making their cities more amenable to use by
members of the professional classes and by the businesses that employ them.” In this
production-based conceptualization of gentrification, rather than individuals and their preferences driving
gentrification, conditions created by the government and subsequent economic development drives
gentrification.
Given the various social, cultural, and economic factors that contribute to gentrification,
any definition or measurement of the process must simultaneously account for categorical
indicators, quantitative measures, (i.e. race, class, income), and resolve or control for the
possibility that the agent of gentrification could be either individual or structural.
Quantifying Student Achievement
One of the major contributions of this study is its intent to expand the scope of
gentrification research to include the potential impact of gentrification on education. An obvious
indicator of the quality of education is student achievement. Best practices concerning the
measurement of student achievement continue to be contested today, as student achievement is
used to characterize school quality, teacher effectiveness, or factors beyond the school setting, like
neighborhood safety.
In 2012, the Center for Educator Compensation Reform of the US Department of Education
published Understanding the Basics of Measuring Student Achievement. This piece outlines broad
categories of student achievement measurement models: 1) student attainment, 2) gain, 3)
objectives (SLOs) (Scott and Miller, 2012). Table 1 below portrays each method as described by
the authors:
Table 1: Methods of Measuring Student Achievement
(1) Attainment “Attainment scores reflect student performance on a particular assessment at a single point in time. These measures are easy to compute and widely used in school systems to determine performance related to benchmarks, such as Adequate Yearly Progress (AYP).”
(2) Gain “…gain measures take a longitudinal approach. Gain in
student test scores is the difference between student performance on a post-test and the same group of students’ performance on the corresponding pre-test.” (3) Percentile Growth “Student growth percentiles…compare test score growth
across groups of academic peers, which are students with similar test score histories in the same grade and subject…percentile growth [ranks] each student’s growth with all other student who have similar student achievement histories.”
(4) Standard Value-Added “By controlling for prior student test scores, standard models will take into account some of the non-school factors that contribute to student achievement.”
(5) Customized Value Added “Unlike standard added models, customized value-added models may consider the effects of non-school factors that contribute to student achievement in specific states and/or districts…value-added may also take into account many…school and classroom level factors…” (6) Student Learning Objectives
(SLOs)
“…SLOs are goals set by teachers that specify what students will know, or able to perform, after completing a quarter, semester, or school year.”
Source: US Department of Education - Center for Educator Compensation Reform (2012)
Although Scott and Miller describe approaches of assessing student achievement holding
educator effectiveness as the independent variable, understanding the different methods available
for measuring student achievement are especially relevant to this study, where the intention is to
measure the impact of gentrification on student achievement. Having a reliable, quantifiable
method of measuring student achievement will allow for a strong analysis. While some
changes in student achievement over a longer period of time, my research will be conducted in a
relatively short period of time and the conditions required of these models (pre- and post-testing
of the same group of students, or the ability to compare test growth across academic peers) are not
achievable in a shorter period of time. Additionally, these methods are likely to have significant
internal validity gaps, as attrition rates may be of concern in gain models, value-added models
have come under scrutiny for issues of accurate implementation (Amrein-Beardsley, 2012; Bonk
et al, 2012) and teacher portfolios are extremely vulnerable to the personal bias of teachers.
Among research that uses student achievement as a dependent variable, the most common
methods for measuring student achievement, regardless of the independent variable, are student
test scores. This study will also follow the practice of student achievement measures as it seeks to
explore the quantifiable impact of gentrification on student achievement. Test scores provide
accessible, quantifiable resources for gauging student achievement that can be incorporated into a
quantitative analysis
Gentrification and Student Achievement
From the 1950s to today, researchers have explored the impact of gentrification on the
urban housing landscape, examining the implications for affordable housing or the prevalence of
high development projects (Kozak, 2014; Billingham, 2013). Research on gentrification has also
studied the influence it has on business and the economics of the affected neighborhood. However,
there is very little work on the impact gentrification has on neighborhood schools or student
achievement specifically. My goal is to ask what this phenomenon means for the students attending
schools in areas where there is an influx college educated, middle class individuals. How might
The two strands of research on gentrification and education are divided by whether the
researchers conduct a qualitative analysis or quantitative analysis. Across the limited work on this
topic there are no real common themes or methodologies as the purpose of each researchers work
varies significantly.
Qualitative Research
A prime example of the qualitative research on the intersection of gentrification and
education has been conducted by urban sociologist, Judith N. DeSena. DeSena (20092) seeks to
study, qualitatively, the impact of gentrifying parents on schools. Her research explored the
manifestations of social class distinctions in the Greenpoint neighborhood of Brooklyn, New York
in its initial stages of gentrification, i.e. during the period of transition from residents of primarily
low-income, working class demographics, to largely middle class residents. Although most
research portrays gentrifiers as young, childless individuals, DeSena focuses on gentrifying parents
and families. It is this focus on the gentrifying family that leads to her study and conclusions about
how the process of gentrification can impact schools in gentrifying neighborhoods. Through a
series of interviews aimed at determining how gentrifying families engage with neighborhood
schools, she finds that gentrfying parents are more likely than not to seek out education
opportunities outside of the neighborhood. This active rejection of neighborhood schools, leads to
segregation by social class of children with local schools (DeSena, 2009). Overall, DeSena finds:
The gentry are more accustomed to relative privilege and have made a judgment about what constitutes quality education. Their lower income neighbors accept public schools and believe that their only other choice is to pay tuition…They are largely unaware of the options within the pubic school system, such as entrance by lottery or applying to specialized schools…and the additional strategies used by their gentry neighbors. These practices result in negative consequences for community cohesion.
These findings are extremely relevant to this study considering that other researchers have
advocacy and involvement of gentrifying parents who are dissatisfied with the quality of
neighborhood schools (Formoso, Weber, & Atkins, 2010).
Other qualitative work on this area of gentrification suggests that by-products of
gentrification, such as improved institutional resources and collective socialization work together
to improve children’s well-being, a larger umbrella of indicators that includes performance in
schools (Formoso, Weber, & Atkins, 2010). This claim rests heavily on the assumption that
gentrifying families and original residents interact formally in institutional spaces like the school,
or informally.
The possibility that these parents would instead find other options for their children, which
DeSena explains by saying it is easier to commute children than leverage their human and social
capital to affect change in schools, hold serious implications for the impact of gentrification on
student achievement (DeSena, 2009). If gentrifying parents choose to educate their children
through avenues other than neighborhood schools, gentrification may give way to an even more
segregated schooling landscape than we already have, where even students who live in the same
neighborhood will have a schooling experience that is segregated by class, income, and/or race.
DeSena also conducted a study in conjunction with George Ansalone that takes another
qualitative look at the impact of gentrification on education. The study expands on her initial
findings in her book, and verifies, by means of interviews, that gentrification contributes to the
accentuation of between-school tracking (DeSena & Ansalone, 2009). Although the study finds
that over time, more than 50 percent of gentry families choose to send their children to schools
and education programs outside of their neighborhood, these findings were based on interactions
location pose significant limitations with regards to external validity and the generalizability of
these findings.
Quantitative Research
Of the already slim pool of research on gentrification and education is a slimmer pool for
which the variables of interest and findings are quantified. In Chicago, it was determined that,
overall, gentrification has little effect on neighborhood public schools (Keels, Burdick-Will &
Keene, 2013). If there is any impact, it may be slightly negative as neighborhoods skew to meet
the needs and preferences of higher income residents. For example, as the median income in a
neighborhood increased, students experienced a lower than average increase in test scores.
The researchers of this study establish gentrification as their independent variable and third
grade standardized test scores as their dependent variable. They measured and defined
gentrification using a categorical and linear method. Using Taylor and Puente’s work from 2004
on gentrification in Chicago, they determine that a neighborhood has gentrified if:
…during a given decade…it undergoes at least two of the following: 9 percent increase in the percent of residents with a college education, 29 percent consumer price index (CPI)-adjusted increase in average household income, 65 percent CPI-(CPI)-adjusted increase in average home value, or 11 percent increase in CPI-adjusted median rent (Keels, Burdick-Will, & Keene, 2013).
The linear method draws on Griffith’s definition of gentrification as the “in-migration of middle-
and upper-income households into existing lower income urban neighborhoods and the upgrading
of the housing stock therein.” By using this linear method, the researchers are able to eliminate the
perceived difference between consumption based theories and production-based theories for the
occurrence of gentrification. Regardless of whether individuals are driving the change or
conditions are created to attract these individuals, the ultimate situation is a change in residents’
assumption that children in earlier grades are more impacted by the effects of gentrification than
older children who would have completed several years of school before the neighborhood was
gentrified.
The analysis that is created with these variables is a linear growth model that tests the extent
to which the rates of growth in test scores for each school are associated with level of neighborhood
change.
Researchers of this study found negligible improvements in student achievement: for
reading, a 1 percent increase in the fraction of residents with a bachelor’s degree is associated with
an annual increase in reading scores 0.002 points higher than Chicago Public Schools average—
less than one half of 1 percent of the average growth each year. These insignificant findings
extended across subjects. Further, there were high rates of student mobility in Chicago Public
Schools. The prevalence of student mobility suggests that even if schools were to improve, the
original low-income students would not benefit, as they would no longer reside in neighborhoods
with these improved schools.
Though this study concluded with largely insignificant findings, the research design and
methodology provides a solid framework for conducting a similar study in counties in New York
State.
Significance and Implications of this Study
This study has the potential to make three major contributions to the existing research on
gentrification. First, it will contribute to the developing definition of gentrification. By continuing
to incorporate race as an equally essential indicator and measure of gentrification in the state of
include race, or if it shows race to have an insignificant impact, may suggest the decreasing
importance of race as a factor in the process of gentrification.
Secondly, this study will examine associations of changes in student achievement with
neighborhood change, and add to the growing knowledge about this relationship. There are three
major camps of gentrification research: 1) descriptive studies that dominated most of the initial
research, 2) studies that seek to explain the causes of gentrification (consumption- and
production-based theories), and 3) studies that examine the impact of gentrification on other sphere social
policy. Because the third camp mostly consists of research on housing and displacement, the study
on the impact gentrification has on student achievement will diversify the research on impact and
foster a more multifaceted analysis of the implications of gentrification.
These potential contributions hold significant implications for policies concerning
gentrification. Although a substantial amount of work has been to substantiate gentrification’s
negative impact on the availability of affordable housing, if this study reveals that there are positive
or negative impacts of gentrification on education, policymakers would then have to consider the
Chapter 3: Data and Methods
Data Sources
In order to address the general question of the impact of gentrification on student
achievement, I will use data from two sources: Student achievement data will be collected from
the New York State Department of Education on the standardized test performance of all
third-graders attending neighborhood schools in the 63 counties of New York. The standardized test
scores include both Math and English Language Arts statewide assessment over a period of 7 years
(2006 through 2012). This specific time frame is due to data constraints, but fortunately also allows
for the analysis of change in student achievement during the period of the most rapid gentrification
in Brooklyn. From 2006 to 2012, several Brooklyn neighborhoods lost significant percentages of
Black and Latino residents as interactive maps on the Census Explorer indicate.1 The intent behind using third grade test scores is consistent with the research conducted in Chicago that determined
third grade to be most appropriate given that students will not yet have been conditioned to
standardized testing, nor been in the public school system long enough to be biased (Keels et al,
2013).
In terms of quantifying gentrification, I will collect data on demographic and population
trends in New York’s counties using the United States Census Bureau’s American Community
Survey. More specifically, I will focus on the educational attainment levels of residents, their
household income, and the racial composition of each county. Educational attainment, income,
and race will be used. These indicators seem to be the defining characteristics of gentrifying
individuals according to the literature on this topic (Atkinson, 2000; Baxter, 2009; Billingham,
2013; DeSena, 2009; Danyluk & Ley, 2006; Formoso, 2010; Glass, 1964; Glick, 2008; Hwang,
2014; Keels et al, 2013; Kozak, 2014; Lees, 2012; & Zukin, 1987).
Ultimately I will be constructing my own data set of New York State that will consist of
standardized test scores by county, and the demographic and population trends in the 63 counties
from 2006 through 2012.
Variables of Interest
The dependent variable of interest, student achievement will be measured by student test
scores on statewide standardized tests. Test scores are given in both raw scores and on a scale of
1 to 4. Scores of 470-680 are below standard (1), scores 661-683 meet basic standard (2), scored
684-706 meet proficiency standard (3), and scores 707-770 exceed proficiency standard (4). This
thesis will make use of the percentage breakdown of the categorical scores for each county
provided by the New York State Department of Education.
The independent variable of interest is broadly referred to as gentrification, but in this thesis
takes the specific form of increased educational attainment levels, increased income levels, and
decreasing levels of Black and Latino residents. Each of these indicators will be interpreted as
continuous variables, since they are all measured as percentages by the US Census Bureau’s
America Community Survey. In addition to these independent variables, I will include the poverty
rate, unemployment rate, and population density of each county as control variables. Each of these
designated control variables are significant confounding variables whose impact should be
clarified as each of them is related to student achievement and the other social identifiers I have
included in my definition of gentrification.
My analysis will include bivariate regressions for each aspect of gentrification, and two
separate multivariate regressions that seek to achieve more precise measures of the relationship
between each indicator of gentrification and student achievement.
Bivariate Regression:
Υ𝜅𝜏 = 𝛽0+ 𝛽1Ν𝜅𝜏+ 𝛽2(𝑦𝑒𝑎𝑟)𝜏 + 𝜀𝜅𝜏
In this bivariate regression, Υ𝜅𝜏 represents the test score in ELA or Math in county 𝜅 in year 𝜏, Ν
represents one of the three gentrification indicators in county 𝜅 in year 𝜏. This regression will serve
as a preliminary measure on the association between the dependent variable (ELA and Math test
scores) and each independent measure of gentrification from 2006 to 2012. I also included a
dummy year variable to control for time. Since change over time is at the center of my analysis,
this variable will be used in regression analyses.
After conducting these bivariate regressions, I will conduct the following two multivariate
regressions:
Multivariate Regression #1:
Υ𝜅𝜏 = 𝛽0+ 𝛽1(𝑒𝑑𝑎𝑡𝑡𝑛)𝜅𝜏+ 𝛽2(𝑖𝑛𝑐𝑜𝑚𝑒)𝜅𝜏+ 𝛽3(𝑟𝑎𝑐𝑒)𝜅𝜏+ 𝛽4(𝑦𝑒𝑎𝑟)𝜏 + 𝜀𝜅𝜏
In this regression, Υ𝜅𝜏 represents the test score in ELA or Math in county 𝜅 in year 𝜏, (𝑒𝑑𝑎𝑡𝑡𝑛)𝜅𝜏
represents the educational attainment level of residents in county 𝜅 in year 𝜏, (𝑖𝑛𝑐𝑜𝑚𝑒)𝜅𝜏
represents the household income in county 𝜅 in year 𝜏, and (𝑟𝑎𝑐𝑒)𝜅𝜏 represents the racial
demographics of county 𝜅 in year 𝜏. This regression allows for the assessment of the relationship
between each component of gentrification and student achievement while controlling for the other
measures. It also contributes to the growing literature about which aspect of gentrification is most
knowledge on which factors of gentrification most impact student achievement will influence how
they address gentrification.
Multivariate Regression #2:
Υ𝜅𝜏 = 𝛽0+ 𝛽1(𝑒𝑑𝑎𝑡𝑡𝑛)𝜅𝜏+ 𝛽2(𝑖𝑛𝑐𝑜𝑚𝑒)𝜅𝜏+ 𝛽3(𝑟𝑎𝑐𝑒)𝜅𝜏+ 𝛽4(𝑝𝑜𝑣𝑒𝑟𝑡𝑦)𝜅𝜏
+ 𝛽5(𝑢𝑛𝑒𝑚𝑝)𝜅𝜏+ 𝛽6(𝑝𝑜𝑝)𝜅𝜏+ 𝛽1(𝑦𝑒𝑎𝑟)𝜏+ 𝜀𝜅𝜏
In this regression, I will add control variables for the poverty rate, unemployment rate, and the
population density of each county 𝜅 in year 𝜏. Each of these additional controls all have the
potential to correlate with the observed test scores as well as the measures of gentrification.
Including them in this regression helps to net out the influence of potentially confounding factors. These regressions serve to increasingly measure the effect of these different aspects of
gentrification on counties throughout the state and will help to discern which aspect of
gentrification is most relevant regarding student achievement or if the demographic changes
associated with gentrification have any impact at all in counties in New York.
Measurement
The benefit of using data source like the New York State Department of Education is that
the data are not self-reported, which eliminates some sources of bias. Both the Census and the
NYS Department of Education encompass large populations that build a significant sample size,
minimizing noisy data. Using data from the Census Bureau is also beneficial due to the yearly data
collection provided by the American Community Survey, which offers a more precise look at the
changes in student achievement and neighborhood demographics over time.
My data sources and methods also present significant challenges considering the
granularity lost when measuring changes in student achievement and demographics changes at the
demographic information on lower geographic levels than the county, however, that information
is only available in five-year aggregates. Since the key aim of this thesis is to examine changes in
student achievement within the context of changes in neighborhood demographics, I have chosen
Chapter 4: Results
General Findings
The impact of gentrification on student achievement is most apparent in the income aspect of gentrification. Of all three measures of gentrification median income consistently had the largest and most statistically significant association with mean ELA scores and ELA proficiency rates. However, the association between median income and these measures of student achievement is positive while other aspects of gentrification (educational attainment and racial demographics) have a negative association with student achievement. Although the median income variable was intended to capture the trends in income as it relates to gentrification, the fact that it has this positive relationship suggests that it may be more representative of the higher scores of new higher income students rather than of higher scores among students who remain in a place that is undergoing gentrification. Unfortunately, my data and methods are not designed in a way that allows me to discern which perspective of median income is being captured. The second most significant aspect of gentrification in relation to student achievement is race, as the percent of Black and Latino residents consistently has a statistically significant impact (also in relation to ELA scores and proficiency).
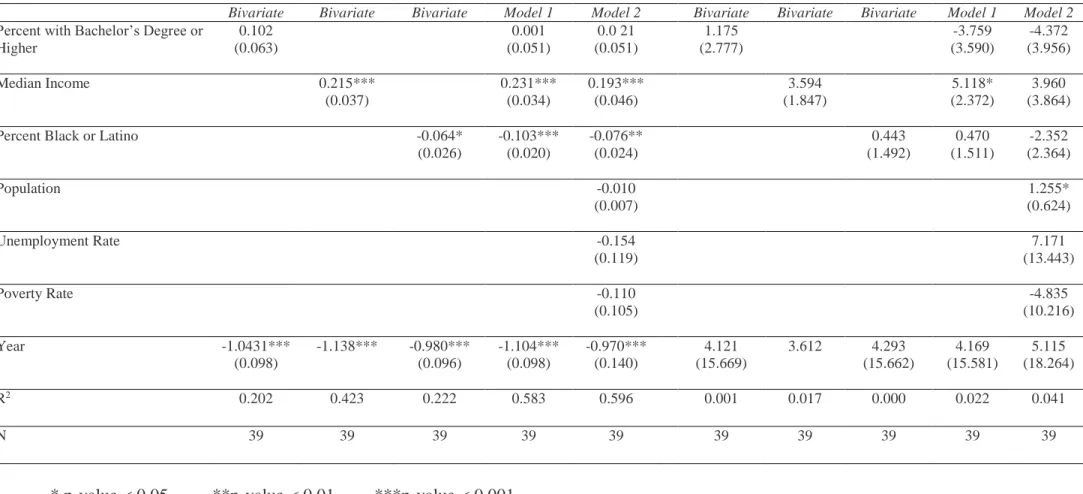
Table 2: Association Between Measures of Gentrification and Reading and Math Test Scores for 39 counties in New York State Over 7 Years (2006 to 2012)
Mean English Language Arts Test Score Mean Mathematics Test Score°
Bivariate Bivariate Bivariate Model 1 Model 2 Bivariate Bivariate Bivariate Model 1 Model 2
Percent with Bachelor’s Degree or Higher 0.102 (0.063) 0.001 (0.051) 0.0 21 (0.051) 1.175 (2.777) -3.759 (3.590) -4.372 (3.956)
Median Income 0.215***
(0.037) 0.231*** (0.034) 0.193*** (0.046) 3.594 (1.847) 5.118* (2.372) 3.960 (3.864)
Percent Black or Latino -0.064*
(0.026) -0.103*** (0.020) -0.076** (0.024) 0.443 (1.492) 0.470 (1.511) -2.352 (2.364)
Population -0.010
(0.007)
1.255* (0.624)
Unemployment Rate -0.154
(0.119)
7.171 (13.443)
Poverty Rate -0.110
(0.105)
-4.835 (10.216)
Year -1.0431***
(0.098)
-1.138*** -0.980*** (0.096) -1.104*** (0.098) -0.970*** (0.140) 4.121 (15.669)
3.612 4.293 (15.662)
4.169 (15.581)
5.115 (18.264)
R2 0.202 0.423 0.222 0.583 0.596 0.001 0.017 0.000 0.022 0.041
N 39 39 39 39 39 39 39 39 39 39
* p-value < 0.05 **p-value < 0.01 ***p-value < 0.001
increase in ELA proficiency rates. Across the majority regression models, the passage of time maintains a statistically significant negative impact on student achievement. Though the impact on scores and proficiency levels suggests that the aspects of gentrification most relevant to student achievement are the median income and racial composition of the area, the real impact of both aspects is minor.
Effect by Subject
Surprisingly, the effect of gentrification appeared very different depending on the subject. While educational attainment seemed to have a slightly positive association with mean ELA scores, it had a negative association with mean Math scores. The statistical significance of the relationship between mean ELA scores and the percentage of Black and Latino residents was much higher than for mean Math scores. However, as with mean test scores, the percentage of Black and Latino residents had a more statistically significant association with ELA proficiency than it did with Math proficiency. Overall, ELA scores and proficiency rates have more statistically significant results than math scores and proficiency rates, and are therefore referred to more frequently when analyzing the impact of gentrification on student achievement.
Effect of Gentrification on Student Achievement as Measured By Mean Test Scores
Table 2 presents results from the bivariate and multivariate models discussed in Chapter 3, where outcomes are mean test scores in English Language Arts and Mathematics. Through a series of bivariate regressions, I examined the relationship between the three separate measures of gentrification and mean test scores, while controlling for a linear time trend.
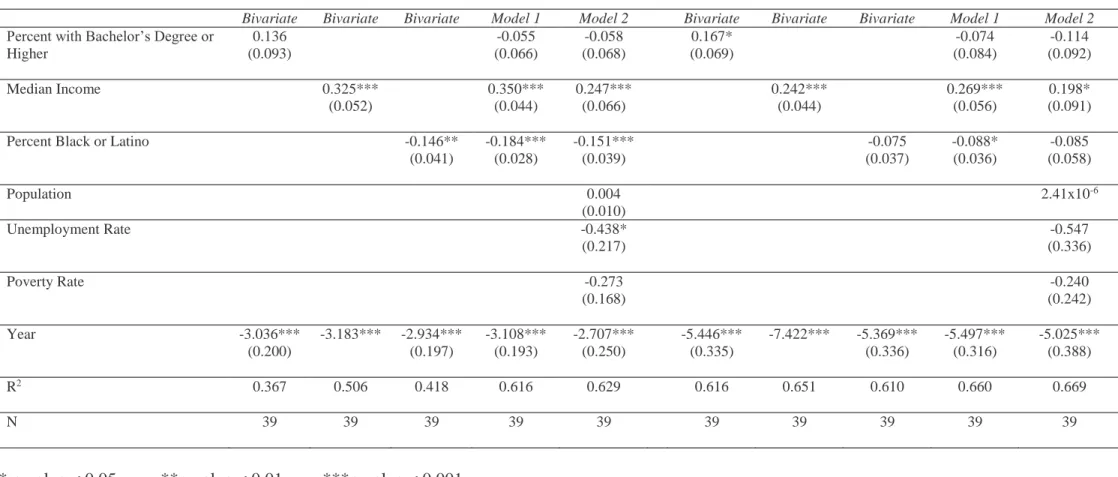
Table 3: Association Between Measures of Gentrification and Reading and Math Proficiency for 39 Counties in New York State Over 7 Years (2006-2012)
English Language Arts Proficiency Mathematics Proficiency
Bivariate Bivariate Bivariate Model 1 Model 2 Bivariate Bivariate Bivariate Model 1 Model 2
Percent with Bachelor’s Degree or Higher 0.136 (0.093) -0.055 (0.066) -0.058 (0.068) 0.167* (0.069) -0.074 (0.084) -0.114 (0.092)
Median Income 0.325***
(0.052) 0.350*** (0.044) 0.247*** (0.066) 0.242*** (0.044) 0.269*** (0.056) 0.198* (0.091)
Percent Black or Latino -0.146**
(0.041) -0.184*** (0.028) -0.151*** (0.039) -0.075 (0.037) -0.088* (0.036) -0.085 (0.058)
Population 0.004
(0.010)
2.41x10⁻⁶
Unemployment Rate -0.438*
(0.217)
-0.547 (0.336)
Poverty Rate -0.273
(0.168)
-0.240 (0.242)
Year -3.036***
(0.200)
-3.183*** -2.934*** (0.197) -3.108*** (0.193) -2.707*** (0.250) -5.446*** (0.335)
-7.422*** -5.369*** (0.336)
-5.497*** (0.316)
-5.025*** (0.388)
R2 0.367 0.506 0.418 0.616 0.629 0.616 0.651 0.610 0.660 0.669
N 39 39 39 39 39 39 39 39 39 39
* p-value < 0.05 **p-value < 0.01 ***p-value < 0.001
higher to increase mean ELA scores by 0.102 points, and a one percent increase in the fraction of Black and Latino residents to decrease mean ELA scores by 0.064 points. Of these three bivariate relationships, only median income and the fraction of Black and Latino residents are statistically significant. Interestingly, results also illustrate a downward trend in ELA test scores over time. This relationship is much larger than any of the gentrification measures’ and it maintains high statistical significance in each bivariate model.
Also in Table 2 are the findings from the first multivariate regression (labeled Model 1). These findings factor in each aspect gentrification while controlling for secular trends in test scores over time. The impact (or lack thereof) of median income increased slightly, while the impact of educational attainment levels (i.e. the percentage of those with a Bachelor’s degree or more) decreased significantly. Lastly, the impact of the fraction of Black and Latino residents increased in both magnitude and statistical significance.
Effect of Gentrification on Student Achievement as Measured By Proficiency
In addition to examining the effect of gentrification on mean test scores, I also examined its effect on proficiency in both English Language Arts and Mathematics. These statistical analyses revealed similar results as the mean test score findings. While the bivariate analyses indicated that the percentage of those with a Bachelor’s degree or higher might be the most pressing factor, as controls were increasingly introduced, the impact of the percentage of residents with a Bachelor’s degree or higher decreased in magnitude. Median income had the largest and most statistically significant impact, with the percentage Black or Latino having the next largest influence (Table 3).
Table 4: Descriptive Statistics of New York State Over 7 Years (2006-2012)
Descriptive Statistics
Variable Mean Standard Deviation
Mean ELA Score 667.907 5.954
Mean Math Score° 714.538 399.816
ELA Proficiency 65.160 10.441
Math Proficiency 75.118 15.377
Percent with Bachelor’s Degree or Higher 28.655 9.650 Median Income (increments of $1,000s) 54.841 14.357
Percent Black or Latino 17.503 17.749 Total Population (increments of 10,000) 48.078 62.080
Poverty Rate 13.447 4.784
Unemployment Rate 7.851 2.606
N = 39 counties
° Mean math scores were unavailable for 2006.
Chapter 5: Conclusions
The Relationship Between Gentrification and Student Achievement
The main research question for this thesis was to explore the relationship between gentrification and student achievement. In doing so, this thesis sought to contribute to the growing definition of gentrification as well as to the growing literature on the association between gentrification and student achievement. Given prior research on gentrification itself, I settled on a three-pronged definition of gentrification that consisted of racial demographics, median income, and educational attainment levels. Measuring student achievement by standardized test scores was also motivated by prior literature, which indicated that numerical representations of student achievement were least biased and most generalizable.
is not to be discredited. The study of gentrification, though rooted in class-based and racial discourse, has recently tended to place more emphasis on class, but these findings show that race remains relevant.
Limitations
Ideally, future work should be modeled after the Keels et al (2013) study on neighborhood change and student achievement in Chicago. These authors focus on the relationship between gentrification and student performance on a much smaller geographic level (i.e., census tracts) over a longer period of time. While gentrification eventually manifests across an entire county, it starts on much smaller geographic scales (blocks or neighborhoods within a county). These authors were also able to isolate the students whose families remain in neighborhoods where gentrification is occurring. This part of their design addresses the possibility that observed changes in student achievement might be the result of newly arrived students of gentrifying families rather than the students who were there before the change. Additionally, Keels et al (2013) were able to observe the relationship between neighborhood change and student achievement over the span of decades. Due to the fact that my main source, the Census Bureau, did not maintain demographic data on similarly granular geographic levels and did not maintain annual data consistently (the American Community Survey, which provides yearly data just started in 2005), this thesis was limited to county-level observations for seven years. Furthermore, of the 63 counties in the state, only 39 counties had yearly demographic data.
surrounding gentrifiers. This uncertainty exists for all of variables I used to measure gentrification as there is no way to make this distinction in the design of my data or models of statistical analysis.
While these data constraints presented limitations in certain ways, it also led to the creation of a statewide data set that can be used for future study involving these variables. Also the decision to use county-level data for seven years allowed for a larger, less biased data set than would have been possible if I had attempted to use neighborhoods and census tracts as my level of analysis. In order to address these limitations, this thesis could be continued for at least another three years using data from the American Community Survey to capture the relationship between gentrification and student achievement over ten years.
Policy Implications
References
Amrein-Beardsley, A. (2012). Methodological Concerns about the Education Value-Added Assessment System. Educational Researcher (Vol. 37). Retrieved from
http://www.jstor.org/stable/30137966
Atkinson, R. (2000). The hidden costs of gentrification: Displacement in central London. Journal of Housing and the Built Environment, (Vol. 15). Retrieved from
http://www.jstor.org/stable/41107148
Bates, L. (2013). Gentrifcation and Displacement Study: implementing an equitable inclusive development strategy in the context of gentrification (Doctoral dissertation). Retrieved from https://www.portlandoregon.gov/bps/article/454027
Baxter, H. (2009). Toward a theory of gentrification (Doctoral dissertation). Retrieved from OhioLINK (447)
Billingham, C. M., (2013). The state, the school, and the family in the gentrification of the American city (Doctoral dissertation). Retrieved from IRis (20)
Bonk W. et al (2012). Growth Models: Issues and Advice from the States. Retrieved from
http://nces.ed.gov/programs/slds/pdf/guide_growth-model.pdf
DeSena, J. N. (2009). Gentrification and inequality in Brooklyn : the new kids on the block. Lanham, MD: Lexington Books.
DeSena, J. N., & Ansalone, G. (2009). Gentrification, Schooling and Social Inequality. Educational Research Quarterly, 33(1), 60-74.
Danyluk M. & Ley D. (2006). Modalities of the New Middle Class: Ideology and Behaviour in the Journey to Work from Gentrified Neighborhoods in Canada. Urban Studies
Journal Foundation (Vol. 44). Retrieved from
http://usj.sagepub.com/content/44/11/2195.full.pdf+html
Well-Being: Tipping the Scales from Problems to Promise. American Journal of Community Psychology (Vol. 10). Retrieved from
http://link.springer.com/article/10.1007/s10464-010-9348-3/fulltext.html
Glass, R. (1964). London: Aspects of Change. London: MacGibbon & Kee.
Glick, J. (2008). Gentrification and the Racialized Geography of Home Equity. Urban Affairs Review (Vol. 44). Retrieved from http://uar.sagepub.com/content/44/2/280.full.pdf+html
Hwang, J. (2014) How “gentrification” in American cities maintains racial inequality and segregation: Research brief. Retrieved from
http://www.scholarsstrategynetwork.org/sites/default/files/ssn_key_findings_hwang_on_ how_widespread_gentrification_maintains_racial_inequality_and_segregation_2.pdf
Keels, M., Burdick-Will, J. and Keene, S. (2013). The Effects of Gentrification on Neighborhood Public Schools. City & Community, 12: 238–259.
doi: 10.1111/cico.12027
Kozak, S. (2014). From Section 8 to Starbucks: The Effects of Gentrification on Affordable Housing in Pittsburgh, Pennsylvania (Doctoral dissertation). Retrieved from
kuscholarworks.ku.edu/.../1/Kozak_ku_0099D_13316_DATA_1.pdf
Lees, L. (2012). Gentrification. In Andrew T. Carswell (Ed.), The encyclopedia of housing. (2nd ed., pp. 241-244). Thousand Oaks, CA: SAGE Publications, Inc. doi:
http://dx.doi.org/10.4135/9781452218380.n82
Scott J. & Miller J. (2012). Understanding the Basics of Measuring Student Achievement. Retrieved from http://cecr.ed.gov/pdfs/Understanding_Basics.pdf