ZACHARY T. KELLEHER. The cloning of the Fanconi's anemia gene. (Under
the direction of Dr. Jean-Michel Vos).
The aim of this project was to pinpoint the location and ultimately the
gene code of one of at least four possible genes of Fanconi's anemia, a
human "DNA repair" disorder. In the first part of the study,
microcell-mediated chromosome transfer, an estabUshed procedure, was used to
transfer a normal tagged human chromosome #20 (the reputed location of
the FA-A gene, carried in an A9 mouse cell line) into FA-group A
lymphoblasts and fibroblasts at which point they would be tested to see if
the uptake of this chromosome corrects two prominent manifestations of
the FA defect, namely its inherent chromosomal instability and its
hypersensitivity to DNA cross-hnking agents. Success in this venture was
elusive.In the second part of the study, the first steps of a proven method of
gene cloning was tried involving first, the transfection of a cDNA library,
carried in an Epstein-Barr virus (EBV) vector into an FA-group B cell line,
and then pulUng out the FA-B gene from these cells by treating them with
DNA cross-linking agents and selecting for ones which have lost this
hypersensitivity. Three different methods of transfection, electroporation,
lipofection and endocytosis-fection, were tested to discover which was the
most efficient at transferring plasmid DNA into the FA group B cells. This
group, which is one of the most sensitive of the four known FA cell lines,
was transfected, in transient assays, most efficientiy via
endocytosis-fection. However, the attempt to select for long term maintenance of
plasmid DNA was unsuccessful for FA-B cells using any of the transfection
methods. However, successful maintenance of the cDNA-containing plasmid
by FA-A lymphoblasts was obtained. Modifications are being made to
circumvent the problem with the former cell line while work continues to
m
ACKNOWLEDGMENTS
I would first like to thank my parents, my first teachers, for their patience,
support and guidance throughout the years. I would like to acknowledge as
well all of my brothers and sisters, including Kathy, Jim, Terry, Frank, Joe, Zoe
and Michael who, without exception, have taught me a great deal through
who they are and in their kindness and support. I am especially indebted to
my sister Kathy and brother-in-law Mark, who have enriched my life in
innumerable ways, and whose support, both financial and otherwise, 1 could
not have done without. I have many fond memories of my many travels to
Pikeville, Ky. 1 am also deeply indebted to my sister Terry, a primary teacher
in my life who helped open my mind to the world and whose care and
attention as a child, invaluable to my growth and development, I will never
forget nor fully be able to appreciate. I also want to thank my brothers Frank
and Joe and my sister Zoe for their moral and financial support and for
continuing to welcome me into their homes. I am appreciative to my
roommate John for his friendship as well and for the friendship of Robert,
Mare, Martha and Chris, who have been blessings to my life. I would like to
thank Mrs. Sally Knight for her kindness and support.
I would like to thank Dr. Jean-Michel Vos for his patience, support and
guidance throughout my tenure in his lab. I am also grateful to my fellow
TABLE OF CONTENTS
Page
ACKNOWLEDGMENTS... iii
LIST OF TABLES... vi
LIST OF FIGURES... vii
CHAPTER I: INTRODUCTION... 1
CHAPTER II LITERATURE REVIEW... 4
Fanconi's Anemia... 4
What is Fanconi's Anemia?... 4
What are the Primary Characteristics of FA cells?... 5
What is the nature of the FA defect... 7
Cloning of the FA gene... 8
Reasons for Cloning the FA gene... 8
Project 1-Confirming the Putative location of the FA-A gene.. 9
Justification... 9
Approach... 10
Project 2- Cloning the FA-B gene... 12
Justification... 12
Approach... 13
Why FA-B... 13
Obtaining a cDNA hbrary... 14
Transfection methods... 14
Experimental plan... 16
CHAPTER III; MATERIALS AND METHODS... 19
Materials and Cell culture... 19
Methods... 20
Project 1: MMCT procedure... 20
Project 2:... 25
Plasmids and plasmid preps... 26
Transfection methods... 26
Electroporation... 26
Lipofection... 26
Endocytosis-fection... 27
B - gal Assay... 31
Sensitivity analysis of selecting agents:... 32
Hygromycin B... 32
Mitomycin C... 33
Psoralen and UVA light... 33
Selection Protocol... 33
CHAPTER IV- RESULTS AND DISCUSSION-PROJECT ONE... 35
Experimental results... 35
Discussion... 37
CHAPTER V. CONCLUSIONS AND RECOMMENDATIONS-PROJECT 1:____ 40
CHAPTER VI- RESULTS AND DISCUSSION-PROJECT 2:... 42
Transfection results:... 42
Electroporation... 42
Transient results... 42
Stable transformation results... 46
lipofection... 46
Transient results... 46
Stable transformation results... 50
Endocytosis-fection... 51
Transient expression... 51
Test One... 51
Test Two... 55
Stable transformation:... 59
Sensitivity analysis:... 62
Hygromycin B... 62
Mitomycin C... 62
Psoralen and UVA light... 62
Discussion... 66
CHAPTER VII. CONCLUSIONS AND RECOMMENDATION-PROJECT TWO: . . 70
LIST OF TABLES
Tabig Eag£
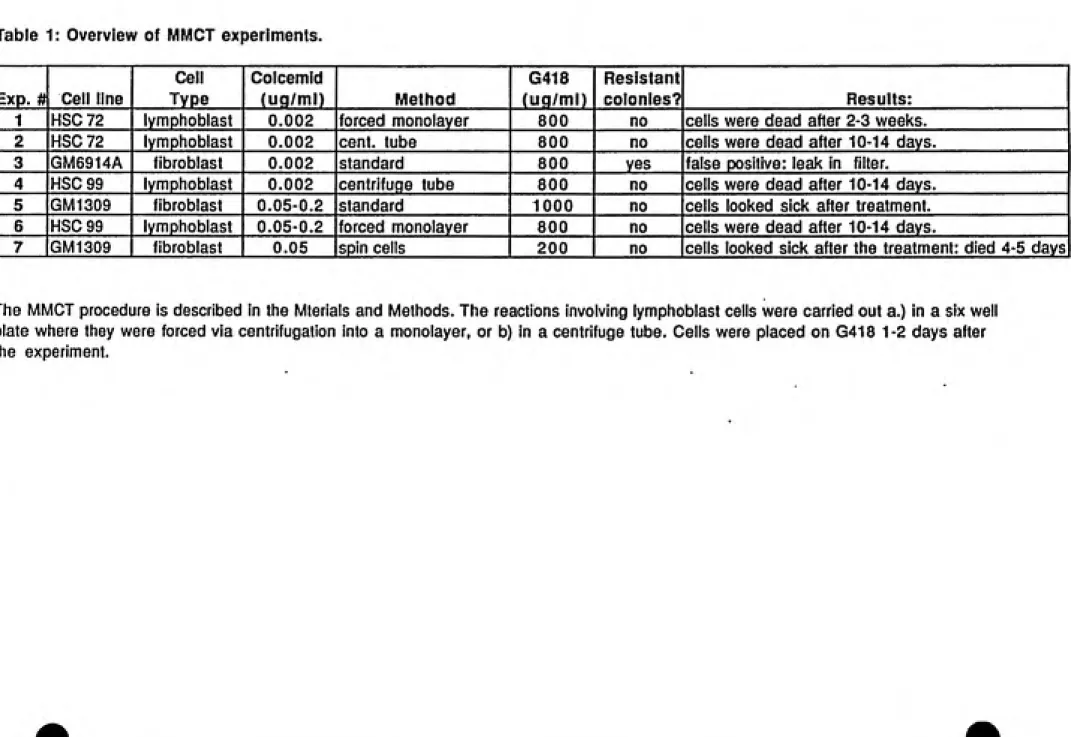
1. Overview of MMCT experiments...36
2. Relative lacZ expression in FA-B cells transfected
via electroporation... 43
3. LacZ gene expression in FA lymphoblasts transfected
by electroporation... 45
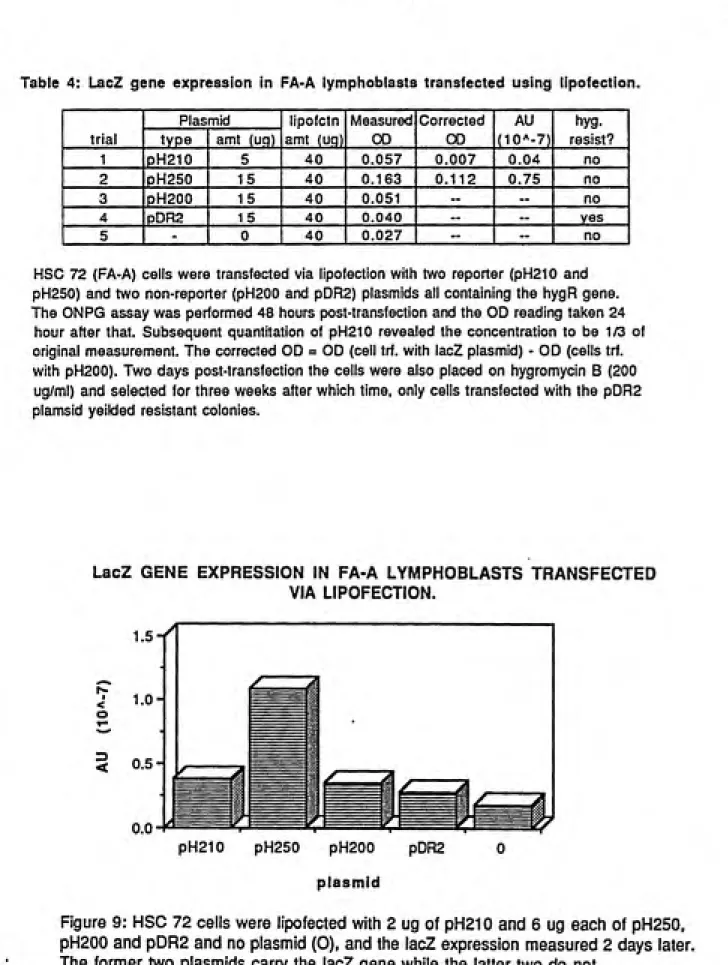
4. LacZ gene expression in FA-A lymphoblasts
transfected using lipofection... 47
5. LacZ gene expression in FA-B lymphoblasts
transfected by lipofection... 48
6. Effect of desferrin on growth of FA-B lymphoblasts... 53
7. LacZ gene expression in FA-B lymphoblasts
transfected via endocytosis-fection... 54
8. lacZ gene expression in FA-B lymphoblasts
transfected via endocytosis-fection: Test #2... 56
9. Effect of endocytosis-fection treatment on
HSC 230 ceU growth; Test #2... 58
vu
LIST OF FTGURFS
Figure Page
1. Excision Repair in procaryotes... 2
2. Microcell-mediated chromosome transfer... 11
3. The cloning scheme of the FA-B gene... 18
4. Mini-EBV expression vectors... 21
5. pDR2 EBV-based cDNA Ubrary... 22
6 Construction of the Adenovirus-DNA complex... 29
7. Mechanisms of the endocytosis-fection method of transfection... 30
8. LacZ expression in 3 FA lymphoblasts transfected via electroporation . 45
9. LacZ expression in FA-A lymphoblasts transfected via lipofection ... 47
10. LacZ expression in FA-B lymphoblasts transfected via lipofection ... 49
11. Relative lacZ expression in FA and XP lymphoblasts using
endocytosis-fection: Test #1... 54
12. Transfection efficiency of FA-B lymphoblasts using
endocytosis-fection: Test #2... 57
13. Effect of endocytosis-fection on growth of FA-B lymphoblasts.... 58
14. Selection of hygromycin resistant FA-B lymphoblasts
transfected via endocytosis-fection... 60
15. Sensitivity of FA-B lymphoblasts to hygromycin... 63
16. Sensitivity of FA lymphoblasts to DNA cross-linking agents... 65
The integrity of the genetic material of all living cells is constantly being
challenged by "outside" environmental agents such as heat, radiation or
mutagenic compounds, by DNA modifiers generated by cellular metabolism
and by the inherent chemical instability of DNA. Alterations in the genetic
material could, if left uncorrected, be deleterious to the cell by affecting
the replication process, in the case of cross-links between DNA strands, or
by altering important genes, by either the insertion, deletion or
substitution of base pairs within the genome. Fortunately, cells have
developed elaborate and efficient methods of repairing altered or damaged
DNA to combat the daily onslaught of harmful agents.
Out of the many repair systems, the most classic is "excision repair"
which involves a number of factors acting cooperatively to restore altered
DNA to its undamaged form. These factors must perform a number of
functions including recognizing the damaged DNA, binding to the lesion,
"nicking" or cutting the DNA backbone around the lesion, excising or
removing the nucleotides between the nicks, replacing the nucleotides, and
finally ligating the newly synthesized DNA to the old (figure 1). At the
present time this system is best characterized in procaryotes, especially in
the UvrABC repair in the bacteria Eschericia coli. where many of the DNA
repair genes have been identified and cloned (38).
While excision repair can be used to repair damage to one strand of
DNA, more complicated mechanisms, such as bypass repair and recom¬
bination, must be used to repair damage involving both strands. For this
type of damage, the DNA lesions are bypassed during replication and then,
via recombination with the homologous strand of DNA (which acts as the
new template), restored to its original form. Though the basic mechanisms
of excision repair, such as the recognition and replacement of the damage,
as well as the resynthesis of new DNA, are involved in interstrand
cross-link repair in eucaryotes, the exact mechanisms of repair as well as
the many components involved in it remains poorly characterized(57;.
HGURE 1: DNA EXCISION REPAIR IN PROCARYOTES
P'athway tor any damage
vs k><AV-| ^vssj>- oCl,9v, ͣ^<X
Q!^ 0 Qc? O Q<? Q a<? Q
Base is
damaged
i
Q ^ Q Q t? Q q (? Q q <^ q
incision Endonuciease cuts
on Doth sides
damaged base
i
q(^ QQ(^ q q<^q q<^ q
Excision
Exonuclease removes stretch of DNA
i
d^ qq^ q q^ q q<? q
^
Polymerase synthesizes
new DNA
i
q<^qq<^qq<^qq(^q
Ligase
seals nick
i
Figure 19.8
Excision-repair removes and replaces a stretch of DNA that includes the damaged base($). R/ght. The general pathway for
repair in £. coW involves cutting on both sides of the damaged base, followed by excision.
involved in repair in eucaryotes have come in the study of yeast where many radiation inducible genes (RAD) have been found (55).
Further study on a cellular process as crucial and yet as poorly
understood as DNA repair is imperative for a number of reasons, many of
which are elucidated by Vos (57). With the increase in potential DNA damaging agents being released into the environment each year it is especially important to know how these agents are affecting living
organisms on a cellular level and how these effects are handled by the cells of the organism. This knowledge could potentially affect treatment of those exposed to these harmful agents as well as on the manner in which these agents are released into the environment. It can also help to
delineate the role of repair in the complex and pathogenic multicellular processes such as cancer and aging.
Fanconi's anemia (FA) is a recessive, inherited genetic disease which has been characterized as a "repair disorder" along with other defects such as
Xeroderma Pigmentosum (XP), Ataxia telangiectasia, (AT), Bloom's
syndrome (BS), and Cockayne's syndrome (CS). The fact that it is inherited makes it a stable system in which to study DNA repair. The exact
CHAPTER II: LITERATURE REVIEW Fanconi's Anemia.
What is Fanconi's Anemia?
Fanconi's anemia (FA) is a rare autosomal recessive disorder which is
characterized by some or many of the following: a predisposition to acute myelegenous leukemia and other malignancies, bone marrow failure,
congenital abnormalities which include skeletal deformities such as
absence of thumb and radii, intrauterine growth retardation, short stature,
hyper pigmentation and pancytopenia (18, 24, 49).
Cells from persons with FA are characterized by a higher than normal
rate of spontaneous and induced level of chromosomal breaks, a
hypersensitivity to DNA cross-linking agents, an increased sensitivity to oxygen and a perturbed cell cycle (3, 27, 29, 46). The manifestations of
any of these defects varies widely between patients both clinically, with
differences in the incidence, type, onset and severity of the malformations,
and biochemically, with wide variations in sensitivities to DNA damaging agents and level of chromosomal aberrations. There has of yet been no
correlation found between the severity of the clinical symptoms and cellular deficiencies (4).
This extreme heterogeneity of FA symptoms is a factor which must be
considered whenever analyzing data of this disorder. It also may indicate that the FA defect is a complicated one, involving more that just DNA
repair. At present it is believed that there are at least four different genes or gene parts which are responsible for the FA defect. Through
complementation studies, four different complementation groups of FA
cells have been established, labeled, respectively, A-D (15, 52).
(Complementation groups are determined by fusing cells from different FA patients via somatic cell fusion and checking the cross-linking sensitivity of the subsequent products. If there were only one gene responsible for the FA defect then the hypersensitivity of the fused cell line would be
5
because each line would contribute two defective FA genes. However, when cells from certain FA patients are fused, the subsequent sensitivity
of the resulting cell line is similar to that of normal cells, indicating that a correction of the defect has taken place. This could be explained if there
were more than one defective gene or gene part involved. The defective
gene of one cell line is masked by a normal copy of that same gene or gene part contributed by the second cell line and vise versa. Cells in this latter category are said to be in different complementation groups since they complement each other and apparently contain different mutations. Cells
belonging to the former category are said to be in the same
complementation group since they cannot complement each other and
therefore share the same defect.
What are the primary characteristics of FA cells?
Though there is wide variation in the phenotype between FA cells there are certain characteristics that are consistently found among them. In trying to determine how best the gene might be cloned, the most salient
features of the defect have been examined. These characteristics can
ultimately be exploited to uncover the nature of the FA impairment and
the mutated genetic code which underlies it.
There are five primary manifestation of the FA defect on the cellular
level. The first and one of the most obvious is the increased rate of
spontaneous chromosomal aberrations (CA). These were first characterized by Schroeder in 1967 and have since been described by numerous other
researchers (8, 15, 43, 56). The types of aberrations seen most often are
chromatid gaps and breaks though the level of sister chromatid exchange
(SCE) has been shown normal in FA cells (35, 36).
The extent of spontaneous CAs varies between the cells of different
patients as well as in cells from the same patient over time (8, 49). Additionally, the CA rate varies among cells in the different
complementation groups with FA-B cells demonstrating a higher rate of spontaneous breakage than either FA-A or FA-D cells. FA-C cells, one of
the newest FA cells lines has yet to be characterized for spontaneous or
induced chromosomal breakage (13, 15, 16).
The second is that FA cells have an increased rate of induced
6
exposed to DNA cross-linking agents. This is in contrast to normal cells
which show no such characteristic increase when treated with similar
doses. This induced rate of chromosome breakage in FA cells is one of the most consistent features of the disease and indeed, it is used as the pre¬
eminent characteristic in the diagnosis of the disorder (4, 8, 15, 16, 43, 56).
The third most salient feature of the FA defect is the sensitivity of FA cells to DNA cross-linking agents. Cross-linking agents are compounds
which can intercalate into DNA, covalently linking either two adjacent base pairs (intra-strand cross-links) or two base pairs on opposite strands
(inter-strand cross-links). In the process of characterizing the FA defect,
cells from FA patients have been treated with a number of different
DNA-damaging chemicals such as mitomycin C (MMC), diepoxybutane (DEB),
psoralen and UVA light (PUVA), cis-diamine-dichloro-platinum II (cis-Pt
(II)), other mono- and polyfunctional alkylating agents, nitrogen mustard,
and ionizing radiation (3, 7, 16, 27, 43, 46). The majority of these studies
have found that FA cells have a deficiency in the repairing the damage
caused by those compounds which form DNA cross-links, though there are
studies which dispute this (19, 32, 42). These latter studies might be
explained by the extreme heterogeneity that exists between the various
FA complementation groups, which were not characterized in the reports
sited. Indeed, the FA-D group, represented by the cell line HSC 62 and
most likely FA-145, has been shown to be only slightly more sensitive to
cross-linking agents than are normal cells both in the repair of these cross¬ links (40) and survival after DNA cross-linking treatment (16, 27, 41, 60).
Additionally, different cross-linking agents work by different
mechanisms and may require different repair pathways. Thus, the extent
of cross-linking sensitivity may vary depending on the agent used. It has been observed that FA cells are more sensitive to PUVA than to MMC by
an order of magnitude based on the EC 10, the effective concentration of
cross-linking agent which inhibits growth to 10% of normal, when
comparing the difference in sensitivities between normal and FA cells. FA
cells treated with MMC are 1-11 times more sensitive than normal cells
while with PUVA the difference is 15-110 times (personal data). It is
known that PUVA interacts primarily with pyrymidines whereas MMC
(and nitrogen mustard) form cross-links between purines, specifically on
7
cells do have the ability to repair DNA cross-links, they do so at a lower efficiency than normal cells (27, 40, 41). This defect in cross-link repair
along with the genetic instability are the strongest evidence that FA as a
DNA repair disorder.
The fourth defect manifest in FA cells is their sensitivity to oxygen. Joenje and colleagues have shown conclusively that the level of
chromosomal aberrations in FA cells is dependent on the level of oxygen in
the ambient environment. When FA cells were exposed to reduced levels
of oxygen (0,0-5.0%) a decrease in the level of breaks was observed.
Conversely, when these cells were placed in an environment with an
increased level of oxygen compared to normal levels, an increase of
chromosomal breaks was observed (29, 30). This has lead some to propose
that the primary defect in the FA disorder is not, as generally believed, a
defect in the DNA repair system but rather a deficiency in the cells ability
to detoxify reactive oxygen species (29, 30, 31).
Finally, FA cells have disturbed cell cycle manifest in a prolonged S and
G2 phase. Weksberg et al. (1979) have found that the increased doubling
time in FA cells is due to an increased generation time as well as a higher
rate of cell death. Dutrillaux (1982) found that it took FA cells on average
32-40 hours to pass through one full cycle, while the time for normal cells
was 28 hours (17, 47, 60).
What is the nature of the FA defect?
Aside from the clinical aspects of the disease, the primary focus,
biochemically, on the FA disorder has been on the defect in repair, though,
as mentioned, this is not the only defect in this syndrome. While it has
been conclusively demonstrated that FA cells are slower in their
repair of interstrand cross-links and have a higher rate of chromosomal
breakage compared to normal cells, the exact mechanism of this process
has yet to be fully elucidated though a few theories have been proposed
which find experimental support. There has been growing evidence that
the defect in repair in FA cells involves the first incision step of the cross¬
link repair process, more specifically, that there is an alteration in one of
the endonucleases which perform the initial incision step, retarding its
ability to do its job (21, 22, 25, 34, 41, 44). Sakaguchi et al. (1992),
8
to FA cells in its sensitivity to cross-linking agents and its high level of
spontaneous chromosomal aberrations, has a mutation which results in an defective endonuclease. More specifically, Lambert et al. (1992) have isolated modified endonucleases from both FA-A and FA-D cells (the latter which they refer to as FA-B). The defective endonuclease in FA-A cells recognizes psoralen intercalation's and interstrand cross-links and takes part in the initial incision step of the repair process. In their studies, it exhibited 25% the activity of the normal endonuclease. The altered nuclease in the FA-D cells recognizes psoralen monoadducts and has approximately 50% of the activity of the normal endonuclease. These
findings were later strengthened when the defects in each of these FA
groups was corrected with the insertion of the respective normal
endonuclease (34, 44). These finding confirm earlier studies which found
FA-A cells to be defective in the first incision step of the cross-link repair
process and that FA-D cells have a defect in the repair of monoadducts formed by psoralen and UVA light (6, 41, respectively).
Though an altered endonuclease may be responsible for the diminished
repair capacity in FA cells, it does not necessarily follow that the mutated FA gene(s) codes for such an enzyme. Such an claim would fail to account
for the observed oxygen sensitivity and cell cycle disturbance of FA cells.
At present, no explanation has been proffered nor empirical evidence found which might adequately account for the all of the known FA defects. This may indicate that the mutated gene responsible for the FA defect codes for a multipurpose enzyme and not just an enzyme involved in DNA
repair.
CLONING THE FA GENE
Reasons for cloning the FA gene.
Their are two basic routes that can be used to uncover the FA defect,
namely the biochemical approach, which focuses on the actual mechanisms
of a system and the components involved therein, as was used by Lambert et al, (1992) and Sagaguchi et al. (1992) who examined the modified
endonucleases in FA or "FA-like" cells, or the genetic approach, which tries to uncover the code of the mutated gene responsible for the disorder, like Strathdee et al. (1992) who have successfully cloned the FA-group C gene.
The genetic approach has the advantage of ultimately discovering the code of the mutated gene which may lead to the discovery of the
biochemical mechanisms of the gene product, though finding the gene doesn't guarantee discovering the defective protein. However, if the gene is cloned, its homology to any other known gene can be checked. If it shares homology with other characterized genes, the information on these
genes might help to further uncover the nature of the FA defect and what
role repair plays in it. Or, as in the case of the FA-C gene, it could turn out
to be novel or uncharacterized, in which case the discovery of the protein
and mechanism of action may be even more valuable.
A second advantage to discovering the code of the FA gene is for its
potential use in gene therapy. If a normal copy of the FA gene could be
delivered to certain target cells in the body of a FA patient, as in systems
which are now being developed in cystic fibrosis and other diseases, this
would be an enormous benefit to those people with the disease who now
can rely solely on bone marrow transplants for the treatment of the
disease. There are indeed systems like this being developed at the present
time(54).
A third advantage of using the genetic approach is that once the gene is
found, it can be used, in the case of the FA gene, for more sensitive
diagnosis of the disease. Though the present assays, based on sensitivities of the cells of FA patients to DEB, are adequate in diagnosing FA, more
precise determinations could be made if the gene was known.
There are two parts to this project; The goal of the first part is to
confirm the assignment of the FA-A gene to normal human chromosome
(HC) #20 by means of microcell mediated chromosome transfer (MMCT).
The successful completion of this goal would eliminate a large portion of
the human genome from consideration as a site for this gene, which stand
10
Project I: Confirming the putative location of the FA-A gene.
Justification
In looking for effective methods in uncovering the location of the FA
gene, one strategy is to examine the paths taken by those exploring other
"DNA repair disorders" such as Xeroderma Pigmentosum (XP), Ataxia telangiectasia (AT), Bloom's Syndrome (BS), or Cockayne's Syndrome (CS),
some of which are farther along in the cloning of the respective genes (1).
There are three key studies involving other "DNA repair" disorders
which provided the basis for this project. In the attempt to find the
chromosomal location of an AT gene, Gatti et al. (1988) performed a
genetic linkage analysis in 31 families with AT group D (AT-D) affected
individuals. From this study they estimated the AT-D gene to be on
chromosome 11 q22-23 (23). Following this study, Komatsu (1990)
inserted a normal human chromosome 11 (HC 11) into AT-D cells via MMCT and achieved correction of the defect, thus confirming the previous study (33). In earlier studies, the MMCT procedure was also used to
correct the XP-A defect by insertion of a normal, however, transposed
human chromosome (50).
As with the Gatti study, Mann et al., (1991) performed a genetic linkage
study on 34 families which had members affected with FA and estimated
that the FA-A gene is located on HC 20q (39). The next step in uncovering
the chromosomal location of the FA-A gene, following the path taken with
the AT-D research, was to insert HC 20 into FA-A cells to determine if
correction takes place.
Approach
To test the hypothesis that the FA-A gene resides on HC20, MMCT was
used to transfer HC20 into FA-A cells. MMCT is an established method of
chromosome transfer and is used often to transfer human chromosomes
into rodent cell backgrounds or visa versa for the purpose of gene
complementation and for chromosome mapping {20, 45, 48, 59). In the
MMCT procedure, microcells, or enucleated sacs containing various
Donor Cells Recipient cells
i
i
A9 mouse cells with normal
human chromsome #20 tagged for neomycin resistance Expose to colcemid
for 48 hours
Blocked in mitosis,
microcells form.
Place cells in cytochalasin B. Spin at 12K for 1 hour.
FA-A cell line. Both # 20
chromosomes have recessive
FA genes.
Microcells break free of cell
membrane, pellet out.
8u
Su
3u V
V
Purify microcells by gently pushing them, in a syringe, through a filter stack with 8, 5 and 3 um pore size
filters. Collect in 15 ml tube.
PH
'^^'v /-f
Mix purified microcells withPHA and add to FA cells.
Remove PHA and add PEG to fuse
microcells and FA cells.
\
PEG
Wash with
media-Resistant cell line should have
three #20 chromosomes; 2 of which should have defective FA
genes and one which should carry the normal complement to that gene.
Wash FA ceils with
unsupplemented media. N/
©
I
^
G418Wash cells in media.
Add G418 (neomycin) to select
for FA cells which recieved
chromosome #20.
©)(©
^
12
agent, such as colcemid, to the cells for an extended period of time (24-72
hours, see figure 2). These micronuclei are then collected by first placing
the cells in a solution of cytochalasin B, an agent which destabalizes the
microtubules, causing a loosening of the cell membranes, then spinning them at a high velocity whereby the microcells escape the confines of the
cell membrane and pellet out.
The microcells are purified via filtration then transfected into a given
cell line by first treating them along with the recipient cells with
phytohemoglutinin (PHA) which helps the microcells to attach to the
recipient cells, and then with polyethylene glycol (PEG) which weakens the
cellular membrane and allows the microcells and their contents to be taken
up by the cells. There is usually a selectable marker, such as a hygromycin
or neomycin resistance gene, on the inserted human chromosome. This
allows for the selection of cells which take-up this chromosome. In this
experiment, a mouse cell line containing a single human chromosome (#20)
tagged for neomycin resistance, was used as the donor cell line to be fused
to one of four different cell lines characterized as belonging to FA group A,
Once this was successfully completed, the next step would be to test the
cells for correction of the FA defect by observing the spontaneous and
induced levels of chromosomal breakage as well as the cross-link sensitivity of the new cell line. Correction of both of these parameters
would be a positive indication that the FA-A gene was on HC 20.
Correction of only one of these parameters, a partial complementation,
would indicate, among other things, that part of the FA gene was missing
from the inserted chromosome or that there was an overexpression of a
protein which compensates for the one defective in the FA system. A
failure to achieve correction in either of these two parameters might
indicate that the FA-A gene is located on another chromosome though this
result might also be observed if the gene was masked or altered or had
become disassociated from the marker.
Project Two: The Cloning of the FA-B Gene
The scope of the second project was wider and more involved than that
of the first. In this project the objective was to recover and characterize
an FA gene, rather than the merely determine the its chromosomal
Justification:
Over the past decade there have been numerous attempts to clone the
FA gene(s) and many methods using a variety of DNA types have been
used, ranging from transfecting FA cells with wild type genomic DNA (10),
injection of HeLa mRNA into FA cells (14), transfecting total mouse
genomic DNA (13), and by studying non-human systems which carry
defects analogous to FA such as with the Chinese hamster mutant V-H4 (2, 44). However, none of these studies were able to uncover an FA gene. Recently though, the FA-C gene was cloned using a novel method of transferring a cDNA expression library using the Epstein-Barr virus as a
vector, into a FA-C lymphoblastoid population and selecting out the
plasmid which corrects the FA sensitivity to DNA cross-linking agents.
This method, with minor variations, serves a the basis for the cloning of
the FA-B gene (52, 53).
The cloning strategy used by Strathdee et al. (1992) has a number of
advantages to the other methods sited. The most important of which
involves the use of the mini-Epstein-Barr virus (EBV) as a vector to insert
cDNA into cells. The mini-EBV contains only the essential genes needed for
its maintenance inside a cell line and is only a fraction of the size of the normal EBV (10-20 kb compared to approximately 170 kb), making it small enough to efficiently transfect into cells using standard methods of
transfection. Unlike most plasmids, the mini-EBV (as well as the EBV) can
be maintained as an episome inside mammalian cells as long as it is in the
presence of the protein EBNA-1 and contains the origin of replication (oriP)
driven by a promotor. Episomal plasmids can then be easily recovered using standard laboratory techniques(52j in contrast to linear plasmids
which are integrated into the genome and thus are more difficult to pull
out. Linear plasmids, when integrated, may also disrupt the expression of
crucial genes required for the proper functioning of the cell, especially if it
is randomly integrated. Upon integration, plasmids may also be
rearranged or altered (53). Once retrieved, episomal plasmids can then be
isolated and amplified by shuffling them into bacteria. The cDNA
14
Approach
Choosing the cell line. Why FA-B.
At the start of the study, three complementation groups remained to be
cloned, FA groups A, B and D, with group C being cloned earlier by
Strathdee et al., 1992 (53). The cloning of FA group D was rejected
because it is the least sensitive of the four FA cell lines to cross-linking
agents, making it difficult to differentiate when the cell line has been corrected and one of the only known FA-D cell lines, HSC 62, alymphoblastoid cell line, has a doubling time of approximately twice that
of the other FA cell lines (personal data).FA group A was not totally ruled out though it is known that more than
one other laboratory is pursuing the cloning of this gene. FA group B was
then chosen based on these and other reasons, one of which is that, unlike
FA-D cells, it has a cross-link sensitivity (based on the EC 10) 10-100 times
greater than normal cells, depending on the agent used. This makes it
easier, for selection purposes, to differentiate between corrected and
uncorrected cells. It is, next to FA-C cells, the most sensitive of the
remaining complementation groups (personal data, 52, 53). FA-B cells were shown as well to have the highest rate of spontaneous and induced
chromosomal aberrations than either FA-A or FA-D cells (15, 16).
Obtaining a cDNA library.
There were two ways to acquire a complementary DNA (cDNA) library.
The first was to construct one by collecting the total messenger RNA
(mRNA) of a normal cell line and then synthesizing the complementary
strand of each mRNA segment. In this way, the coding sequence for each
gene that is expressed in the cell can be collected. These segments of cDNA
can then be inserted in an mini-EBV vector, with each plasmid taking up
one piece of cDNA. So in a large number of mini-EBV vectors, a whole
cDNA library can be constructed. The other option was to purchase a cDNA
library that was commercially manufactured. For the sake of time, the latter option was chosen.
Transfection Methods
Once a cDNA library, contained in an EBV shuttle vector, was obtained
plasmid DNA into the cells. Enough cells must take-up the plasmid to insure that the entire library is expressed. The most common way to
transfer plasmid DNA into cells is by transfection and in this project three
different transfection methods were employed; electroporation, lipofection
and endocytosis-fection.
Electroporation is a common method to fuse cells and to insert pieces of
DNA into cells. Media containing cells and the DNA are placed into a small
cuvette or chamber with a metal plate on two opposing sides. The
chamber or cuvette is placed in an electric field, with a positive charge on
one plate and negative on the other, where it receives an electrical current
of a given voltage and capacitance for a short duration. During the passage
of an electrical current, all negatively charged particles in the chamber will
migrate to the positive charged plate. The speed of the migration depends
on the mass of the particles with the smaller particles, such as the
negatively charged plasmids, migrating at a much greater speed than the
more massive cells. Thus the plasmid DNA "shoots" through the cells like a
bullet, remaining in a certain portion.
Lipofection is a method of transfecting DNA by joining the negatively
charged DNA with the cationic liposome mixture. The DNA-liposome
complex fuses easily with mammalian cell membranes where it is taken up
by the cell.
Endocytosis-fection is a relatively new system of transfection involving
the association of DNA with adenovirus and the ligand transferrin, two
components which have receptors on the membrane of most cells, and adding this complex to cells where it binds to receptors on the cell surface.
Once attached to the membrane, the DNA complex is efficiently taken up
by the cell via endocytosis. Inside the cell, a component of the adenovirus,
thought to be the capsid protein, induces a drop in the pH which disrupts
the endocytotic membrane, allowing any DNA associated with it to escape
and sparing it from degradation by the endocytotic enzymes. The DNA is
then free to migrate to the nucleus (11, 12, 58).
This system has been found to be extremely efficient for transfecting
DNA into mammalian cells, up to 100% in some cell lines (11, 58). There
has of yet been no reports of the successful use of this method to stably
transfect plasmid DNA, possibly indicating a problem in doing so. Indeed
16
the cells either because it is not totally replication-defective or because it
becomes replication-competent via recombination with endogenous virus's
in the host cell. It has also been postulated that a component of the virus, the penton protein of the capsid, is toxic to mammalian cells (9, 12).
Experimental Plan.
Once the best transfection method has been found and an EBV-cDNA
shuttle vector and FA cell line been obtained, then an entire cDNA library
must be inserted into an FA cell population. The number of genes in the human genome has been estimated to be 1.0 x lO^. Therefor at least this
many cells must be successfully transfected in order to insure that a majority of the library is expressed in the cells. To greatly increase the
chances of having the entire library expressed and in high enough
numbers to pull out the FA gene, at least ten times that amount or 10^
clones should be obtained. Since the plasmid has a gene conferring
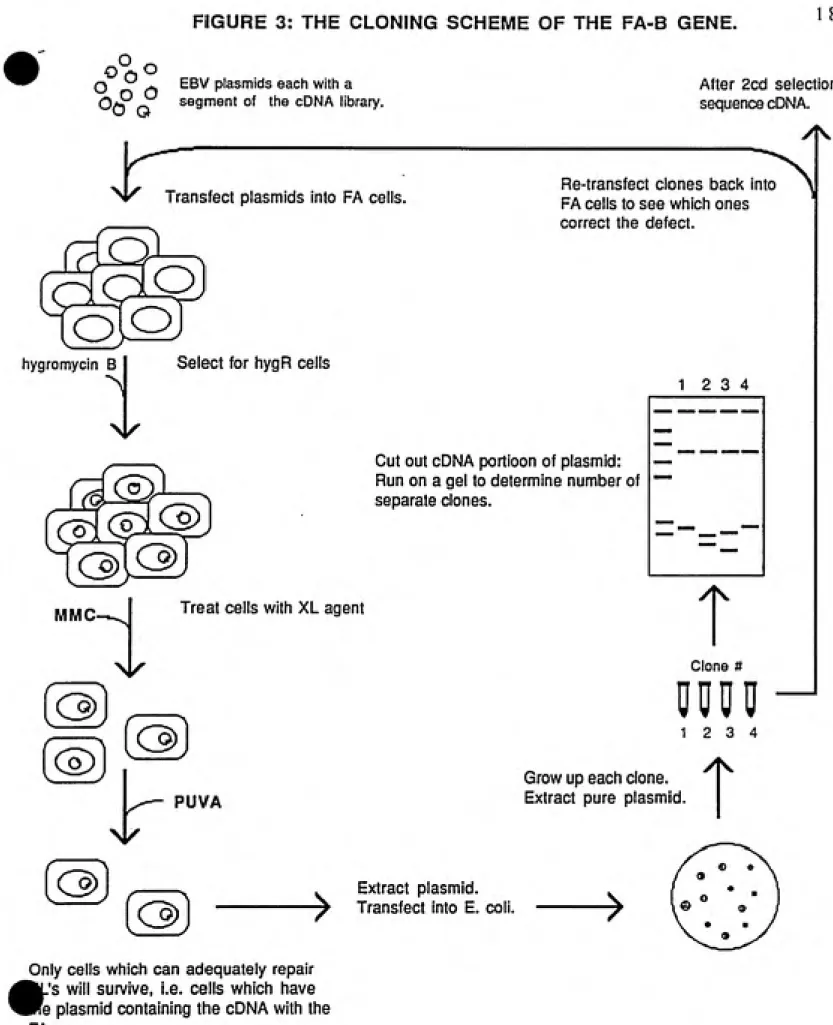
hygromycin resistance, the cells which take-up the plasmid can be selected by treating with hygromycin B and pulling out the survivors. Once the
survivors of the hygromycin treatment have been obtained then the
corrected cells containing the FA gene can be selected for by treating the population of cells with first one and then another DNA cross-linking agent at doses which are lethal to the majority of FA cells but not to normal cells. Cells which survive treatments with both cross-linking
agents will most likely contain a plasmid with the cDNA containsing the FA
gene.
To confirm that the FA gene has been found, the plasmids from a large population of these cells must be extracted and then transfected into E.
coli where each bacteria will take-up only one plasmid. Mini-plasmid
preps can then be performed to obtain large numbers of each individual plasmid. Each separate plasmid can then be run on an agarose gel to
determine its size and to ultimately determine how many distinct plasmids
there are. The individual plasmids, starting with the ones recovered in the largest number can be introduced back into the FA cells and can be
selected once again with the two DNA cross-linking agents. Plasmids
cross-linking treatments, only a small number of them actually corrected
the defect. The others were "passenger" plasmids that were maintained along with the correcting plasmids. This is due to the inherent stability of the EBV episomal plasmid in the presence of EBNA-1.
The final step would be to recover the cDNA in all the individual
FIGURE 3: THE CLONING SCHEME OF THE FA-B GENE. 1 8
Q ^ - EBV plasmids each with a
0*P ^ segment of the cDNA library.
After 2cd selection,
sequence cDNA.
Nk Transfect plasmids into FA cells.
Re-transfect clones back into
FA cells to see which ones
correct the defect.
hygromycin B Select for hygR cells
12 3 4
Cut out cDNA portioon of plasmid:
Run on a gel to determine number of separate clones.
MMC- Treat cells with XL agent
T
m
Clone #
DM0
12 3 4
PUVA
Grow up each clone.
Extract pure plasmid.
T
(®)
(®)
> Extract plasmid.
Transfect into E. coli.
m
Only cells which can adequately repair
.'s will survive, i.e. cells which have
'e plasmid containing the cDNA with the
Chapter III: MATERIALS AND METHODS
Cell lines and cell cultures.
The A9 mouse cell line with human chromosome #20 (HC20) tagged
with neomycin resistant gene was obtained by Dr. R. Misra. HSC's 72, 99, 230, and 62, human, EBV transformed lymphoblastoid cell lines from FA
groups A, A, B and D respectively, HSC 1199-11-2, a human SV40
transformed FA fibroblast, and HSC 92 and 93, normal human
lymphoblastoid cell lines, were the generous gift of Dr. Manual Buchwald,
(Hospital for Sick Children, Toronto, Canada). GM6914A, a human SV40
immortalized fibroblast, and GM1309B, a primary human fibroblast,
officially classified as belonging to FA group A, were purchased through the Human Genetic Mutant Cell Repository (Camden, N.J.).
Media and Cell culture
The A9 mouse cell cultures were maintained in RPMI 1640, (Gibco)
supplemented with 10% fetal bovine serum (FBS), 100 ug/ml glutamine
and 100 ug/ml penn-strep and maintained in 800 ug/ml G418 (Gibco).
They were split 1:10 - 1:15 every 5-6 days.
The FA lymphoblast cell lines HSC 72, HSC 99 and HSC 230 were main¬ tained in RPMI 1640 media and supplemented with 10% FBS or 10% bovine calf serum (BCS) as well as glutamine and penn-strep. They were split 1:8 every 5-6 days. The normal lymphoblast cell lines HSC's 92 and 93 were
maintained in RPMI 1640 media supplemented with 10% FBS or BCS as well
as glutamine and penn-strep and were split 1:10 every 5-6 days.
The transformed fibroblast cell line, GM6914A was maintained in Eagles
minimal essential media (EMEM, Gibco) and supplemented with 10% FBS,
glutamine and penn-strep. They were split 1:10 every 5-6 days.
GM1309B was maintained in EMEM supplemented with 10% undialysed
FBS with glutamine, penn-strep and non-essential amino acids and was
split 1:5 every 5-6 days. The FA fibroblast cell lines, HSCl 199-11-2 was
maintained in EMEM media and supplemented with 10% FBS as well as
20 Plasmids used:
The lacZ expression vector, pH200 was constructed by T. Sun of the Vos lab and is a mini-EBV plasmid containing the genes, oriP, the origin or
replication in mammalian cells which contributes to the stable
maintenance of the cell as an episome, ori lyt, the origin or replication in
mammalian cells during the lytic cycle, hygr, hygromycin resistance gene
for selection in human cells, and ampf, the ampicillin resistance gene for
selection in bacterial cells, all of which are driven by an SV-40 promotor.
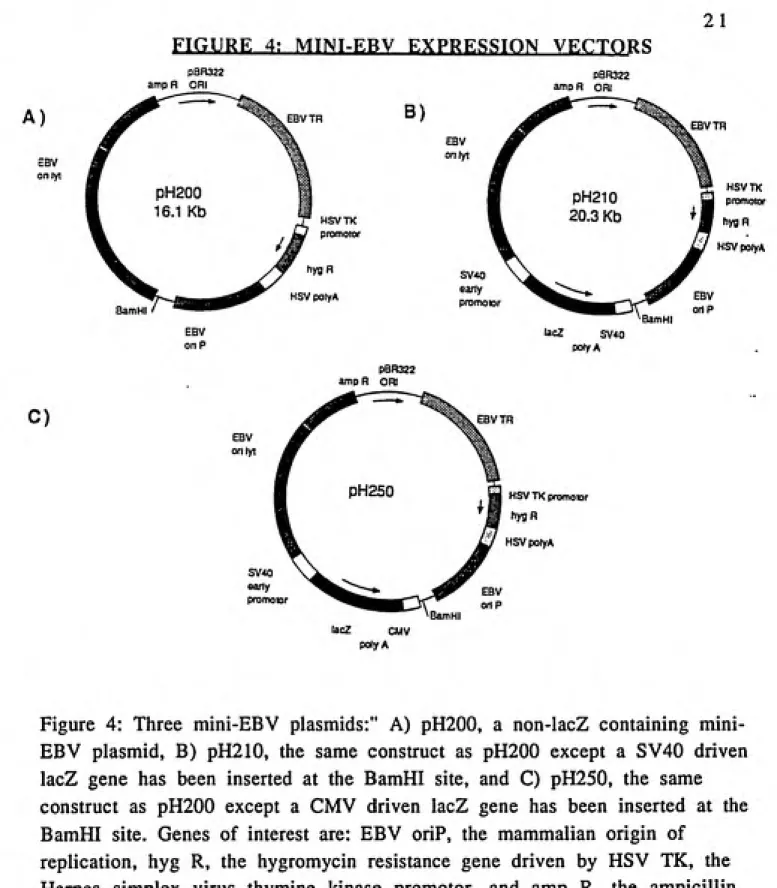
pH210 is the same construct as pH200 with the addition of lacZ gene driven by the SV40 promotor. pH250 is a similar construct as pH200 but with the addition of a CMV promotor and the lacZ gene (figure 4).
pDR2 is a commercial EBV plasmid containing a cDNA library (Clontech
Inc.) derived from human placental cells. It contains an oriP, Col El ori, for
replication in E. coli cells, EBNA-1, also for stable maintenance of the plasmid as an episome, hygr for selection in human cells, ampf for
selection in bacteria, a cDNA insert and an RSV-LTR, the Rous-Sarcoma
virus promoter for the expression of the cDNA in mammalian cells, (figure
5).
METHODS: Project One:
Microcell-mediated chromosome transfer procedure.
The MMCT procedure is based on the protocols presented by Fournier,
(1981), Saxon et al., (1985), and Sanford and Stubblefield, (1986) and Dr.
B. Weisman (unpublished) and can be seen in figure 2 (20, 45, 48). It can be broken down into four basic parts, consisting of the following:
1. Recipient and donor cell preparation.
Approximately 1.0 x 10⁶A9 cells were seeded into each of six T-25
Nunclon flasks four days prior to the day of fusion to be 80% confluent 2 days before the fusion. At this time colcemid was added at concentrations
ranging from 0.005 - 0.2 ug/ml. 2.0 x 10^ GM6914A cells or 3.0 x 10⁶
GM1309B cells were seeded into a each of two 100 mm tissue culture
plates (Falcon) 2 -3 days prior to the fusion so that they would be 80% confluent on the day of fusion. One dish received the MMCT treatment
with the microcells while the other dish received the MMCT treatment
with no microcells. FA lymphoblast were seeded at 2.0 x 10^ cells per 100
A)
FIGURE 4! MTNT-ERV EXPRESSION VECTORS
B)
PBR322 amp R ORI
EBVTR
EBV on lyt
pH200
HSVTK prrxnonx
PBR322 amp R ORI
hygH
HSV polyA
BamHI
EBV
on P
PBR322 amp H ORI
C)
HSVTK
promotor
hygR
HSV polyA
promo lor
BamHI
lacZ SV40
pdyA
EBVTR
PH250
HSV polyA
promoior
HSV TK promoior
BamHI lacZ CMV
polyA
Figure 4: Three EBV plasmids:" A) pH200, a non-lacZ containing mini-EBV plasmid, B) pH210, the same construct as pH200 except a SV40 driven
lacZ gene has been inserted at the BamHI site, and C) pH250, the same
construct as pH200 except a CMV driven lacZ gene has been inserted at the BamHI site. Genes of interest are: EBV oriP, the mammalian origin of
replication, hyg R, the hygromycin resistance gene driven by HSV TK, the
Herpes simplex virus thymine kinase promotor, and amp R, the ampicillin
22 FTGIJRE 5: nPRl ERV-ha.Pri rPNA lihrnrv
A)
f;«4infTI1
^^ CXiP
pDR2
roivA \
.OVA ^
1 i
10.7 Kb
/ͣ----—- By tt tWl/l
^ESNAI HSV t« /
^lk
CtxEl / ͣ^ h«IOS«/l^1^ on /
...^^^^
amg ^-^
IMim HE! ...^
B)
I Z 3 H $ 4 e^k)
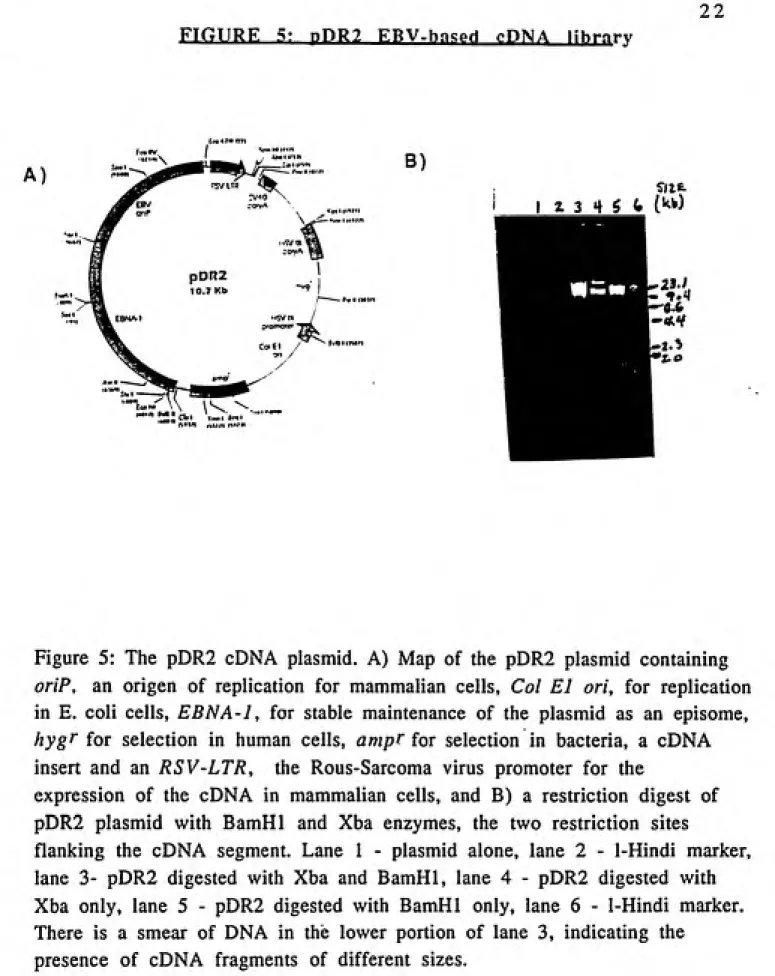
Figure 5: The pDR2 cDNA plasmid. A) Map of the pDR2 plasmid containing
oriP, an origen of replication for mammalian cells. Col El oh, for replication
in E. coli cells, EBNA-1, for stable maintenance of the plasmid as an episome,
hygf for selection in human cells, ampf for selection in bacteria, a cDNA
insert and an RSV-LTR, the Rous-Sarcoma virus promoter for the
expression of the cDNA in mammalian cells, and B) a restriction digest of
pDR2 plasmid with BamHl and Xba enzymes, the two restriction sites
flanking the cDNA segment. Lane 1 - plasmid alone, lane 2 - 1-Hindi marker,
lane 3- pDR2 digested with Xba and BamHl, lane 4 - pDR2 digested with
Xba only, lane 5 - pDR2 digested with BamHl only, lane 6 - 1-Hindi marker.
There is a smear of DNA in the lower portion of lane 3, indicating the
23
growth phase on the fusion day.
2. Isolation of the microcells.
On the day of the fusion the media from the T-25 flasks containing the
A9 cells was removed and the flasks were filled with pre-warmed
cytochalasin B (100 ug/ml). After 20-30 minutes at 37^ C, the six flasks were placed, along with 100 ml of distilled deionized water (ddH20) into each well of a Sorvall SS-45 rotor and spun at 12,000 rpm's for 1 hour at
25-30° C. When the flasks were are removed, a white pellet containing the
microcells and cell debris, was apparent at the bottom corners. Under
sterile conditions, the cytochalasin B was taken out, (and filtered through a 22|i filter to be used again), and 1.5 ml of fresh unsupplemented RPMI
media (UM) was added to each flask. The pellets in the flask were
resuspended in the media and collected in a 15.0 ml centrifuge tube. The media collected was then spun down at approximately 2100 rpm's for 10
minutes in an lEC tabletop centrifuge.
After spinning, the media was aspirated off and the pellet resuspended
in 10 mi's fresh UM. It was then filtered through 8-|j,m, 5-|j,m and 3-|j,m
polycarbonate filters (Nucleopore, Pleasonton, Ca.) serially and collected in
a centrifuge tube. This purified microcell pellet suspension was then spun
at 2100 rpm's for 15 minutes.
3. Fusion of the microcells and recipient cells.
At this point the fusion methods can vary depending on if the
recipient cells are monolayer or suspension cells. Below are four
variations employed: For monolayer recipient cell lines, GM6914A and GM1309B.
Standard protocol:
The monolayer recipient cell lines GM6914A or GM1309B were washed
twice with PBS in preparation for the fusion. After the purified microcells
were pelleted and the media was removed the pellet was then
resuspended in 2.0 mis of PHA (100 ug/ml) and immediately added to one
of the 2 plates. 2.0 mis of PHA (same concentration) with no microcells
was added to the control plate. The dishes were then incubated for 5
24
cell line to the PHA. After a given time the PHA was taken off and 1.0 ml
of 45 % PEG was added for one minute after which they were washed
three time consecutively with UM. After the last washing, 10 mis of
complete growth media was added to the cells which were then incubated
at 370 C for at 24 -48 hours.
Modified protocol.
The same procedure was followed with the exception that the recipient
cell line GM1309B was grown in 6-well plates and when the PHA-microcell
suspension was added, they were centrifuged in an lEC centrifuge for 5
minutes at 1500 rpm's This variation was employed in an attempt to
improve the chances that the microcells would attach to the cells.
Suspension recipient cells. Modified protocol #1.
Approximately 1.0 x 10'^ lymphoblastoid cells were placed into each of
two 15.0 ml centrifuge tubes and spun down at 1200 rpm's for five
minutes in a tabletop lEC centrifuge. After spinning, the media was
removed and the cells were washed once with UM. After washing, the
media was aspirated from both tubes. To the first tube, the microcell-PHA
mixture was added and to the second tube, 2.0 mis of PHA with no
microcells was added. The cells were exposed to PHA for approximately 5
minutes at RT and 10 minutes at 370C. After this time 2.0 mis of UM wasadded to inactivate the PHA and the cells were spun down at 1300 rpm's.
The PHA was taken off and 2.0 mis of 45% PEG was added for one minute,after which time 10.0 mis of UM was added and the cells spun down at
1500 rpm's. This washing procedure was repeated 1-2 times. After the
last time, the cells were resuspended in complete RPMI media with 10%
FBS, placed into a 100 mm dish and incubated at 31^ C.
Modified lymphoblast protocol #2.
Approximately 2.0 x 10^ lymphoblast cells in the log phase of growth
were placed into a 50 ml centrifuge tube and spun down at 1200 rpm's for
five minutes. After spinning, the media was removed and the cells were
washed once with UM. After washing the media was removed and the
cells were resuspended in 6.0 mis of fresh UM. Three mis of this solution,
6-well plate (Falcon). The plates were spun down at 1500 rpm's for 10 minutes to obtain a forced monolayer. At this point the UM was removed from the cells and 2.0 mis of PHA-microcell suspension was carefully
added to the cells and incubated the appropriate amount of time. After
the appropriate time, the PHA was removed and 2.0 mis of 45% PEG was
added. After one minute in PEG, three to four mis of UM was added to the
wells and the cells were dislodged using a Pasteur pipette. This solution
was then added to a 15 ml centrifuge tube containing 10 ml of UM and
spun down at 1500 rpm's. This washing procedure was repeated 1-2
times. On the final time, the cells were resuspended in complete RPMI media with 10% FBS, placed into a 100 mm dish and incubated at 370 C.
4. Selection of transformed cells.
Two days after the fusion, the cell were placed on selection in G418
(neomycin, [Fisher]) for up to 25 days, changing the media every 5-7 days.
For the GM1309B and GM6914A fibroblasts, 200 and 800 ug/ml of G418 respectively were used. For the FA-A lymphoblast, 800 ug/ml G418 was used though other concentrations, of 400, 1000, and 1200 ug/ml were
tried as well.
Project Two.
Plasmid Preparation: All of the plasmids were prepared by the methods
described in Current Protocols for the Cesium Chloride-Ethidium Bromide
preparation of plasmid DNA (5) with some minor alterations which
include adding a LiCl precipitation step after the first ethanol precipitation,
in order to remove part of the RNA, and placing the DNA through two
rounds of CsCl separation.
The pDR2 plasmid came incorporated into a X phage. AMI E. coli were
infected with approximately 1.0 xlO^ phage particles at which point the
pDR2 insert was detached from the phage by the addition of ITPG which
signals recombination to occur at the sites flanking the pDR2 plasmid.
After this normal plasmid preparation protocol was followed.
Following the second round of CsCl centrifugation, the plasmid band was
removed and TE saturated iso-propanol was added to remove the ethidium
2 6
Quantifying plasmid: To determine the amount of plasmid, 20 ul of the
plasmid solution was diluted into 1000 ul ddH20. Using a
spectrophotometer, the OD at 260 and 280 nM was then taken. If the ratio
of OD at 260 over 280 was 1.8 or over, the amount of plasmid could be
determined by the following formula:
OD at 260 nm x dilution factor x 50 mg/ml = ug of plasmid/ml
To determine the purity and the size of the plasmid, approximately 5.0
ng of plasmid was placed in one lane of a 1% agarose gel and run for 30-45 minutes at 90 volts. The X,-hindI marker, which has bands of pre¬
determined size, was run in an adjoining lane. To correctly determine the
size of the plasmid, the plasmid was cut with restriction enzymes and then
run on the gel to confirm the presence of cDNA fragments in the pDR2 plasmid (figure 5-B).
Transfection methods:
Electroporation: 5.0 x 10^ cells in log phase growth in 0.3 mis RPMI
1640 media with 10% FBS, was added, along with 20.0 ug plasmid DNA, to
a BioRad 0.4 cm cuvette and placed on ice for 10 minutes. After this time the cuvette was placed in the BioRad Gene Pulser electroporation chamber and electroporated at the desired voltage (v) and capacitance (uF). After
electroporation, the cells were placed back on ice for 10 minutes and then
diluted in 10 mis of complete media and incubated at 37^0.
Lipofection: Method A: For each reaction: 40.0 ul of Lipofectin® and 15.0 ug of plasmid DNA were added, respectively, into each of two 3.0 ml
polystyrene tubes containing 1.5 mis of OPTI-MEM media (Gibco). The
contents of each tube were then mixed and allowed to incubate for 10
minutes at RT. It was then, along with 5.0 x 10^ lymphoblastoid cells
previously washed in PBS, added to one well of a 6-well plate (Falcon) and
allowed to incubate at 37^ C for 12-18 hours. The OPTI-MEM media was
then removed and the cells were resuspended in complete RPMI media
and placed back in the incubator at 37^0
HSC's 72 and 230 were tested with this method to determine the short
two cell lines were transfected with four different plasmid, pH200, pH210,
pH250 and pDR2, all of which contain the gene for hygromycin resistance.
After two days approximately 2.0 x 10^ cells were used for the ONPG assay
and the remainder were placed on 200 ug/ml hygromycin B.
Lipofection: Method B: For each reaction: Into two separate polystyrene
tubes were placed, respectively, 6.0-12.0 ug of plasmid DNA in OPTI-MEM
media to a volume of 100 ul and 20.0 - 40.0 ul of Lipofectin® with
OPTI-MEM media to a volume of 100 ul. The contents of each tube were
combined and allowed to incubate at RT for 10 minutes. After this time
the DNA-liposome suspension was added to the cells, (pre-washed once in
OPTI-MEM media), and resuspended in 800 ul of this same media. This
solution was incubated for 7-14 hours at 370 q at which time 4.0 mis ofmedia was added to the cells which were returned to the incubator for
24-36 hours.
This method was used to test the lipofection transfection efficiency of
the FA-B lymphoblastoid cell line, HSC 230. Into each of four wells of two
6-well plates were placed 2.5 and 5.0 x 10⁶ jjSC 230 cells, respectively.
Then to the four wells of each plate was added DNA-liposome complexes
incubated, as described above, in ratios (ug DNA to ug Lipofectin®) of 6:12,
6:24, 12:24 and 12:36. The plates were incubated for 8 hours after which
time 4.0 mis of complete media was added to each well. 48 hours later an
ONPG assay was performed to determine the level of P-galactosidase
expression.
Endocytosis-fection: A detailed description of the preparations of the
materials used for this assay are described in Wagner et al., 1992, and
Gotten et al., 1992 (11, 58). The material used for this experiment was
prepared and generously supplied by Dr. D. Curiel, (UNC-Ch School of
Medicine).
DNA-Adenovirus conjugate preparation: (per reaction) On the day of the
transfection, 0.25 x lO^o particles of replication-incompetent adenovirus
(A249) was aliquoted into a 15.0 ml centrifuge tube. In a separate tube,
1.25 ug of monoclonal antibody-poly-lysine (MP301pL) was diluted in
125.0 ul of 50 mM HBS (150 mM NaCl/20 mM HEPES, pH 7.3), added to the
2 8
plasmid DNA was diluted in 125.0 ul of HBS in a separate tube and added
to the first tube and again incubated at RT for 30 minutes. Lastly 3.6 ug transferrin poly-lysine (hTFpL) and 2.6 ug poly-L-lysine 295 (pL295)
were placed in 125.0 ul of HBS and again added to the first tube and allowed to incubate for 30 minutes (see figures 6 and 7).
At this point the DNA-adenovirus complex was added to the cells in 1.0
mis of media containing 2.0% FBS. After 1-2 hours at 37^ C, media with
FBS was added so that the cell concentration was 5.0 - 7.0 x 10^ cell/ml
and the FBS concentration was 10.0%. The cells were then incubated for
48 hours after which time they were placed on selection and/or the appropriate assays were performed.
Test Experiment #1: In the first trial, approximately 20 hours pre-transfection, 6.0 x 10^ cells in 10.0 mis were seeded into each of two 100 mm plates. To one plate was added 50.0 ug/ml desferrin in order to induce formation of transferrin receptors on the cell surface. The other plate received no desferrin. The following day, 20% of the cells from each
plate were taken and used for the endocytosis-fection experiment. (The remaining cells were used for a parallel transfection using electroporation.)
At the time of transfection, in a 60 mm tissue culture dish (Falcon), 0.5 ml
of the DNA-adenovirus-transferrin-poly-lysine complex was delivered to
1.5 X 10⁶ actively dividing cells in 1.0 ml of media containing 2.0 % FBS,
and allowed to incubate at 37^0 for 1.5 hours. After this time 1.5 ml of
complete media with 18% FBS was added to each plate which were placed
in a 370 C incubator. After thirty hours, the cells were counted and an
ONPG assay was performed.
Test Experiment #2 : In the second experiment, the standard procedure,
as described above, was used for four different trials, with variations in the amount of various components. 2.0 ug of the reporter plasmid pH210 was used instead of the 6.0 ug of the CMV-lacZ construct used in Test #1 in all four trials. This difference aside, trial 3 was done under the same
conditions as in experiment 1. In trials 1, 2, and 4, no pL295 was used and as well, in trial 4, only 1.25 x lO^o particles, 50% of the normal amount, of
adenovirus was used.
After the formation of the DNA-adenovirus conjugate, 0.5 mis of it was
Figure 4: Construction of Adenovirus-DNA complex.
+
Adenovirus
(Replication
defective)
'z^^
Antibody polylysine
30 min. 30 min
+
30 min
DNA
(plasmid)
RT Tiransferrin
polylysine
Conjugate
Figure 6: Procedure for preparing the adenoviral-DNA complex. The linker antibody-polylysine macromolecuie is incubated with the replication-defective adenovirus providing a site for the plasmid DNA to attach. The transferrin-polylysine (hTFpL) then binds to the DNA causing it to fold into a "doughnut" shape, (11,12). The
Figure 7: Mechanisms of the endocytosis-fection
method of transfection.
30
1. Adenovirus-plasmid conjugate is added to cells.
^^
^
2. Conjugate binds to adenovirus or transferrin receptors.
3. Bound conjugate is taken up through endocjrtosis.
e3
V
4. Adenovirus disrupts endocytotic membrane, allowing plasmid to escape.
4.0 mis of 10% FBS media was added. 48 hours later, the cells in each trial
were counted and 1.0 x 10^ cells from each trial was used for the ONPG
assay. The remainder of the cells, at a concentration of approximately 4.0 - 5.0 X 10⁵ cell/ml, were placed on 125 ug/ml hygromycin B. The cells
were counted and the media changed every 4-5 days. After the tenth day the dead cells were removed by centrifugation on a ficoll gradient.
Determining Transfection Efficiency
In order to determine the most efficient method of transferring the
plasmid into FA cells, plasmids containing the lacZ gene (which codes for
the enzyme P-galactosidase) were transfected into FA cells. This enzyme
breaks down the substrate ONPG (o-nitrophenyl-p-D-galactopyranoside) forming a yellow by-product, and subsequently the relative amount of the
enzyme produced can be determined by measuring the optical density
(OD) of the solution; the intensity of yellow being directly proportional to the amount of P-galactosidase. Two plasmids were used which contained
the lacZ gene, one of which has the SV40 promoter (pH210) and the other
which has the CMV promoter (pH250), the latter of which has been shown
to be five times as strong as the former (T. Sun, unpublished data).
P-galactosidase or ONPG Assay.
A description of the |3-galactosidase assay is described in detail by Lim and Chae, 1989 (38). Briefly, from 1.0 - 2.0 x 10^ cells were washed once with phosphate buffered saline solution (PBS) and resuspended in 0.5 mis of Hanks balanced saline solution (HBS). This cell solution was then added to a 1.5 ml eppendorf tube containing 0.5 ml of a 2X ONPG solution (7.0
mM o-nitrophenyl-3-D-galactopyranoside [ONPG] and 10% Nonidet-40
[NP-40] in HBS). This solution was mixed thoroughly and allowed to incubate
at 370 C for various time points from 1-62 hours. At any time point, the solution was spun in an microfuge at 1350 rpm's for 5.0 minutes to pellet
the cells and cell debris. The optical density (OD) at 420 nm of the
supernatant was then measured in a spectrometer, using a plastic cuvette.
Afterwards the cell solutions were retained and re-incubated.
To find the portion of the OD reading due to the presence of the
transfected plasmid, the OD reading from cells transfected with a non-lacZ
3 2
reading of the lacZ-transfected cell line. This equals the corrected OD
reading.
Corrected OD reading = OD at 420 nm of - OD at 420 nm of
lacZ transfected cells non-lacZ transfected cells
To take into account the different numbers of cells sometimes used for
the ONPG assay, the OD readings were normalized by dividing the OD
reading by the number of cells used for the ONPG assay, to give an
absorbance unit per cell.
Absorbance unit = Corrected OD for cells transfected with lacZ plasmid
per cell, (AU) # of cells used in ONPG assay
Determining transfection percentage:
When the ONPG assay is performed on cells which have been transfected with a pH210, it was sometimes performed on a similar number of cells from a HSC 93p588Z, a normal lymphoblastoid cell line which carries the lacZ plasmid driven by the same promotor. After 3
hours, the OD was taken of experimental and control cells and an estimate
of the percentage of cells transfected was calculated as following:
Transfection = Corrected OD reading of transfected cells_____ x 100 efficiency, (%) Corrected OD reading of cells with lacZ plasmid
SENSITIVITY ANALYSIS OF SELECTING AGENTS
Hygromycin sensitivity:
HSC 230 cells were exposed to varying doses of hygromycin B to test
their sensitivity. In the first trial, 5.0 x 10^ cells/ml in 10.0 mis were
added to each of six 100 mm dishes. 0, 50, 100, 150, 200 and 300 ug/ml
hygromycin B were added to each of the dishes and the cell counts were
taken every two days. After 6 days the growth percentage was calculated.
In the second trial, 0, 50, 100, 150 and 200 ug/ml hygromycin B,
MMC sensitivity:
For each cell line, 1.0 x 10^ cells in 1.0 ml were placed into each well of
a 24-well plate. Each of the 6 columns of the plate were treated with a
different concentration of MMC including 500, 100, 50, 10, 1, and 0 nM.
The cells were incubated at 37° C for 5 days after which time the number
of cell in each well was calculated and the percent cell growth was determined. This was performed on FA cell lines HSC's 230, 72, 62 and
normal cell lines UC and HSC 93.
PUVA - Psoralen and UVA light.
2,0 X 10⁵ cells/ml in 1.0 ml were placed into each well of a 24 well
plate. Each of the 6 columns were treated with a different concentration of the psoralen derivative, HMT, from 0.1, 0.05, 0.001, 0.005, 0.001 and 0.00 ug/ml. After the HMT was added, the cells were incubated in the dark at 37° C for 10 minutes and then placed under 360 nm UVA light for 5
minutes. After this time the plates were placed back in the 37^ incubator
for five days at which point the number of cell in each well was determined and the percent cell growth was calculated.
The percent cell growth was determined by the following formula for
treatment of any given cell line with an growth inhibiting agent:
% growth = (Original cell # - Dav X cell number") concentration Y (Original cell # - Day X cell number) no treatment
Where X is # of days after the treatment with chemical and Y is the
concentration of that chemical administered to the cells
The Selection process:
Cells transfected with a plasmid containing the hygromycin resistant
gene were selected in hygromycin at a concentration that inhibited growth 90-99% after 5-6 days. Cells were placed in the desired concentration of
the selecting agent and every 4-5 days a cell viability assay was