A SPATIAL
STATISTICS
EXAMINATION OF
CHANGES IN
VIOLENT
CRIME
PATTERNS
FOLLOWING A
HOUSING
REDEVELOPMENT
PROJECT
M
ICHAELT. B
ACONA thesis submitted to the faculty of the University of North Carolina at Chapel Hill in partial fulfillment of the requirements for the degree of Master of Arts in the Department of Geography.
Chapel Hill 2006
Approved by, Advisor: John Florin
Advisor: Jim Fraser Reader: Tom Whitmore
ABSTRACT
MICHAEL BACON: A Spatial Statistics Examination of Changes in Violent Crime Patterns Following a Housing Redevelopment Project
The HOPE VI public housing redevelopment program has funded the demolition of
many distressed public housing units across the United States, along with the construction of
new developments which incorporate public housing with market-rate housing. Among the
primary goals of this program is the improvement of the safety and security of the public
housing residents as well as their non-public housing neighbors. One such HOPE VI project
replaced the Few Gardens public housing community in Durham, NC with an array of
mixed-income housing scattered throughout a 96 block area just east of downtown.
Using univariate statistical techniques implemented through a geographical
information system (GIS), along with local statistics of spatial clustering, this study examines
how the spatial distribution of violent crime changed both in the area around the demolished
complex and in the city as a whole during the time period in which the project was executed.
While the HOPE VI area remained one of the more dangerous parts of the city, violent crime
in the neighborhood declined precipitously between 2002 and 2004. At the same time,
however, violent crime increased in several other pockets of the city, including some areas
where large numbers of former Few Gardens residents relocated. These results illustrate
HOPE VI's capacity for positive change, but also troubling trends in which disorganization
ACKNOWLEDGMENTS
This work would not have been possible without the assistance and support of quite a
few people. In particular, many thanks to Dr. Jim Fraser, for both the use of the resources at
his disposal as well as continued guidance in the execution of this study. Also, to Dr. Jun
Liang for his excellent methodological inputs, and Drs. John Florin and Tom Whitmore for
providing badly needed advice and structure through the the process. Additionally, I wish to
thank Dr. Steve Walsh and Dr. Aaron Moody for their advocacy and support on my behalf.
I also owe an incredible debt of gratitude to a huge number of people for supporting
me over the past two years. Most of all, to my parents, Tom and Ellen Bacon, for all of the
many forms of support they have given me, both in this endeavor and in all previous ones, as
well to as my sister Kathryn, for always being there. But I also must thank all of the friends
who put up with me and kept me sane through all of this: Grace, Caroline, Julie, Susan,
Thistle, Doug, Laura, Chris, Dan, Holly, Maggie, Beth and Mich, the old time musicians in
the Triangle, everyone in the Beach Group, and quite a few more I'm sure I've forgotten.
TABLE OF CONTENTS
INDEX OF TABLES...vii
1. Introduction and Background...1
Social Disorganization Theory...2
Social Capital and Social Disorganization Theory...4
Collective Efficacy: A Proximate Expression of Social Capital and Social Organization?...9
Social Networks as Obstacles to Collective Efficacy...11
Order Maintenance and Social Disorganization Theory...13
A Missing Link: Community Development...18
Moving Forward with Social Disorganization...19
A Study of Durham, NC – HOPE VI and Violent Crime...20
HOPE VI...21
Few Gardens and the Durham HOPE VI Project...21
Crime Displacement...22
Understanding the Character of Changes in Spatial Pattern...23
2. Methods and Methodology...24
Spatial Statistics, Spatial Analysis, and Urban Crime – A Methodology...24
Using GIS and Spatial Analysis to Examine Crime...24
Univariate Statistics for Local Spatial Cluster Analysis...26
Issues With Spatial Analysis...30
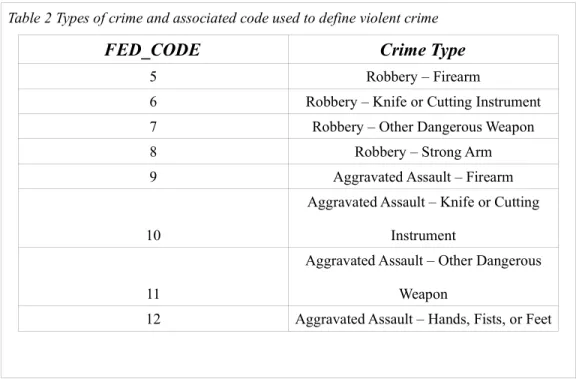
Data Preparation...38
Data Processing...45
3. Results ...47
Standardized Per Capita Violent Crime Rates at the Census Tract Level...47
Gi* Local Spatial Cluster Analysis by Census Block...47
Gi* Local Spatial Cluster Analysis by Lattice Grid...48
Local Moran's I Analysis by Lattice Grid...49
Gi* Analysis of Population Standardized Violent Crime Rates...50
4. Discussion...52
The Impact of HOPE VI...52
Increased Crime Elsewhere in the City...53
Methodological Issues...55
INDEX OF TABLES
Table 1 Established methods for constructing a weights matrix for spatial association, after Getis and Aldstadt (2004)...33
Table 2 Types of crime and associated code used to define violent crime...39
1.Introduction and Background
Few people require an academic study to realize that crime, particularly violent crime,
remains a major issue in the urban areas of the United States. Attempts to address crime have
generally focused on two avenues of understanding: environmental factors on the one side,
including the physical and social environment, and individual factors on the other, focusing
on the opportunity to commit crimes, the rational choices of the offender, and means of
deterring individuals from becoming offenders. The past few decades have seen a resurgence
in the attempt to understand street crime, including violent crime, in the urban context in
which they occur, and subsequently to try to prevent crime by altering that urban context
through neighborhood revitalization projects, physical redevelopment projects, community
building projects, and others.
In this study, I address how several such efforts in a mid-sized southern city have
attempted to alter the physical and social environment, at least in part to attempt to reduce
street crime. In so doing, I emphasize that any such focus on environmental aspects
necessarily implies a spatial focus, and that an understanding of the spatial character of
violent crime may help to understand how these environmental influences on crime operate.
I begin with a review of theories of social disorganization, including under this broad
umbrella a wide range of theoretical approaches to understanding environmental impacts on
crime. (I include physical environmental influences under social disorganization theory,
revitalization projects. A discussion of methods and results follow in subsequent chapters.
Social Disorganization Theory
Ever since Shaw and McKay (1942) noted that crime in economically disadvantaged
areas remained high even when the local population turned over considerably, social theorists
have searched for how neighborhood, community, and environmental effects influence rates
of street crime. The theory of “social disorganization” that Shaw and McKay launched
provided an overall framework for understanding these issues. After falling out of favor in
the middle of the century in favor of theories of crime prevention which focused more on
individuals and opportunities to commit crimes, the social disorganization theory of crime
has re-emerged in the past 25 years, and has been joined by several other bodies of theory
regarding how local effects influence street crime. I discuss the progress of social
disorganization theory, as well as several parallel and derivative bodies of theory in how they
posit environmental influences on crime.
The initial study (Shaw and McKay 1942) first proposed social disorganization theory
after observing that crime levels remained high in economically disadvantaged
neighborhoods, even after the local population turned over and the neighborhood ethnic
makeup changed substantially. Rather than ascribe this persistent crime problem in poorer
neighborhoods directly to a link between delinquency and economic status, the theory of
social disorganization proposed that economically disadvantaged areas experience higher
rates of turnover, as citizens who achieve the ability to leave the area do so. According to the
theory, this results in a population uninterested in establishing community norms in an area
they intend to leave. Additionally, the turnover and heterogeneity of the populace prevent the
residents (Bursik 1988).
The theory fell out of favor from the criminological community for several decades,
before a resurgence in the late 1970's pushed it back to the forefront. This revival culminated
in two watershed works: a critical review by Bursik in 1988 and an empirical study by
Sampson and Groves in 1989. Bursik attributed the previous decline in the theory's
acceptance to a disciplinary shift away from “group” analyses of crime, and towards
individualistic explanations, such as opportunity and motivation, and states that these shifts
“overcompensated” towards the individualistic perspective. Additionally, Bursik cites
difficulties accurately measuring both social disorganization as well as the crime and
delinquency that the theory claims social organization helps to control (Bursik 1988).
Sampson and Groves addressed this difficulty in measurement of both factors,
measuring social disorder through the British Crime Survey, which asked a series of
questions regarding an area within a 15-minute walk of the respondent's residence.
Questions asked what proportion of the respondent's friends lived within this area, how many
community or club meetings the respondent attended, and the propensity for teens to
congregate in disruptive groups in the area. Crime rates were also derived from the survey
data, asking both if the respondent had been victimized in the area, and if the respondent had
ever committed acts of personal violence. Their results provided the first strong empirical
support of the social disorganization theory of crime – the measures used to quantify social
disorganization did indeed correlate positively with higher crime rates (Sampson and Groves
1989). Subsequent replication of the study using similar data at different time frames
provided similar results – social cohesion did indeed appear to correlate with lowered crime
Despite these successes, some research has indicated that attempts to broadly link
social disorganization directly with crime may encounter some obstacles, and that caution is
necessary in pursuing these links. In a participatory observation study, Pattillo found that
middle class black neighborhoods in urban Chicago encounter difficulties attempting to
enforce social order due to the incorporation of gang leaders and members into the traditional
social networks. In some ways, a modified version of order is maintained by gangs who
enforce orderly behavior but still conduct illegal activities which may undermine the safety
of neighborhood residents (Pattillo 1998). In light of studies like Pattillo's, I address the
literature surrounding two questions regarding the specifics of how these social networks
operate to produce the effects which social disorganization predicts. First, what structural,
economic, or cultural factors lead to the formation of these networks? Second, how and by
what mechanisms do these networks influence rates of street crime? In order to answer these
questions, modern social disorganization literature has both drawn upon related bodies of
theory as well as developed new theories to assist in answering them. It is to these I now
turn.
Social Capital and Social Disorganization Theory
In general, the motivation for the various theorizations of social capital stems from
the desire to integrate models of human behavior based on social theory and those based on
economic theory. Social capital theory evolved quite separately from social disorganization
theory at first, but as it did with many other aspects of social theory, social capital over time
absorbed aspects of disorganization theory. I first discuss the various formulations of social
capital theory, then examine the ways in which social capital has entered the social
Early conceptions: racial income differences and concentrated disadvantage
One of the first treatments of the term came from Glenn Loury (1977), while
discussing negative effects which minority races might experience outside of active human
prejudice. In Loury's formulation, a society where people tend to associate within their own
race and where one race tends to hold more capital, minority races may suffer disadvantages
due to lack of access to more privileged social networks. Loury does not elaborate on the
concept of “social capital,” but instead advocates development of something to account for
reasons why difference in opportunity might persist when individualistic models of economic
opportunity predict equality.
Building upon many of Loury's themes, William Julius Wilson's body of work largely
concerned questions of the obstacles minorities may face outside of specific racial prejudice.
While Wilson, to my knowledge, never explicitly discussed the concept of social capital,
many of his concerns clearly echo Loury's. Specifically, in his 1987 work The Truly
Disadvantaged, Wilson notes:
(I)n a neighborhood with a paucity of regularly employed families and with the overwhelming majority of families having spells of long-term joblessness, people experience a social isolation that excludes them from the job network system that permeates other neighborhoods and that is so important in learning about or being recommended for jobs that become available in various parts of the city (Wilson 1987, 57).
Wilson's conception of disadvantage incorporates more than just the lack of
opportunity enhancement that would otherwise be available through a social network of weak
ties. Rather, his work represents an attempt to comprehensively address the entire cocktail of
factors which pose obstacles for disadvantaged urban populations, including two specific
concerns which relate to crime and social disorganization. First, the central theory of the
concentration of high levels of disadvantage creates obstacles above and beyond what the
individualized disadvantages would confer. As such, Wilson introduces a spatial aspect into
the conception of resources available through social networks. Secondly, Wilson here
introduces a notion of cultural transmission which is entirely theoretically distinct from
social capital conceptions. In this conception, children coming of age in areas of
concentrated disadvantage both lack exposure to positive social norms of behavior, and are in
turn exposed to more deviant forms of behavior. Again, while this will have little bearing on
the dialog on the immediate dialog of social capital, it will come to have a more important
bearing in more recent social disorganization literature.
Formal treatments of social capital: Bourdieu and Coleman
While the fundamental notions behind social capital had clearly been kicked around
before, two authors published much more formal and thorough treatments of the topic in the
1980's. While Coleman's work (1988) became much more widely read, Bourdieu's treatment
(1986) has recently received more notice and praise for its theoretical sophistication (e.g.,
Portes 1998, Sampsonet al.1999, DeFilippis 2001, 2002). In Bourdieu's formulation, social
capital is one of three principal forms of capital, (along with economic and cultural capital),
and is defined as “the aggregate of the actual or potential resources which are linked to
possession of a durable network of more or less institutionalized relationships of mutual
acquaintance or recognition.” (Bourdieu 1986, 248) His analysis is chiefly concerned with
the ways in which transfers between the three forms of capital are mediated, and how these
transfers may be exploited in order to realize ultimate gains in economic capital. Any
capacity of these social networks by which individuals may realize social capital to also
(Bourdieu 1986).
Coleman's conceptualization of social capital derives more from an attempt to bring
social theory to the economic theory of rational action. Rather than treat the ways in which
socialized man deviates from the predictions of rational maximization as exceptional,
Coleman would use social capital as the missing element in the equation which then explains
these actions which otherwise appear to be non-rational. More importantly, though, Coleman
defines social capital in a broader sense, encompassing both the resources available through
social networks and institutions, as well as the networks and institutions themselves
(Coleman 1988), a generalization of the term which has drawn criticism (e.g., Portes 1998).
In doing so, however, Coleman includes a “normative structure” in his definition of social
capital, one which provides for the supervision of children and the imposition of social norms
(Coleman 1988, S100). The resemblance of lack of social capital here to social
disorganization is not coincidental – Coleman goes on to explicitly equate the two, while
discussing microcredit associations:
But without a high degree of trustworthiness among the members of the group, the institution could not exist – for a person who receives a payout early in the sequence of meetings could abscond and leave the others with a loss. For example, one could not imagine a rotating-credit association operating successfully in urban areas marked by a high degree of social disorganization – or in other words, by a lack of social capital(Coleman 1988, S103, emphasis mine).
In doing so, Coleman implicitly establishes social capital as the fundamental operator
behind social disorganization. The veracity of this association aside, I maintain that this
implication of Coleman's has gone relatively unnoticed in critiques of his conception of
social capital, and that it has important implications for the further theoretical development of
Social capital went from a social theory to a phenomenon with Robert Putnam's
publication of his 1995 article “Bowling Alone: America's Declining Social Capital”
(Putnam 1995). Putnam takes the concept of social capital and expands it greatly beyond
even Coleman's first generalization of the topic, to include civic engagement and civil
society. Putnam's article and subsequent book have become two of the most cited works in
social theory, and have drawn criticism identifying issues ranging from his theoretical
sloppiness (Portes 1998, DeFilippis 2001, 2002), to shifting the blame for lack of economic
development to the disadvantaged (DeFilippis 2001, 2002, Fine 2002), to attempting to
de-radicalize all of social science through social capital (Fine 2002). Others have noted the
difference between the theoretical implications of Putnam's formulations and his normative
conclusions (Bebbington 2002, Williamson 2002), noting that regardless of the expansion of
the topic, Putnam is more concerned with the redevelopment of civic engagement in America
than the precise theorizations of social capital. While this may make for questionable social
science, it probably makes for good politics.
In the context of social disorganization theory, however, Putnam makes some very
specific claims which finally bring the concept of social capital into full and complete
engagement with social disorganization theory, for better or for worse. In his 1995 article,
Putnam identifies two major consequences of “declining social capital,” or what in
Bourdieu's formulation would be declining social networks leading to decreases in available
social capital for individuals. The first of these two consequences is the loss of avenues for
collective political action, leading to a more atomized democracy. Secondly, and more
importantly, Putnam identifies the loss of “good neighborliness and social trust,” and claims
disorganization remained couched in strict economic terms, Putnam identifies the link
between social trust and social capital as key for understanding differences in capacity for
collective action, establishing a strong theoretical link to the core of social disorganization
theory.
Making practical sense of this link, however has proven more difficult. While social
capital has been fertile theoretical ground for other aspects of social theory, it does not fit
cleanly into disorganization models. Particularly under Putnam's formulation, measurements
of social capital are likely to look very similar to measurements of strict social
disorganization (although reversed), and are likely to be equally difficult and clumsy to
quantify. In the past decade, the key theoretical step in incorporating the concept of social
capital, and more generally social organization, into predictive models of crime has been
Robert J. Sampson's concept of collective efficacy.
Collective Efficacy: A Proximate Expression of Social Capital and Social Organization?
Sampson and Raudenbush (1997) introduced collective efficacy as practically
measurable quantity, defining it as “social cohesion among neighbors combined with their
willingness to intervene on behalf of the common good.” In introducing collective efficacy
as a concept, the authors acknowledge that a wide variety of factors may influence this
measurement. The mere fact that its definition is effectively a combination of “social
cohesion,” which could be implicitly linked to social disorganization or social capital, with
an ambiguous mediator involving willingness to intervene, makes it difficult to incorporate
into parsimonious models. Even so, looking beyond its definition, the authors found that
levels of collective efficacy strongly correlated with reduced violent crime. For
quantification purposes, Sampson and Raudenbush represented collective efficacy as a
composite index of two categories of survey questions, one concerning “informal social
control” and the other concerning “social cohesion and trust.” In the former, residents were
asked how likely their neighbors were to intervene to stop various forms of unruly behavior
by local youths. The latter measured residents' assessments of how tightly knit the
community was, and how much they depended on and trusted each other. As a composite
index, the authors found that not only was collective efficacy strongly correlated with
decreased levels of violent crime, but also that measures of concentrated disadvantage and
residential instability which otherwise correlated strongly with reduced crime were largely
mediated in statistical models by collective efficacy. In short, according to Sampson and
Raudenbush (1997), collective efficacy acted as the proximate expression of social
organization and social capital in regards to the suppression of violent crime. Or, as
Morenoff et al. (2001) put it, collective efficacy is the “logical extension of systemically
based social disorganization and social capital theory.”
Sampson and a variety of associates followed the 1997 paper with a flurry of studies
incorporating collective efficacy into various facets of criminological research (e.g.,
Morenoff and Sampson 1997, Sampson et al. 1999, Sampson and Raudenbush 1999,
Raudenbush and Sampson 1999, Morenoff et al. 2001), and collective efficacy has largely
been adopted into the social disorganization literature at large (see Kubrin and Weitzer 2003
for a review). Of particular note is the Morenoff et al. (2001) study, which focused on the
spatial interdependence of neighborhoods with regards to violent crime and collective
neighborhood independent of surrounding neighborhoods, pervades urban research even
though it qualitatively has little resemblance to the realities of the modern city. Certainly true
closed urban villages exist, particularly within particularly ethnic or religious enclaves, but
these represent the exception more than the rule. The authors here give three distinct reasons
why crime rates of neighborhoods, in this study homicide, are spatially interdependent: First,
neighborhood boundaries are inherently artificially drawn, and therefore create divisions
where the processes influencing homicide rates have none. Second, homicide offenders are
likely to commit crimes near their homes, thereby creating a proximity effect. Finally,
interpersonal crimes, such as violent crime in general and homicide in particular, are based on
social interactions and are therefore subject to diffusion processes. To examine these trends,
the authors analyze measures similar to those used in the Sampson and Raudenbush (1997)
study, but use measures for individual census tracts in Chicago along with survey data tied to
those tracts. In their findings, tracts with high levels of collective efficacy but surrounded by
areas of low collective efficacy experienced significantly higher levels of crime than high
tracts surrounded by high values. Conversely, tracts with low values for collective efficacy
surrounded by tracts with high values had significantly lower crime than those with low
values surrounded by low values. In so doing, the authors show not only provided more
support for collective efficacy as a deterrent of crime, but also demonstrate that it is
fundamentally a spatial process (Morenoffet al.2001).
Social Networks as Obstacles to Collective Efficacy
One theoretical advantage of the collective efficacy turn is that it separates the
existence of social networks, social organization, and social capital from their ability to
normative capacity within the community. The need for such separation becomes apparent in
studies such as Patillo's (1998) study of middle class black neighborhoods in Chicago. Her
ethnography of the area uncovered a number of what in pure social disorganization theory
would be contradictions, where neighborhoods with very high levels of social organization
with strong desires to suppress crime end up unable to suppress crime because of the very
social networks that make them organized. In many cases, those working hardest to reduce
crime rates are tied into networks which also provide refuge for gang members, allowing
them to escape arrest and prosecution, because those gang members emerge from the same
strongly bonded community and are hence members of these networks.
Browning et al. (2004) examine this phenomenon, bringing to bear the full scope of
social disorganization theory. The authors identify two views of social networks, one in
which they suppress crime (following classic social disorganization theory), the other in
which they provide a means for cultural transmission and support of deviant behavior
(following both Wilson and Pattillo). In order to reconcile these, they build upon Portes'
framework for social capital to build a model of “negotiated coexistence,” under which the
dense social networks in the Chicago neighborhoods in question both attempt to enforce
social norms while protecting those connected to the networks from full enforcement. In
their statistical analysis (which also follows Morenoff et al. 2001 in including a spatial lag
component), the collective efficacy of a neighborhood is often impeded by the presence of
dense social networks. As such, the authors note that weak social ties, those of community
organization and not of kinship or institutional ties, may be more responsible for producing
collective efficacy than strong, dense social ties (Browninget al.2004). This model of social
produced.
Order Maintenance and Social Disorganization Theory
One last theoretical variant of social disorganization theory comes from the order
maintenance policing strategy, also known as the “broken windows” strategy. While this
theory of crime emerged from criminology and police theory rather than social theory, its
widespread popularity and controversial nature has lead to substantial research into its
claims, providing for further integration into the social disorganization literature. Here I
discuss order maintenance policing and its implications for social disorganization theory as a
whole.
While many of the same ideas existed in criminological literature before its
publication, “Broken Windows: the police and neighborhood safety,” the 1982 article by
Wilson and Kelling in the Atlantic Monthly is most often cited as the seminal article on
reduction of serious crime through order maintenance. In it, Wilson and Kelling develop a
narrative of a national police force that had become more focused on solving individual
crimes and making subsequent arrests, rather than a more general duty of maintaining order
on the streets and other public places. Both physical disorder – graffiti, damaged property,
and actual windows that are broken – and social disorder – aggressive panhandlers, public
drunkenness, solicitation for prostitution, and youth congregating on street corners – become
hallmarks of “no one caring” in a community, and therefore lead to a rise in serious crimes
such as assaults, robberies, and burglaries (Wilson and Kelling 1982).
As a conversational article rather than a logically strict publication, “Broken
Windows” either directly identifies or implies several links between disorder and other
directly leads to increased crime, and at others imply that disorder is part of a spiral of
decline that feeds off of and contributes to both crime and fear of crime. In the following
passage, Wilson and Kelling imply a strong link between disorder and fear of crime:
At this point [the neighborhood experiencing heightened disorder] it is not inevitable that serious crime will flourish or violent attacks on strangers will occur. But many residents will think that crime, especially violent crime, is on the rise, and they will modify their behavior accordingly. They will use the streets less often, and when on the streets will stay apart from their fellows, moving with averted eyes, silent lips, and hurried steps. “Don't get involved.” (Wilson and Kelling 1982, p32)
As advocates of a particular change in policy rather than the specifics of social theory,
Wilson and Kelling left the pathways and mechanisms of these impacts ambiguous, which, as
I discuss below, has caused some confusion and debate as to what constitutes the true
“broken windows” thesis for order maintenance.
Early empirical support for order maintenance and policy implementation
The theory initially enjoyed a positive reception among both social researchers and
policy makers. While limited research throughout the 1980's endorsed the concept
(Sampson and Cohen 1988), Skogan's 1990 work offered an empirical foundation for the
theory. Skogan aggregated survey data from neighborhoods inside four US cities, deriving
measures of disorder and of crime victimization from these data. Using simple regression
techniques, Skogan identified positive relationships between disorder and victimization rates
due to robbery and burglary, and negative relationships with neighborhood satisfaction and
intent to remain in the neighborhood. Surveying these data, Skogan declared that “broken
windows need to be fixed.” (Skogan 1990) Supporters of order maintenance policing quickly
cited Skogan's study, claiming it “established the causal links between disorder and crime –
Meanwhile, the proponents found converts among prominent policy makers,
particularly William Bratton, first of the New York City Transit Authority Transit Police
Department and later of the New York Police Department. Bratton embraced the notion of
order maintenance policing, first in his “take back the subway” campaign, and later in his
“quality-of-life” policing effort as head of NYPD. Each campaign targeted both physical
disorder, in the form of graffiti and vandalism, as well as social disorder, tackling aggressive
panhandling, loitering, vagrancy, prostitution, and other forms of aggressive solicitation.
Subsequent to the implementation of policies that targeted these forms of disorder, crime of
all levels fell, including assaults and robberies not explicitly targeted by the order
maintenance functions of the police. Proponents cited these gains as further evidence of the
efficacy of the order maintenance program (Kelling and Coles 1996).
Critiques of order maintenance policing
The primary critique of order maintenance policing came from Harcourt, who
challenged the assertions of what Kelling calls the “Broken Windows hypothesis.” Primarily,
Harcourt re-analyzed the data used in Skogan's 1990 work, and discovered that in many
cases, the correlation coefficients reported by Skogan lacked statistical significance, and that
all effects disappeared when the data from Newark, NJ were removed from the study, under
suspicion of different circumstances under which they were collected. Harcourt also
dismissed the declining crime rates in New York City, noting that many other cities around
the United States achieved equal or greater drops in crime without implementation of order
maintenance policing. Harcourt credits these drops instead to enhanced reporting, a national
increase in police officers under the COPS program, increased use of GIS technology for
Harcourt strongly refuted Kelling and Cole's assertion that existing studies such as Skogan’s
proved the “Broken Windows” hypothesis of a strong causal link between disorder and crime,
and expressed strong doubt that such a causal link existed (Harcourt 2001). Additionally,
Harcourt criticized the social norms of order enforced by order maintenance policing as
“subject creation,” in the terms of Foucault, claiming that these norms were subjectively
created, and were not appropriate for basing legal policy upon (Harcourt 1998, Harcourt
2001).
In response, Thatcher (2004) has argued that while Harcourt's critiques cast doubt on
the strongest versions of the order maintenance hypothesis, this does not in and of itself
preclude the value of order maintenance in general. In drawing a parallel with racial school
integration, Thatcher points out that while predictions for improved performance from
minorities upon which much of the justification for the integration was founded failed to
materialize, the policy of integration was a good one. In turn, he argues, decreasing disorder
has value of its own beyond its ability to suppress violent crime. He also disputes the
relevance of Harcourt's Foucauldian analysis, agreeing that social norms are constructed but
arguing that this does not detract from their validity or importance (Thatcher 2004).
Further empirical work and integration with social disorganization, collective efficacy
At the same time, several researchers attempted more robust studies of the links
between disorder and crime. Most found some correlation, but found that social
disorganization, socioeconomic factors, and social capital were much more strongly linked,
with disorder having little or no causal impact on crime levels. (Borooah and Carcach 1997,
Sampson and Raudenbush 1999) Increasingly, instead, social research began to find disorder
disorder directly acting as an in-line causal actor of crime itself. (see Thacher 2004 for a
review) Alternately, a new formal model began to emerge with roots in the social
disorganization literature, regarding disorder as part of a cyclical feedback loop, feeding on
crime and a third factor, of which social disorganization was a part. Sampson and
Raudenbush (1999) identified this third factor as collective efficacy, integrating the disorder
dialog with their conception of collective efficacy.
The Sampson and Raudenbush paper represents the strongest empirical examination
of both social disorganization as well as physical and social disorder yet published. At the
core of the study was a methodology of systematic social observation (SSO), conducted by
videotaping 23,816 face blocks in Chicago and then coding a selection of them for aspects of
physical and social disorder. These data were compared against a neighborhood-level survey
of both crime victimization as well as neighborhood connectivity, expectations of social
norms, and opinions of local delinquency. Additionally, exogenous factors such as land use
patterns and concentrated disadvantage were aggregated from census data. The authors found
little support for a strong causal link between disorder and crime rates. Instead, collective
efficacy appeared to have a greater impact on crime reduction. Furthermore, the authors
found limited support for a three-way circular model, in which social disorder, crime rates,
and collective efficacy act in a positive feedback loop (Sampson and Raudenbush 1999).
A follow-up work by the same authors using a new analysis of the same data
introduced more theoretical concerns for just how disorder impacts both social organization
and crime. Using the data from the systematic social observations described above, the
authors compared perceptions of disorder in survey responses with their own quantified
quantified disorder were very weakly correlated. Instead, perceptions of disorder among both
black and white residents were higher in predominantly black areas and lower in
predominantly white areas. The authors contend that this demonstrates how racist
preconceptions of urban areas may be internalized by both white and black residents, and
may contribute to perpetuating urban inequality (Sampson and Raudenbush 2004).
A Missing Link: Community Development
For all of the various theoretical strands which have gone into social disorganization
literature, precious little research has sought to understand what strategies for building social
capacity within a neighborhood would likely yield the best results, and to what degree
community development efforts have been successful in this regard. Much of the basis of
community development springs from works such as those of William Julius Wilson (1987,
1996), as an attempt to ameliorate the problems of concentrated disadvantage. Out of this,
discussions have emerged regarding community capacity building, involving practical
techniques for how to make community building work (see Chaskin 2001 for a review). This
conversation about capacities has started to absorb dialogs of social capital and social
networks (Chaskin 2001). Additionally, Fraseret al.(2002) have examined how community
building has come to dominate narratives of neighborhood revitalization, and how these
narratives may create problems of inequalities of benefits (for an additional review, see
Fraser 2005). Community development has also been criticized as a means for continued
devolution of state responsibility (Herbert 2005). However, theoretical links between
community capacity and concepts such as social disorganization and collective efficacy
Moving Forward with Social Disorganization
Modern social disorganization embraces a broad and diverse array of theoretical
perspectives, which is perhaps not surprising given its age and the amount of attention it and
related fields have seen over the past few decades. While much has already been written
regarding new directions in social disorganization theory, I wish to highlight three points
which emerge from the best of recent literature. First, while multiple authors have recently
noted the importance of incorporating spatial effects in social disorganization research
(Kubrin and Weitzer 2003, Thatcher 2004), as a point of focus it is important enough to bear
repeating. The Morenoff et al. (2001) study clearly and dramatically demonstrated how
much impact spatial effects may have. Additionally, the emergence of a wide variety of new
spatial techniques (some of which are discussed in the following chapter) provide for robust
new methods to examine these effects. While this study lacks the scope to comprehensively
address the full scope of social disorganization theory, I intend it as a first step in that
direction in examining these.
Secondly, while the theoretical vagueness of collective efficacy may frustrate attempts
to create parsimonious models of the social processes behind it, I argue that it represents a
strong organizing principle for practical empirical research in social disorganization. The
work of Sampson and others has demonstrated collective efficacy as a quantity which is both
easily measurable using survey data and which strongly correlates to reduced crime. As such,
the concept rests at the fulcrum point between crime and social networks. On the one side,
there remains a broad range of questions regarding the mechanisms through which collective
efficacy reduces violent crime, following the path that Browning et al. (2004) have taken.
social organization combine to produce collective efficacy. One of the outstanding questions
behind order maintenance policing strategies remains whether these strategies reduce crime
because of the increased willingness of the community to suppress crime in the face of
reduced disorder or because of simple increased enforcement and the use of “broken
windows” to justify harsher police tactics. A simple question in this regard would be to
examine how measures of collective efficacy changed from before a broad scale order
maintenance police initiative to after it, and examine how those changes correlated with
drops in crime.
More directly relevant to the purposes of this study, there remains the question of how
community development may work to decrease crime. If collective efficacy truly does
represent a major point of interaction between social norms and violent crime, a major
concern of community development strategies should be how any interventions to build
community impact collective efficacy, if the goal is to reduce crime. Additionally, given the
operational differences which are shown above to emerge between strong social ties and
weak social ties, developing an understanding of how community building functions in
relation to these ties could help to improve the effectiveness of future efforts. Taken as a
whole, a social disorganization dialog which focuses on these three directions should produce
knowledge which not only illustrates under-theorized yet important social processes, but
should also provide guidance to the ways in which attempts to control crime through
community measures may maximize the results of their efforts.
A Study of Durham, NC – HOPE VI and Violent Crime
This study examines how a neighborhood revitalization effort in Durham, NC, funded
violent crime within the central city. Here I briefly detail the HOPE VI program and the
study site. Methodologies for examining these changes and specific methods used in this
study are discussed in the second chapter.
HOPE VI
In 1992, the United States Congress appropriated funds to create what would become
the HOPE VI program of the federal Department of Housing and Urban Development
(HUD), to address “severely distressed public housing” through a comprehensive program of
demolishing the worst housing complexes and rebuilding more dispersed, mixed-income
units in their places (NHLP 2002). The goals of the project included “changing the physical
shape of public housing” and “lessening concentrations of poverty by placing public housing
in nonpoverty neighborhoods and promoting mixed-income communities.” As of 2002, over
70,000 public housing units had been demolished under the HOPE VI program in over 250
projects around the country (NHLP 2002). Supporters credit the program with helping
“transform the physical and social landscape of some of the nation's toughest neighborhoods,
creating markets where there were none” (Cisneros and Katz 2004), while critics charge that
it “has been the source of new problems as serious as those it was created to address,”
including a shortage of public housing and exclusion of input from residents (NHLP 2002).
Few Gardens and the Durham HOPE VI Project
In August of 2000, HUD awarded a $35 million grant to the Durham Housing
Authority (DHA) for the redevelopment of a 96 block area in northeast-central Durham,
surrounding the 50-year old Few Gardens public housing complex. The winning grant was
celebrated among local politicians as a means for reducing crime in the area (Dainow 2000).
two shooting incidents in the area, one resulting in the death of a two-year old, the other in
the paralysis of a five-year old (Wise 2003). Even today in its marketing materials, the
Durham HOPE VI project cites “A Safe and Secure Neighborhood” as one of its four major
goals for the project (DHA HOPE VI website). The most dramatic evidence of work on the
project took place in July 2003, when DHA demolished the Few Gardens complex, and again
local leaders cited the importance the project would have in increasing safety in the
neighborhood (Bridges 2003a, 2003b).
Crime Displacement
With crime such a major reason why DHA targeted Few Gardens for demolition, we
raise the question of how crime rates have changed from before the demolition to after it.
Creating “A Safe and Secure Neighborhood” tops the list of “Revitalization Principles” in the
Durham HOPE VI Revitalization Plan (DHA 2002). However, displacing a large segment of
residents who have been victims and potentially perpetrators of crime to other areas of the
city which are marginally improved yet still have average incomes below the citywide
average may simply move the same crime to other parts of the city. The city of Durham is
unlikely to view the project as a success if it makes one neighborhood safer at the cost of
making other neighborhoods more dangerous. One major question hanging over the
revitalization effort must then be, how much are gains, if there are any, at the HOPE VI site
offset by increased crime elsewhere in the city?
One previous study has examined how the spatial pattern of crime has changed
surrounding a HOPE VI project. Suresh (2000) used crime victimization data and basic hot
spot detection to examine how the spatial patterns of aggravated assault, homicide, and rape
housing complex and reconstruction of mixed income housing under the HOPE VI program.
While crime in the Park Duvalle neighborhood in Louisville, Kentucky declined
significantly, multiple smaller hot spots of crime sprung up in other parts of the city. This
change in patterning does not lead to easy conclusions – on the one hand, a decline of
massively concentrated crime within a small area may make the problem significantly more
manageable, but on the other hand, it is not the goal of HOPE VI to simply recreate similar
problems in other parts of the city. It bears noting that while the Park Duvalle project in
Louisville took place much earlier than the Few Gardens project in Durham, the construction
and physical development portions of both projects were executed by the same firm, The
Community Builders.
Understanding the Character of Changes in Spatial Pattern
Given that the HOPE VI project fundamentally addresses environmental impacts on
crime and not individual aspects such as offenders, I maintain that any changes in crime
patterning are best understood under the constraints of social disorganization theory. In an
ideal situation, an examination of these changes would incorporate measures of how social
organization, social networks, collective efficacy, and any number of other factors changed
over the course of the HOPE VI redevelopment, and would incorporate more complex
models of why change occurred. These analyses, however, are beyond the scope of this
study. Instead, I aim to use the tools of spatial analysis to help characterize and understand
the nature of the spatial changes in violent crime which occurred during the HOPE VI
redevelopment project, and then to examine this characterization in the spatial context of the
2.Methods and Methodology
In order to examine how the HOPE VI project has impacted the spatial distribution of
violent crime, I examine the basic patterning in univariate statistics across space, in the
context of qualitative knowledge about the actions in that space. As such, the fundamental
methodology here uses quantitative methods to illustrate the patterns, and then examines the
areas identified as significant in a qualitative context. In this chapter, I first discuss
techniques used in crime mapping and in spatial statistical analysis from a theoretical
perspective, focusing on methodological issues which arise when performing these analyses.
I then detail the specific steps used in the collection, preparation, and processing of data for
the purposes of this study. Results and conclusions are discussed in the subsequent chapter.
Spatial Statistics, Spatial Analysis, and Urban Crime – A Methodology
As Paez and Scott (2004) note, “A characteristic of most urban processes is the fact
that they are intrinsically spatial and, moreover, space-dependent” (Paez and Scott 2004,
p54). Urban crime is clearly no different. The technological advances of the last two
decades have permitted an explosion of new techniques as well as data available for use in
urban analysis. One of the most important developments for the analysis of crime has been
the emergence of statistics which examine both patterns across the full extent of a study area
and localized variations in those patterns.
Using GIS and Spatial Analysis to Examine Crime
Sideris (1999) used spatially paired blocks to examine differences in the physical
environment between high crime and low crime bus stops. Wang and Minor (2002)
examined the relationship between the spatial distribution of employment, access to
employment, and crime. Ceccato and Haining (2004) examined crime in relation to political
borders, specifically how transportation nexi and proximity to borders may increase the
incidence of crime by providing avenues for evasion of law enforcement. Additionally, the
past decade in particular has seen a great increase in the use of new technologies such as GIS
for the analysis of crime and increased efficacy of policing. (Lochner and Zietsman 1998,
Craglia, Haining, and Wiles 2000, Garson and Vann 2001, Vann and Garson 2001)
Application of spatial techniques to the questions of social and physical disorder,
social disorganization and collective efficacy, and crime victimization has been less
widespread. Doran and Lees (2005) applied GIS techniques to the impacts of physical
disorder on crime and fear of crime in Australia, focusing particularly on temporal effects.
Matei, Bali-Rokeach, and Qiu (2001) built upon the work of Lynch (1960) and Gould (1966)
to use mental mapping techniques to construct maps of fear of crime in Los Angeles. The
authors collected a survey on crime and avoidance which included a color-in map of the city
where respondents could indicate the level of fear they felt in that area using various colors.
Color values were scored, allowing a composite surface of generalized and subdivided fear of
crime to be created (Matei, Bali-Rokeach, and Qiu 2001).
One particularly promising avenue of research has focused on land use and crime.
Kurtz, Koons, and Taylor examined the relationship between commercial vs. residential land
use, physical deterioration, and resident controls on crime and calls for service. Among the
calls for service, and higher levels of reported crime victimization. (Kurtz, Koons, and
Taylor 1998) In contrast, among the findings of the landmark Sampson and Raudenbush
study were that blocks with mixed land uses were positively correlated with increased
disorder, but often negatively or uncorrelated with crime rates. (Sampson and Raudenbush
1999) Wilcox et al. (2004) went a step further past Kurtz, Koons, and Taylor and examined
to what degree disorder may mediate the impact crime-related impact of public land uses,
such as commercial areas, schools, playgrounds, and open space. Using survey data to
quantify physical disorder and neighboring between residents, the authors tested various
models of crime impacts using officially reported crime data. The findings were remarkably
mixed – the impact of businesses upon assaults and burglaries was partially mediated by
physical disorder, whereas the impact of open spaces such as parks and plazas was partially
mediated by neighboring, but also by income level. (Wilcox 2004)
Univariate Statistics for Local Spatial Cluster Analysis
Before the advent and then widespread availability of Geographic Information
Systems (GIS), the computation required for most spatial statistics made all but the simplest
forms prohibitively expensive to calculate. As such, examinations of spatial pattern were
limited to relatively rudimentary comparisons of observed values versus those expected
under a random distribution, such as nearest neighbor comparisons and presence/absence
scores in a spatial grid of quadrats. With the advent of greater computational capacity, as
well as increased facilities for locating data points on a coordinate grid system such as the
Global Positioning System and easy access to address geocoding, the field of spatial statistics
has seen considerable advancement.
between data observations. This is usually accomplished with a matrix of values indicating
the association between two observations, as in the well known Moran's I statistic of spatial
autocorrelation:
I= n
∑
i∑
j wij∑
i∑
jwij xixj
∑
i
xi2 (1)
Here, n indicates the number of observations, x^
i indicates the deviation from the
mean at theith observation, and the weights matrixwijholds a value for the relation of thejth
observation to theith observation. In its most primitive form, this weights matrix may hold a
1 for positions involving two adjacent observations, and a 0 for positions involving
non-adjacent observations. A range of more advanced forms exist to permit relations between
non-adjacent observations, including, perhaps most commonly, using the inverse of the
distances between all sets of two relevant points as the weights.
While the Moran's I provides a measure of the total spatial autocorrelation for the
dataset, low values of I may fail to represent patches where similar values are clustered
within the overall data set. It is these local patches, or local spatial clusters, which the
statistics addressed here attempt to locate and represent.
The Getis-OrdGi(d)Statistic of Local Spatial Clustering
The basic Gi(d) statistic (see equation 2), as defined by Getis and Ord (1992),
examines localized aspects of the degree to which values spatially proximate to a focal value
Gi=
∑
j=1 n
wijxj
∑
j=1 n
xj
(2)
Because it is locally calculated, the statistic may illustrate patterns of clustering in
data sets which Moran'sIcannot differentiate from a random distribution. And although the
statistic is only strictly normally distributed when the underlying population follows the
normal distribution, it approaches normality as the number of data values used to calculate
each local statistic increases, thereby allowing significance testing withZ-scores. Under the
Gistatistic, the weights matrix is required to contain zeros for values representing each
point's spatial association with itself. TheGi*statistic, on the other hand, permits each
point's value to be incorporated into calculation (Getis and Ord 1992). The practical
implication of this is that theGi*statistic should be used when the focal point should be
considered part of the spatial clustering, and is hence more widely used.
The initial formulation of the statistic required a symmetrical binary matrix, with
weights of 1 indicating either adjacency between two values or indicating a spatial distance
smaller than some threshold (Getis and Ord 1992). However, a later revision of the statistic
broadened it to permit weights matrices with non-binary values (Ord and Getis 1995). I
discuss the selection of an appropriate weights matrix in more detail below.
The LISA Decomposition of Moran's I
Following the spirit of theGiandGi*statistics, Anselin (1995) defined a new class of
statistics, called Local Indicators of Spatial Association, using the following criteria:
a) the LISA for each observation gives an indication of the extent of significant spatial
a) the sum of LISAs for all observations is proportional to a global indicator of spatial
association. (Anselin 1995)
Anselin also provided a general form for these statistics to take, then noted that
several existing global statistics of spatial association could be decomposed into their local
parts using this form. He also provided local decompositions of both Moran'sIand Geary'sc
using this method. Specifically, the local Moran is defined as follows:
Ii=zi
∑
jwijzj (3)
This statistic provides a mechanism for identifying localized areas of high spatial
autocorrelation within a dataset. Anselin also notes that the statistic can be used similarly to
the Gi*for locating clusters of high association (Anselin 1995).
Properties of Gi*and Local Moran'sI
It is important to note that while theGi*and local Moran measure related quantities
and may produce similar results, the underlying properties that they measure differ in nature.
TheGi*quantifies the degree to which nearby values vary to each other in relation to the
overall variance in the global set of values. The local Moran quantifies the degree to which
the set of nearby values vary from the focal value in relation to the degree to which the set of
global values vary from the focal value. In practice, if localized patterns of spatial
association are present and the trends largely continuous, theGi*and localIshould identify
roughly similar areas.
Additionally, the two statistics differ in the interpretation of high and low values.
While in both cases extremes of high or low values indicate strong trends, the specific
Z-score test of significance indicates the direction of the clustered trend. HighGi*scores
indicate above-average values clustered more tightly than would be expected given a random
distribution, whereas lowGi*scores indicate either clusters of below-average values, or the
presence of above and below average values packed tightly together. As such, the sign of the
Gi*Z-score illustrates the difference between clusters of low and high values, but there
remains confusion with low scores as to the nature of the clustering (Getis and Ord 1992). In
contrast, high local Moran's scores indicate that the surrounding values are more like the
focal value, high or low, whereas low local Moran's values indicate that the surrounding
values are less like the focal value than a random distribution would predict. As such, the
local Moran solves the issue of determining whether extreme scores are caused by like
pairings or dislike pairings, but do not address whether the values themselves are higher or
lower than expected (Anselin 1995). For each statistic, the underlying confusion may be
resolved with a re-examination of the original data. Still, based on the differences in what
each statistic measures, I assert that there is value in calculating both scores for a given data
set, as the similarities and differences between the results may be illustrative.
Issues With Spatial Analysis
The calculation of local spatial clustering statistics requires a number of decisions for
which there are not yet established best practices. I discuss here the modifiable areal unit
problem, issues involving the selection of the weights matrix, and issues regarding
incorporating population data into crime statistics.
The Modifiable Areal Unit Problem
While starting with point data provides flexibility with regards to the selection of
Concern with this problem stems from the infinite number of arrangements of areal units into
which the point data could be aggregated, and potential biases which may emerge based on
the set of areal units chosen for analysis. In general, an acceptable set of areal units should
minimize variance within units at the desired scale of analysis, while still having sufficient
numbers of units with high enough counts to provide meaningful variance between units.
Areal units which are too high in number and too small in size will result in few units having
high values, and an overabundance of units with small or zero values. As a result, the high
number of units with small values will dilute the effect to the point that meaningful patterns
become lost. While no hard and fast rules exist for determining the proper number of units,
one rule of thumb for aggregated statistics states that the mean number of points per areal
unit should be greater than two (A. Moody, pers. comm.).
Additionally, variation in the size and shape of the areal units within a single
arrangement may create bias in the statistical results. Larger areal units will naturally tend to
have greater inter-centroid distances and a greater number of adjacent units than small units,
as well as tending to include a greater number of points than smaller units, even when points
are randomly spatially distributed. Units which are elongated or concave will also tend to
have a greater number of adjacent units, and calculating distances between irregular units and
other units will yield different results, depending on whether inter-centroid distances or
edge-to-edge distances are used. However, if the underlying process is spatially heterogeneous,
enforcing a rigid areal unit system will result in many empty units and a few densely packed
units.
Much research has gone into potential effects caused by the MAUP and potential
study, I have elected to use two different areal unit schemes. First, I aggregate all points
representing reported violent crime by census block. There are two major advantages to
using census blocks. First, some limited demographic data, including residential population,
are readily available on a per-block level. Second, the blocks themselves already vary in size
and shape according to the density of residential and commercial development, which
functions moderately well as a crude predictor of the population exposed to risk of violent
crime in that area. Areas of dense population or commercial development tend to have small,
tightly clustered census blocks, while large undeveloped or sparsely developed areas will
have larger, sprawling census blocks.
However, the irregularity of census blocks introduces an element of uncertainty into
any statistic which uses them as areal units, as discussed above. In order to check for bias
created by this irregularity, I also aggregate all crime locations to a regular lattice of uniform
square cells. The regularity of shape and size of the cells removes a potential source of bias
from the calculations. However, due to the patchy nature of residential development in
central Durham, the lattice would necessarily create equally sized zones in densely packed
neighborhoods as in protected natural areas or large tracts of warehouse and industrial sites
with little daily population. The contrast between the census blocks and the regular lattice
allows for exploration of biases generated by each.
Selecting an Appropriate Weights Matrix
For all spatial statistics, a major challenge not normally present with non-spatial
statistics is finding a simple quantifiable way of representing the spatial association between
all observations. In raster data, the association can be inferred by selecting a window around
However, in data sets where areal units may be differently sized and spaced, these distances
must be formalized and incorporated into the calculation of the statistic. For most spatial
statistics, including the ones used in this study, this comes in the form of a distance weights
matrix in which each element holds a value representing the unidirectional association
between a pair of observations.
In its most basic form, this weights
matrix may hold a simple value indicating the
presence or absence of adjacency between
observations, in the form of a 1 for two adjacent
areal units and a 0 for non-adjacent areal units.
The symmetrical binary weights matrix may also
be used to denote areal units which fall within a
given distance of each other, with no
differentiation of weight based on distance (Getis
and Ord 2002). Non-binary weights matrices
may also be used to represent a more complex
underlying spatial association (Ord and Getis
1995). While a wide range of different schemes
have been used, ranging from simple derivations
to complex formulas (see Box 1), Getis and Aldstadt (2004) caution that in all cases the
weights matrix should be established with some theoretical justification of the spatial
associations underlying it.
Table 1 Established methods for constructing a weights matrix for spatial association, after Getis and Aldstadt (2004)
• spatially contiguous neighbors
• inverse distances raised to some power
• lengths of shared borders divided by the
perimeter
• bandwidth as thenthnearest neighbor
• ranked distances
• constrained weights for an observation equal
to some constant
• all centroids within distanced
• nnearest neighbors
• bandwidth distance decay
• Gaussian distance decline
• “tri-cube” distance decline function
Normalizing Crime Rates By Population
While researchers often have a reflexive tendency to want to adjust the rates of
occurrence for events such as crime to population, the core methodological reasons for doing
so may be overlooked. Fundamentally, the justification for examining these per-population
rates comes from the demographic concept of risk, initially developed to examine mortality
rates. When the concept of risk is adapted to other events, however, care must be taken to
ensure that the risk rates are only calculated for the population exposed to the risk, that any
proxies used for calculation do in fact provide good estimates of the at-risk population, and
that duration of time an individual is exposed to the risk be taken into account (Prestonet al.
2001).
For certain crimes, particularly residential burglary and home invasion, measures of
the vulnerable population are easy to derive, because they will align closely with the
residential population of an area, for which census data are available. However, for other
crimes, such as violent crime, where people are as likely or more likely to be victimized
outside of the home, such as on the street or at commercial or employment centers, measures
of residential population often do not reflect the vulnerable population, particularly at fine
scales such as block groups and blocks. For instance, areas with high density retail
development may draw thousands of people a day, during which time they may be at risk of
violent crime, but census data from a block which only includes commercial development
will indicate that the population is zero.
Multiple methods have been developed to address this difficulty in assessing the
vulnerable population. One technique is to apply the average population per unit area from a