Journal of Chemical and Pharmaceutical Research
__________________________________________________
ISSN No: 0975-7384 CODEN(USA): JCPRC5
J. Chem. Pharm. Res., 2010, 2(3):304-311
304
Improved dissolution rate of Atorvastatin calcium using solid dispersions
with PEG-4000
Lakshmi Narasaiah.V1, Kalyan Reddy.B1, Raj Kumar.M1, Kiran Kumar.A1, Raju.Ch2, Sanjeeva Kumar.A3 and Venkateswara Reddy.B4
1
Dr. Samuel George Institute of Pharmaceutical Sciences, Markapur, A.P
2
Department of pharmacy, Kakatiya University, Warangal, A.P.
3
Vaagdevi College of pharmacy, Warangal, A.P.
4
St.Pauls College of pharmacy, Hyderabad, A.P.
______________________________________________________________________________
ABSTRACT
The solid dispersion was defined as the dispersion of one or more active ingredients in an inert carrier or matrix. The purpose of the study was to improve the physicochemical properties of Atorvastatin calcium (ATC) like solubility, dissolution properties and stability of poorly soluble drug by forming dispersion with PEG 4000 as water soluble carrier. ATC was formulated by physical mixtures and solid dispersions (dropping method) using 1:1, 1:2 and 1:3 ratios of drug and carrier (PEG 4000). The Phase and saturation solubility study, in vitro dissolution of pure drug, physical mixtures and solid dispersions were carried out. The prepared dispersions showed PEG was found to be effective in increasing the saturation solubility and dissolution rate of ATC than that of pure drug. The dispersion with PEG 4000 (1:3) by dropping method showed faster dissolution rate (85.038%) as compared to other dispersions with PEG 4000 (1:1 and 1:2) whichever prepared by physical mixture and dropping method. The FT-IR shows the complexation and there were no interactions. Finally solid dispersion of ATC: PEG 4000 prepared as 1:3 ratio by dropping method showed excellent physicochemical characteristics and was found to be described by dissolution release kinetics and was selected as the best formulation in this study.
Key words: Atorvastatin calcium (ATC), solid dispersion, dropping method and poly ethylene
glycol (PEG) 4000.
305
INTRODUCTION
The aqueous solubility lesser than 1 µg/ml will definitely creating a bioavailability problem affecting the efficacy of a drug. Up to 40 percent of new chemical entities discovered by the pharmaceutical industry today are poorly soluble or lipophilic compounds. The solubility issues complicating the delivery of these new drugs also affect the delivery of many existing drugs [1]. Poorly water-soluble drugs show unpredictable absorption, since their bioavailability depends upon dissolution in the gastrointestinal tract [2, 3, 4]. The dissolution characteristics of poorly soluble drugs can be enhanced by several methods [5, 6, 7]. Lipophilic molecules, especially those belonging to the biopharmaceutics classification system (BCS) class II and IV, dissolve slowly, poorly and irregularly, and hence pose serious delivery challenges, like incomplete release from the dosage form, poor bioavailability, increased food effect, and high inter-patient variability [8].
Alteration of the solid state at the particle or molecular level involves a physical change in the drug and is an attractive option for improving drug solubility [9]. Particle size reduction by micronization or nanonization can enhance the dissolution rate; however, the apparent solubility remains unaltered. At the molecular level, polymorphs offer a limited solubility advantage because of a small difference in free energy. In contrast, amorphous systems with excess thermodynamic properties and lower energetic barrier can offer significant solubility benefits [10]. This solubility benefit can be further enhanced by preparing solid dispersions (SDs). SDs contributes by slowing devitrification, enhancing wettability and modulating the properties of the solvent [11]. Solid dispersions (SDs) with superior pharmaceutical properties can be formulated into suitable dosage forms especially for geriatric population which exhibits variable drug responses due to many age related physiological changes coupled with disease states. Geriatric patients with lower GI motility and gastric emptying, fluctuating gastric pH and reduced intestinal blood flow rate exhibit variable absorption upon administration of solid dosages forms. Solid dispersion is one of the effective and widely used techniques for dissolution enhancement [12]. The two basic procedures used to prepare solid dispersions are the melting or fusion [13] and solvent evaporation techniques [14].
Atorvastatin Calcium is an Anti-hyper lipidemic agent and is used in the treatment of obesity and is a selective, competitive inhibitor of HMG-CoA reductase, the rate-limiting enzyme that converts 3-hydroxy-3-methylglutaryl-coenzyme A to mevalonate, a precursor of sterols, including cholesterol. By inhibiting de novo cholesterol synthesis, they deplete the intracellular supply of cholesterol [15].
306
EXPERIMENTAL SECTION
Materials
Atorvastatin Calcium was a gift sample from Dr.Reddy’s lab, Hyderabad, poly ethylene glycol 4000 was purchased from Merk, Mumbai, Potassium dihydrogen orthophosphate (Qualigens fine chemicals, Mumbai), Sodium hydroxide (Finar chemicals ltd. Ahemdabad) and methanol (Research-Lab fine chemicals industries, Mumbai). All required chemicals were analytical grade.
Methods
Preparation of Physical Mixture:
Physical mixtures of ATC at three different mass ratios with carrier (1:1, 1:2 and 1:3) were prepared in a glass mortar by light trituration for 5 minutes. The mixtures were passed through a
sieve (60). The prepared mixtures were then filled in hard gelatin capsules, sealed and stored in a
dessicator until further use. The composition of F1, F2 and F3 formulations was shown in table
[image:3.595.108.507.314.374.2]no: 1.
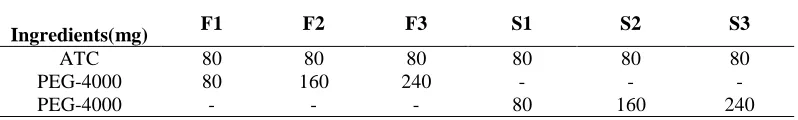
Table: 1 Composition of Atorvastatin Calcium Physical Mixtures and Solid Dispersions
Ingredients(mg) F1 F2 F3 S1 S2 S3
ATC 80 80 80 80 80 80
PEG-4000 80 160 240 - - -
PEG-4000 - - - 80 160 240
ATC: Atorvastatin Calcium; PEG: Poly Ethylene Glycol
Preparation of Solid Dispersion by Dropping Method:
For the preparation of the ATC solid dispersion prepared by dropping method, containing different weight ratios of ATC in PEG 4000. The composition of S1, S2 and S3 formulations was
shown in table no: 1. The PEG was melted in a porcelain dish at 580C (±10C) and a measured
amount of ATC was added and stirred. The melted drug-carrier mixture was pipetted and placed into an adjustable heating device to keep the temperature constant. The melted drug-carrier mixture was dropped onto a stainless steel plate, where it solidified into round particles. The
temperature of the stainless steel plate was <20 0C. The round particles (equivalent to 80 mg of
ATC) were placed into hard gelatin capsules (size no. 2) for further investigations.
Physicochemical Characterization Solubility Measurements:
Phase and saturation solubility studies were performed according to the method described by Higuchi and Connors (18).The saturation solubility of drug and SDs with PEG 4000 (1:1, 1:2 and 1:3 w/w) in distilled water and phosphate buffer (pH 6.8) was determined by adding an excess of drug and SDs to 50 ml distilled water or Phosphate buffer in conical flask and were
rotated in a orbital shaking incubator for 96 hrs at 37 0C ±0.5 0C. The saturated solutions were
filtered through a 0.45 µm membrane filter, suitably diluted with water, phosphate buffer and analyzed by Elico SL-150 UV spectrophotometer at 245nm.
FT-IR Spectroscopy:
307
Drug content analysis [19]:
The drug content in each solid dispersion and physical mixture was determined by the UV-Spectroscopic method. An accurately weighed quantity of solid dispersion or physical mixture, equivalent to 80 mg of atorvastatin calcium, was transferred to a 100 mL volumetric flask containing 10 mL of methanol and dissolved. The volume was made up to 100 mL with pH 6.8. The solution was filtered and the absorbance was measured after suitable dilutions by using Elico SL-150 UV-Spectrophotometer at 245nm.
In-vitro dissolution studies:
Dissolution rate studies were performed in pH 6.8 phosphate buffer at 37 ± 0.5 0C, using 8-station USP type-II apparatus with paddle rotating at 50 rpm. Solid products, solid dispersions as well as physical mixtures, each containing 80 mg of drug were subjected to dissolution. At fixed time intervals, samples withdrawn were filtered and spectrophotometrically analyzed for the drug content at 245 nm. Each test was performed in triplicate (n=3). Dissolution efficiency (DE) was calculated from the area under the dissolution curve at time t (measured using the trapezoidal rule) [20]. The similarity factor (f2) was evaluated to compare ATC release profiles.
f2 = 50 log {[1+1/n
∑
=
−
n
t
Tt Rt
1
)
( 2] -0.5×100}
Where Rt and Tt were the cumulative percentage of drug released for reference and test assay at time t respectively, n was the number of time points. The FDA suggests that two dissolution
profiles are declared to be similar if the value of f2 is between 50 and 100 [21].
RESULTS AND DISCUSSION
Solid dispersion of ATC containing varying concentration of PEG 4000 was formulated in an attempt to improve the solubility and dissolution rate of ATC. The ATC, physical mixture and solid dispersion were investigated by analytical method and IR spectra. The drug content in physical mixtures and solid dispersions was found to be in the range of 97.2% to 98.9%. Therefore, dropping method used in this study appears applicable for the preparation of solid dispersions without affecting drug content.
Solubility Studies:
The solubility of pure drug in water and in PBS (pH 6.8) was found to be 27.04 ± 0.56 and 57.06
± 0.67 µg/mL. The solubility of physical mixture prepared using PEG 4000 in the ratio (1:1, 1:2
and1:3) was 35.59 ± 1.12, 46.87 ± 1.24, 57.79 ± 1.35 µg/mL in water and 63.78 ± 1.19, 72.76 ±
1.21, 81.89 ± 2.35µg/mL in PBS. The solubility of SDs using PEG 4000 (1:1, 1:2 and 1:3) in water were found to be 36.22 ± 1.05, 48.86 ± 1.87, 58.92 ± 1.46 µg/ml and in PBS (pH 6.8)
65.12 ± 1.13, 73.52 ± 1.15 and 83.42 ± 1.76 µg/ml respectively. All of the test samples showed
an increase in drug solubility (Table 2). As the solid dispersion is a metastable form and tends to
transform in to the stable form, the drug concentration may tend to decrease with elapse of time during the solubility test. In order to avoid this problem all the solubility test samples of the different formulations were with drawn and analyzed at established time (96hrs). This allowed readily comparing the solubility of different solid dispersions. The solubility of different concentrations of drug and carrier was observed and the prepared formulation with PEG 4000 (1:3) presented higher dissolution concentration as compared with the other formulations obtained with different ratios (1:1 and 1:2). Maximum solubility in PBS was observed in
dropping method 1:3 (Drug: PEG 4000) ratio 83.42 ± 1.76 µg/mL, when compared with that of
308
Table: 2 Solubility studies of pure drug and solid dispersions
Formulation code
Solubility (µg/mL) Drug content (%)
Water PBS
Pure drug 27.04 ± 0.56 57.06 ± 0.67 95.56±0.023
F-1 35.59 ± 1.12 63.78 ± 1.19 98.75±0.126
F-2 46.87 ± 1.24 72.76 ± 1.21 98.27±0.072
F-3 57.79 ± 1.35 81.89 ± 2.35 99.16±0.042
S-1 36.22 ± 1.05 65.12 ± 1.13 99.54±0.083
S-2 48.86 ± 1.87 73.52 ± 1.15 97.78±0.024
S-3 58.92 ± 1.46 83.42 ± 1.76 99.69±0.011
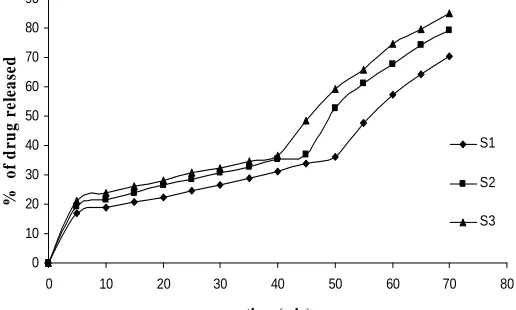
In vitro drug release studies:
The dissolution profiles of ATC for solid dispersion and physical mixture performed in 6.8 phosphate buffer were as shown in Table: 3.
Table: 3 In vitro dissolution data for pure drug, marketed tablet, physical mixtures and solid dispersions
Time (min)
Cumulative % drug released Pure
drug
Marketed
tablet F1 F2 F3 S1 S2 S3
10 15.633 21.84 17.428 19.853 22.632 18.824 21.513 23.705
20 20.175 25.807 21.698 24.515 26.915 22.422 26.503 27.987
30 23.197 30.728 25.867 28.977 30.718 26.702 30.577 32.448
40 26.898 34.935 29.595 33.485 34.207 31.217 35.221 36.614
50 30.883 50.477 34.020 45.123 43.318 36.247 52.813 59.397
60 35.261 63.052 45.501 57.642 58.891 57.340 67.764 74.554
70 51.006 77.222 56.844 69.113 79.923 70.575 79.060 85.038
The dissolution rate was significantly increased when the ATC: PEG 4000 ratio was at 1:3. The mean percentage of drugs for physical mixture after 70 minutes was 56.844, 69.113, 79.923% for 1:1, 1:2, 1:3 respectively as shown in Figure: 1 and 51.006%, 77.222% for pure drug and marketed tablet. But in the dropping method half fold increase in release rate was observed as 70.575, 79.060 and 85.038% respectively (Figure: 2) (This may be due to impact of complexation and bond formation. This may lead improved solubility by reducing particle size).
0 10 20 30 40 50 60 70 80 90
0 10 20 30 40 50 60 70 80
time (min)
%
d
r
u
g
r
e
le
a
se
d
F1
F2
F3
309 0 10 20 30 40 50 60 70 80 90
0 10 20 30 40 50 60 70 80
time (min) % o f d ru g r el ea se d S1 S2 S3
Figure: 2 Dissolution Profiles of Atorvastatin Calcium Solid Dispersions Formulated With PEG-4000
The drug release from all the formulations followed zero order kinetics. To analyze the mechanism of drug release from these formulations, the data were followed Hixson Crowell equation ({fraction unreleased} 1/3 vs. time). The release rate kinetic data & dissolution efficiency at 30 & 60 minutes (DE30 & DE60) for these formulations were given in table 4. The
slope values (n) obtained to decline between 0.5309 to 0.5557 for all formulations for the release of ATC, indicating non-fickian diffusion. The dissolutions profile showed in (figure: 3) and
similarity factor (f2), these two formulations were found to be 84.83% indicating the significant
[image:6.595.177.435.76.231.2]differences in between the selected (S3) and marketed tablet (Lipitor).The drug release from different formulations followed the order: S3>S2>S1. The above results indicated that the increasing concentration of PEG-4000 content enhanced the drug release.
Table: 4 Dissolution Kinetics of Atorvastatin Calcium Physical Mixtures and Solid Dispersions Formulated With PEG-4000
Formulati on code
Correlation Coefficient (R2)
Slope
(n) DE30% DE60% Zero
order
First
order Higuchi Peppas
Hixson- Crowell
F1 0.9416 0.9091 0.9195 0.9078 0.9394 0.4692 18.51 25.49
F2 0.9526 0.9257 0.9281 0.9185 0.9558 0.5235 20.83 30.48
F3 0.9638 0.8790 0.8956 0.8815 0.9068 0.4833 23.22 31.77
S1 0.9420 0.9110 0.8951 0.8949 0.9285 0.5309 19.51 28.09
S2 0.9530 0.9180 0.9035 0.8991 0.9391 0.5535 22.48 33.58
S3 0.9787 0.9157 0.9105 0.8983 0.9628 0.5557 24.36 37.05
Marketed 0.9474 0.9221 0.9131 0.8969 0.9410 0.5183 22.63 32.89
*DE30 and DE60, dissolution efficiency at 30 and 60 minutes.
0 10 20 30 40 50 60 70 80 90
0 10 20 30 40 50 60 70 80
Time (min) % D r u g R e le a se d
Pure Drug Marketed S3
310
FT-IR Spectroscopy studies:
The FT-IR spectra of pure ATC and solid dispersions are shown in Figures 4 & 5. The FT-IR
spectra of pure ATC showed characteristic peaks at 2955.15 cm-1 (C-H - stretching), 1313.56 cm
-1
(C-N - stretching), 3059.15 cm-1 (C-HO - stretching alcoholic group), 1564.97 cm-1 (C=O -
stretching amidic group), 3403.27 cm-1 (N-H - stretching), 1656.97 cm-1 (C=C - bending), 751.62
cm-1 , 696.95 cm-1 (C-F - stretching), 1104.39 cm-1 (O-H - bending). It might be the possibility of intermolecular hydrogen bonding between adjunct ATC molecules. The spectrum of pure ATC was equivalent to the spectra obtained by the addition of carrier. This indicated that no interaction occurred with a solid dispersion of drug and lipid carriers. The results revealed no considerable changes in the IR peaks of ATC, when mixed with polymer PEG-4000. These observations indicated the compatibility of PEG-4000 with ATC.
Figure: 4 FTIR Spectra of Atorvastatin Calcium
Figure: 5 FTIR Spectra of Atorvastatin Calcium & PEG-4000 Mixture
CONCLUSION
311
weight ratio of 1:3. PEG 4000 dispersion by dropping method showed faster dissolution rate when compared with that of pure drug.
REFERENCES
[1] M. Hite, S. Turner and C. Federici. www. scolr.com/lit/PMPS_2003_1.pdf.
[2] A. H. Goldberg, M. Gibaldi and J. L. Kanig. J. Pharm. Sci., 1965, 54, 1145-1148.
[3] A. H. Goldberg, M. Gibaldi and J. L. Kanig. J. Pharm. Sci. 1966, 55, 482–487.
[4] A. H. Goldberg, M. Gibaldi, J. L. Kanig and M. Mayersohn. J. Pharm. Sci., 1966, 55, 581–
583.
[5] D. Hoerter and J. B. Dressman. Adv. Drug Del. Res., 1997, 25, 3–14.
[6] B. C. Hancock and G. Zografi. J. Pharm. Sci., 1997, 86, 1–12.
[7] T. Loftsson and M. E. Brewster. J. Pharm. Sci., 1996, 85, 1017–1025.
[8] R. Lobenberg and G. L. Amidon. Eur. J. Pharm. Biopharm., 2000, 50, 3–12.
[9] L. F. Huang and W. Q. Tong. Adv. Drug Del. Rev., 2004, 56, 321–334.
[10]M. Pudipeddi and A. T. M. Serajuddin. J. Pharm. Sci., 2005, 94, 929–939.
[11]D. Q. M. Craig. Int. J. Pharm., 2002, 231, 131–144.
[12]W. L. Chiou and S. Riegelman. J. Pharm. Sci., 1971, 60, 1281–1302.
[13]K. Sekiguchi and N. Obi. Chem. Pharm. Bull., 1961, 9, 866–872.
[14]T. Tachibana and A. Nakamura. Polym., 1965, 203, 130–133.
[15]Goodman & Gilman's. ADME, 987.
[16]J. C. Price. American Pharmaceutical Association, Washington 1994, 355–361.
[17]G. V. Betageri and K. R. Int. J. Pharm., 1995, 126, 155–160.
[18] T. Higuchi and K. Connors. Adv. Anal. Chem. Instrum., 1965, 4, 117–123.
[19]N.Arunkumar, M.Deecaraman, C.Rani, K.P.Mohanraj, K.Venkates Kumar. International Journal
of PharmTech Research, 2009, 1(4), 1725-1730.
[20]Khan KA. J Pharm Pharmacol. 1975; 27(1):48-9.
[21]P. Vijayalakshmi and V. Kusum Devi. Drug Development and Industrial Pharmacy, 2008, 34:33–