A Simulation Study of Managed Qualitative Thinking
Support Systems (MQTSS)
John H. Newman
Management Information Systems Department, College of Business, Coppin State University, 2500 W. North Avenue, Baltimore, MD 21216
*Corresponding Author: [email protected]
Copyright © 2014 Horizon Research Publishing All rights reserved.
Abstract The continued growth in the volume of
available domain and technical data has been facilitated by a corresponding advancement in information and communication technology. This “information overload” can result in inefficient use of time and resources as well as the creation of recommended courses of action that are overruled by the decision makers’ judgment and experience. In order to address these problems, multiple knowledge sources and an inference process capable of mirroring the human thought processes (especially judgment and experience) must be available at the right time to the persons or groups needing the knowledge for decision making. Such a concept can be referred to as MANAGED QUALITATIVE THINKING SUPPORT SYSTEMS (MQTSS). Traditional decision support systems (DSS) rely upon decision maker or staff expertise to render knowledge in support of decision making. If the decision maker or staff has insufficient domain or technical expertise to utilize the DSS’s embedded models, interpret results, or implement the recommendations, knowledge delivery may be compromised or rendered ineffective. MQTSS can alleviate these support problems and improve knowledge delivery for decision making by reducing knowledge search times, streamlining decision-making tasks, reducing decision time, and promoting appropriate qualitative thinking,. The MQTSS approach theoretically can enhance the decision making process and decision outcomes. This paper attempts to replicate an earlier study by this author to test the theory. First, the MQTSS approach is presented. Next, an information system is created to deliver the technology to management. Finally, a simulation experiment is reported that compares the effectiveness of support rendered by a traditional decision support system and the created MQTSS information system. The paper closes with conclusions and implications for information systems research.Keywords Decision Support Systems, Management
1. Introduction
Knowledge use in support of decision making in the
information age has been facilitated by the emergence and rapid expansion of the Internet including the World Wide Web and by electronic media and libraries [20]. Computer systems for solving problems [16] and supporting decision-making have been developed for some time. Many technological and organizational developments have exerted an impact on this evolution [23]. The creation and availability of knowledge has been part of this evolution as has qualitative thinking. In today’s industry, managers and other decision makers in diverse public and private institutions are constantly in need of knowledge to make their decisions. Since information [2] has become the most sought after commodity following the emergence of “The Knowledge Economy”, this asset has supplanted capital and energy as “wealth creating assets.” The availability of knowledge does not necessarily make it accessible in the concise and needed form to the decision maker or manager at the right time [3]. Sometimes these decisions require knowledge on the spot [4].
Instead of looking through numerous books, manuals, and hard and soft copy reports, decision makers would ideally like to compile, capture, and receive a smaller and more readily digestible volume containing only the relevant information needed at that moment [3]. The determination of what is relevant and when it is needed, as well as the amount and form of information vary with individual decision makers. Thus, it is necessary to introduce qualitative appraisal throughout the decision making process.
This paper presents the MQTSS concept and demonstrates the benefits for decision-making support. First, there is an overview of the literature involving the problems of knowledge delivery. Next, the paper discusses MQTSS characteristics and the role of the concept in overcoming knowledge base difficulties. Then, there is an empirical analysis of the MQTSS concept. Finally there is a discussion of the study’s implications and a presentation of recommendations for maximizing the benefits derived from the use of knowledge bases.
Experience and knowledge sharing have greatly enhanced the development of the infrastructure of knowledge management firms like KPMG, Buckman Laboratories, Andersen Consulting and AMS [1] [21] [7] [11]. Yet the process creates challenges.
For one thing, the knowledge manager must sift through a very large number of documents to determine what is useful for entry into the databases [1]. “Useful” is a qualitative concept. Once identified, these documents must be contextualized to become easily searchable and readily available when and how needed. Putting knowledge in an appropriate context is again a qualitative concept.
Another challenge is to get employees to use knowledge management tools, which can be perceived as burdensome and time ineffective [21] [11].
A frequently encountered search problem is that of retrieving a large number of potentially useless and a small number of highly useful documents. Qualitative judgment is needed in a timely manner to be able to distinguish between them [7]. For this purpose, decision makers and knowledge workers use their interpersonal networks by conferring with colleagues to ask what documents are good for particular applications. The process can be time consuming and frustrating. Often, in real life situations, the professional finds himself or herself paralyzed in a work process for want of standards by which the relative importance of knowledge can be appraised.
Under these circumstances, it is crucial for the professional to have prompt access to that knowledge deemed relevant to facilitate decision making during the work flow process.
3. Knowledge and Decision Making
According to a popular theory, the human decision making process can be summarized with the phases and steps [9].
During the intelligence phase, the decision-maker observes reality, gains a fundamental understanding of existing problems or new opportunities, and acquires the general quantitative and qualitative information needed to address the problems or opportunities.
In the design phase, the decision-maker develops a specific and precise model that can
be used to systematically examine the discovered problem or opportunity. This model will consist of decision alternatives, uncontrollable events, criteria, and the symbolic or numerical relationships between these variables. Using the explicit models to logically evaluate the specified alternatives and to generate recommended actions constitutes the ensuing choice phase.
During the subsequent implementation phase, the decision maker ponders the analyses and
recommendations, weighs the consequences, gains sufficient confidence in the decision, develops an implementation plan, secures needed financial, human, and
material resources, and puts the plan into action.
For the decision making to be effective and efficient, ideas consistent with the decision makers’ judgment and experience knowledge will be needed in a timely manner at each step and phase of the process.
General or even expert knowledge will not be as useful as knowledge that is focused and pertinent to the decision task as determined by the decision makers. For example, a model that precisely and explicitly relates criteria to alternatives and events, in a qualitative manner will be more useful than a general statement of the relationships involved in the problem. Different knowledge may be required at various phases of decision making. For example, domain knowledge may be needed during intelligence and design, while technical knowledge may be required during choice.
Since decision making is fundamentally sequential in nature, it is important to transfer requisite knowledge between phases of the process. For example, domain knowledge in the intelligence and design phases based upon the judgment and experience of the decision makers must be transferred to the technical tasks involved in choice and implementation.
Managed Qualitative Thinking Support Systems (MQTSS) ensures that a person or group performing a specific task related to an overall work process readily receives that knowledge deemed to be needs when it is needed. As a result, MQTSS can incrementally reduce task lead-time and facilitate a seamless work flow. It preempts delays and chaos associated with information overload by restricting data input to that judged to be relevant to the decision makers. This decreased volume is cost-effective. [5].
4. Intelligent Decision Support Systems
(IDSS)
A number of information systems exist to generate knowledge for decision-making support. Collectively, these systems can be called Intelligent Decision Support Systems (IDSS) [13]. These systems integrate the functions of Decision Support Systems (DSS) and Knowledge Based Systems (KBS) to assist decision makers in building analytical models, offer advice on specific problems tasks, assist decision makers in performing decision analysis, and explain conclusions and recommendations [15] [26] [22] [25].
Usually, the support is offered in a fragmented and incomplete manner with the focus on general problem knowledge and specific advice as viewed from a narrow perspective. In short, traditional IDSS has not provided MQTSS. Yet, the integration of a MQTSS capability within DSS can enhance the quality and efficiency of the decision-making support, create synergistic effects, and augment decision-making performance and value [19] [24] [12] [23].
The null hypothesis is that a MQTSS-enhanced DSS will result in no improvement in decision making when compared to a traditional DSS.
The alternative hypothesis is that a MQTSS-enhanced DSS would improve decision making when compared to a traditional DSS.
To answer this question, we utilized a semi-structured decision situation to collect data and test the hypotheses.
5. Decision Situation
The decision situation involves a market in which an organization competes for a product’s four-quarter total market potential on the basis of price, marketing, and other factors. The demand for the organization’s software products will be influenced by, (1) its actions, (2) the competitors’ behavior, and (3) the economic environment [17].
The simulation process is centered on the formulation of a software development policy that would generate as much total profit as possible over a four-quarter planning period. Policy making requires: (1) setting the levels of four decision variables (product price, marketing budget, research and development expenditures, and plant expansion investment) and (2) forecasting the levels of four key uncontrollable variables (the competitors’ price, marketing budget, a seasonal product sales index, and an index of general economic conditions). These eight variables will jointly influence the profitability of the simulated business organization.
Twelve additional variables, including plant capacity, raw materials inventory, and finished goods inventory, will remain fixed from trial to trial and thereby become the scenario for decision-making. As in any competitive business environment, this problem is dynamic in nature, i.e., a decision made in one quarter affects decisions and outcomes in the current and subsequent quarters. In this dynamic environment, it also is difficult to recover from initially poor decision strategies within the simulated time frame.
In this situation, decision makers will focus on the key uncontrollable events – competitors’ marketing and price, the seasonal index, and the economic index – and the major controllable actions – price, marketing, research and development, and production. The Decision maker influences profit by selecting the controllable variables, which are the product price, marketing, research and development, and plant investment. The uncontrollable variables such as the competitor’s price, competitor’s marketing budget, seasonal index and economic index also affect profit but in a complex, dynamic manner.
There are a number of equations that specify the relationships and the influence of the variables on the outcome from decision making.
5.1. Problem Scenario
We examine the MQTSS concept through the use of a
software package known as AIS (Academic Information Systems). The AIS tool delivers the model of the simulated organization whose objective is to maximize profits [17]. A large group of simulated decision makers were utilized to generate the input variables for the models. Simulated behavior was generated from theoretical and empirical research results reported in published studies [14] [18]. Utilizing these previous studies, we developed four categories of decision styles.
Exhibit 1 presents a sample of the equations. Exhibit 1
/* Concept1: Policy Change from quarter to quarter*/
/*Let E1 = Quarter 1 economic index*/ /*E2 = Quarter 2 economic index*/ /*E3 = Quarter 3 economic index*/ /*E4 = Quarter 4 economic index*/ MPPE2 = ( E2 - E1)/ E1/0.1* 0.14; MPPE3 = ( E3 - E2)/ E2/0.1* 0.14; MPPE4 = ( E4 - E3)/ E3/0.1* 0.14; /*Let SI1 = Quarter 1 seasonal index*/ /*SI2 = Quarter 2 seasonal index*/ /*SI3 = Quarter 3 seasonal index*/ /*SI4 = Quarter 4 seasonal index*/ MPPSI2 =( SI2 - SI1)/ SI1/0.1; MPPSI3 =( SI3 - SI2)/ SI2/0.1;
6. Decision Making Styles
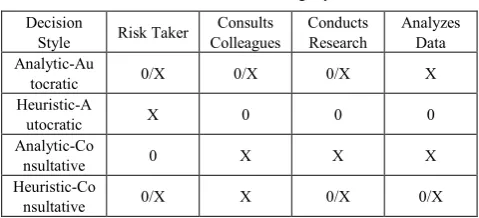
The decision styles were based on two major dimensions: (1) Number of alternatives considered and (2) Amount of information analyzed [6].
Table 1 below shows the major attributes of these management styles using the scale:
0 = Not Applicable X = Applicable
[image:3.595.312.552.548.657.2]0/X = Moderate / Partially Applicable Table 1. Decision Making Styles Decision
Style Risk Taker Colleagues Consults Conducts Research Analyzes Data Analytic-Au
tocratic 0/X 0/X 0/X X
Heuristic-A
utocratic X 0 0 0
Analytic-Co
nsultative 0 X X X
Heuristic-Co
nsultative 0/X X 0/X 0/X
The major consideration is the decision-makers’ inclinations to risk taking which is reflected by high input value ranges. In contrast, the conservative ranges represent the non-risk taking or non-gambler types.
quarters and above all, the tendency to consult with colleagues and co-workers [4].
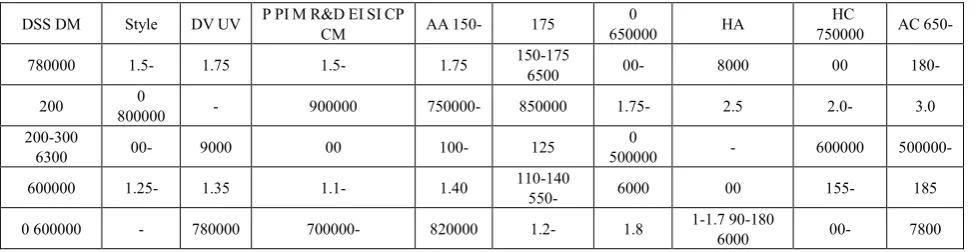
6.1. Input Ranges of Decision Styles
The ranges of input values for the decision variables and uncontrollable variables are shown in Table 2. These values are derived from these decisions styles.
The analytic-autocratic decision maker, for example, being a moderate risk taker, would enter values that are not high. This risk taking tendency is further tempered by the fact that, in combination they are analytic. Therefore, looking at the ranges in the price column, “P” for instance, this type of decision style has the next-to-lowest range ($150 - $175), after the analytic-consultative style users, who are most conservative in their choice of values. We assume the user will compare and analyze prices of the competitors in the market, the market conditions, and the firm’s product prices in the previous and current quarters. The competitor’s price in this case is $110 and the product price in the previous quarter was $100. We assume the autocratic gambler type would input $200 but the analytic attribute would influence this user to input mid-way values of the range $150-$175. Such considerations and analyses will temper the user’s liberal price ranges and bring them down mid-way. This assumed behavior explains our choice of
values for this decision style user in Table 2 below.
On the basis of the principle of insufficient reason (if there is no empirical evidence to indicate otherwise, it is reasonable to assume that the values will be uniformly distributed within the range), we assumed that each decision style is equally likely in the population.
Using a random number generator, we next generated a large number of simulated subjects in each decision style category. Then, another random number generator was used to generate input values for each decision and uncontrollable variable within each decision style. The process gave us a large number of observations for the input values in the problem scenario. These simulated values were used as subject inputs in the decision support system processing.
In contrast, the managed qualitative thinking support system (MQTSS) offered advice on the input values to the simulated subjects. We assumed that some, but not all, of the subjects would accept the advice. Subjects not accepting the advice, either partially or completely, would get the same outcomes from the MQTSS processing as would occur in the DSS processing.
[image:4.595.61.550.410.536.2]Hence, differences in decision outcomes could be attributed solely to the subjects’ input values for the controllable and uncontrollable variables. MQTSS advice was rendered through an intelligent MQTSS.
Table 2. Values based on decision making styles in the DSS architecture
DSS DM Style DV UV P PI M R&D EI SI CP CM AA 150- 175 650000 0 HA 750000 HC AC 650-
780000 1.5- 1.75 1.5- 1.75 150-175 6500 00- 8000 00 180-
200 800000 0 - 900000 750000- 850000 1.75- 2.5 2.0- 3.0
200-300
6300 00- 9000 00 100- 125 500000 0 - 600000 500000-
600000 1.25- 1.35 1.1- 1.40 110-140 550- 6000 00 155- 185
0 600000 - 780000 700000- 820000 1.2- 1.8 1-1.7 90-180 6000 00- 7800
7. The Managed Qualitative Thinking
Support System (MQTSS)
Desirable input values can be derived from the relationships provided in AIS software manual. These values, which generate good though not necessarily maximum, profits are presented in Table 3 below [17].
Table 3. Pricing Model Simulation for 4 Quarters (Based AIS Manual)[Current Period Decisions]
Quarter 1 Quarter 2 Quarter 3 Quarter 4
Price 51 51 51 51
Marketing 300000 300000 300000 300000
R & D 500000 0 0 0
Economic
Index 1.00 1.00 1.00 1.00
Seasonal Index 1.00 1.00 1.00 1.00
Competitor’s
Price 100 100 100 100
Competitor’s
Marketing 600000 600000 600000 600000
These desirable values were stored in a knowledge base in the MQTSS. Users seeking advice would trigger an intelligent agent that would access the knowledge base, retrieve the suggested values, and display the suggestions to the subject. If the user accepted the advice, the agent would attach the suggested input values to the simulation model, and calculate the corresponding profits. The agent would also record whether the advice was accepted and assign the record to the corresponding subject.
We assumed that a given percentage of each decision style would accept the advice, and each style was assumed to have the same acceptance percentage. The assumptions were again based on the principle of insufficient reason. Since the percentages were fixed, we had the intelligent agent generate the decision randomly utilizing a random number generator. The same numbers of observations were generated for the MQTSS processing as were generated from the DSS processing. Comparisons between the two systems (DSS & MQTSS) were described and used to address the main research issue in this study.
8. Summary of Results
The main research issue in this study is to determine if an MQTSS could improve decision making. Improvement can be measured in terms of the outcome and process of decision making.
8.1. Outcome Test
Outcome was measured by the organization’s profits. A mean T – test was used to evaluate the mean profits from the use of the Decision Support System and the Managed
Quality Thinking Support System. The test results, summarized in Exhibit 1, indicated that there was a statistically significant difference between the mean profits between the simulated users of each system. These results, and the corresponding means, indicate that MQTSS use led to higher mean profits than DSS use. Put another way, the MQTSS improved the outcome from decision making. Exhibit 1: Two Sample t-tests for the Means of PBT and PBTJ 10000 Subjects
Sample Statistics
Group N Mean Std. Dev. Std. Error PBT 4000 -7952299 3.31E6 52337 PBTJ 4000 55882974 4.87E7 769843 Hypothesis Test
Null hypothesis: Mean 1 - Mean 2 = 0 Alternative: Mean 1 - Mean 2 ^= 0 If Variances Are t statistic Df Pr > t Equal -82.729 7998 <.0001 Not Equal -82.729 4036.0 <.0001
8.2. Process Tests
Outcome occurs through the process of decision making [8]. This process can be characterized as intelligence, followed by design and choice, and concluded with implementation [10] [27].
In this application, intelligence and early design have been completed prior to system use and are represented by the simulation model delivered by both the DSS and MQTSS. Later design (operationalizing the formulated model) was achieved by assigning values for the uncontrollable events (competitor’s price, competitor’s marketing, the seasonal index, and the economic index) in the simulation model.
Choice is achieved by assigning the decision variables (price, marketing, research and development, and plant investment) in the simulation model. Implementation involves the calculation of profits from the assigned decision and uncontrollable input values. The calculations will be made in both the DSS and MQTSS.
In the DSS, the input values are generated by the subjects through the random generator process. In the MQTSS, the values are assigned by the advice delivered through the intelligent agent (for subjects accepting the advice).
Hence, process improvement can be measured by the differences in the controllable and uncontrollable input values between the DSS and MQTSS. If there are no differences, advice was not taken, and there was no process improvement that could be attributed to the MQTSS.
inclusive. The results from Exhibits 2-5 indicate that there were no statistically significant differences between the values for the uncontrollable inputs in the DSS and MQTSS. These results indicate that the MQTSS did not improve the design phase of decision making.
Exhibit 2: Two Sample t-tests for the Means of E and EJ Two Sample t-tests for the Means of E and EJ 10000 Subjects
Sample Statistics
Group N Mean Std. Dev. Std. Error E 4000 1.882129 0.4683 0.0074 EJ 4000 1.889703 0.4737 0.0075 Hypothesis Test
Null hypothesis: Mean 1 - Mean 2 = 0 Alternative: Mean 1 - Mean 2 ^= 0 If Variances Are t statistic DF Pr > t Equal -0.719 7998 0.4720
Not Equal -0.719 7997.0 0.4720
Exhibit 3: Two Sample t-tests for the Means of SI and SIJ Two Sample t-tests for the Means of SI and SIJ 10000 Subjects
Sample Statistics
Group N Mean Std. Dev. Std. Error SI 4000 1.828304 0.597 0.0094 SIJ 4000 1.825968 0.5939 0.0094 Hypothesis Test
Null hypothesis: Mean 1 - Mean 2 = 0 Alternative: Mean 1 - Mean 2 ^= 0 If Variances Are t statistic DF Pr > t Equal 0.175 7998 0.8607
Not Equal 0.175 7997.8 0.8607
Exhibit 4: Two Sample t-tests for the Means of CM and CMJ Two Sample t-tests for the Means of CM and CMJ 10000 Subjects
Sample Statistics
Group N Mean Std. Dev. Std. Error CM 4000 2497278 3.09E6 48792 CMJ 4000 2499068 3.09E6 48834 Hypothesis Test
Null hypothesis: Mean 1 - Mean 2 = 0 Alternative: Mean 1 - Mean 2 ^= 0 If Variances Are t statistic Df Pr > t Equal -0.026 7998 0.9793
Not Equal -0.026 7998.0 0.9793
Exhibit 5: Two Sample t-tests for the Means of CP and CPJ Two Sample t-tests for the Means of CP and CPJ 10000 Subjects
Sample Statistics
Group N Mean Std. Dev. Std. Error CP 4000 175.1487 63.505 1.0041 CPJ 4000 175.4892 63.441 1.0031 Hypothesis Test
Null hypothesis: Mean 1 - Mean 2 = 0 Alternative: Mean 1 - Mean 2 ^= 0 If Variances Are t statistic DF Pr > t Equal -0.240 7998 0.8104
Not Equal -0.240 7998.0 0.8104
Similar tests were conducted comparing the values of the controllable variables for the DSS and the MQTSS respectively: DSS Price (P), MQTSS Price (PJ), DSS Marketing (M), MQTSS Marketing (MIJ), DSS Plant Investment (PI), MQTSS Plant Investment (PIJ), the DSS Research and Development (RD), and the MQTSS Research and Development (RDJ). The results are reported in Exhibits 6-9.
Two Sample t-tests for the Means of P and PJ 10000 Subjects Sample Statistics
Group N Mean Std. Dev. Std. Error P 4000 166.4833 34.339 0.543 PJ 4000 47.80504 6.4576 0.1021 Hypothesis Test
Null hypothesis: Mean 1 - Mean 2 = 0 Alternative: Mean 1 - Mean 2 ^= 0 If Variances Are t statistic DF Pr > t Equal 214.815 7998 <.0001 Not Equal 214.815 4281.5 <.0001
Exhibit 6: Two Sample t-tests for the Means of P and PJ Two Sample t-tests for the Means of M and MJ 10000 Subjects
Sample Statistics
Group N Mean Std. Dev. Std. Error M 4000 729364.8 123162 1947.4 MJ 4000 270589.6 21287 336.57 Hypothesis Test
Null hypothesis: Mean 1 - Mean 2 = 0 Alternative: Mean 1 - Mean 2 ^= 0 If Variances Are t statistic DF Pr > t Equal 232.146 7998 <.0001 Not Equal 232.146 4237.7 <.0001
Exhibit 7: Two Sample t-tests for the Means of M and MJ Two Sample t-tests for the Means of RD and RDJ 10000 Subjects
Sample Statistics
Group N Mean Std. Dev. Std. Error RD 4000 688693.6 169784 2684.5 RDJ 4000 115565.3 200564 3171.2 Hypothesis Test
Null hypothesis: Mean 1 - Mean 2 = 0 Alternative: Mean 1 - Mean 2 ^= 0 If Variances Are t statistic DF Pr > t Equal 137.940 7998 <.0001 Not Equal 137.940 7785.8 <.0001
Exhibit 8: Two Sample t-tests for the Means of RD and RDJ the results from Exhibits 6-9 indicate that there were statistically significant differences between the values for the controllable inputs in the DSS and MQTSS. These results indicate that the MQTSS did improve the choice phase of decision making.
Two Sample t-tests for the Means of PI and PIJ 10000 Subjects
Sample Statistics
Hypothesis Test
Null hypothesis: Mean 1 - Mean 2 = 0 Alternative: Mean 1 - Mean 2 ^= 0 If Variances Are t statistic Df Pr > t Equal 29.185 7998 <.0001
Not Equal 29.185 4985.1 <.0001
Exhibit 9: Two Sample t-tests for the Means of PI and PIJ Collectively, the sample t tests suggest that the MQTSS improved the outcome from decision making by enhancing the choice phase in the process. To further test this interrelationship, we conducted canonical correlation analyses.
8.3. Canonical Correlations
To determine if the DSS inputs collectively are correlated in the DSS and JDSS, we conducted a canonical correlation of DSS controllable and uncontrollable inputs against MQTSS controllable and uncontrollable inputs. The main results are summarized in Exhibit 10.
Exhibit 10 Canonical Correlation of DSS and MQTSS Inputs Likelihood Approximate
Ratio F Value Num DF Den DF Pr > F 1 0.35038057 16.46 32 764 <.0001 2 0.69769423 11.06 15 383 <.0001
Exhibit 10’s results indicate that DSS and MQTSS uncontrollable inputs are significantly correlated, but MQTSS controllable inputs are not significantly correlated with DSS controllable inputs.
These results suggest that the controllable inputs in the MQTSS are statistically significantly different from the corresponding inputs in the DSS.
To determine if outcomes collectively were related to process collectively, we conducted a canonical correlation of profits against the controllable and uncontrollable inputs. The results are reported in Exhibit 11.
Exhibit 11 Canonical Correlation of DSS and MQTSS Profits Against Inputs
Likelihood Approximate
Ratio F Value Num DF Den DF Pr > F 1 0.00003232 173.73 64 2221.4 <.0001 2 0.02763048 41.09 49 1959 <.0001 3 0.29734022 15.00 36 1697.8 <.0001 4 0.68290958 6.22 25 1439.1 <.0001 5 0.92148213 2.01 16 1186 0.0102 6 0.98834008 0.51 9 946.87 0.8693 7 0.99744612 0.25 4 780 0.9100 8 0.99996665 0.01 1 391 0.9091
The results in Exhibit 11 indicate that profits are significantly correlated with the controllable inputs but not with most uncontrollable inputs. These results suggest that the controllable inputs are the main contributors to profits. These two canonical correlations confirm the previous t test findings that the MQTSS improved the outcome from decision making by enhancing the choice phase in the process.
9. Conclusions and Implications
The broad conclusion from the conducted simulation study is that the MQTSS, relative to the DSS, helps improve the process of and outcome from decision making. Moreover, from the hypotheses tested, it can be inferred that the input of the right values for the controllable variables, which in essence constitute the process steps, led to the improved profit outcomes.
There are some limits on these conclusions. For one thing, the MQTSS advice is predetermined by the designer (AIS manual), which may be different in other future circumstances. Also, the market simulation used was for only 1year (4 quarters) which makes it difficult to draw long range conclusions.
In addition, the categories of users or decision styles used are arbitrary though based upon empirical and theoretical assumptions. Finally, the input values ranges are arbitrary though based on empirical and theoretical assumptions.
Nevertheless, the results of this study confirm previous research that intelligent decision-making support systems can significantly improve both the outcomes from, and process of, strategic decision-making. Unlike previous research, this study offers a different approach to intelligent decision-making support based on the MQTSS concept and the non-subject simulation approach.
The results imply that the managed qualitative thinking concept is superior to traditional knowledge and expert system approaches in guiding the decision maker toward an effective policy or strategy. Another implication is that intelligent agents can offer an effective mechanism to deliver just in time knowledge. Such an implication could potentially extend the use of agents in intelligent decision-making support systems beyond simple processing efficiency toward true and direct decision process support. In this study, the agent processing was delivered through the simulation model. Such delivery implies that model relationships, whether in quantitative or qualitative form, can be effective agents in intelligent decision making support systems. Moreover, this form of agent delivery can offer goal seeking and sensitivity analyses automatically to system users.
REFERENCES
[1] Alavi, M. (1997), KPMG Peat Marwick U.S One Giant Brain Harvard Business School, 9397108.
[2] B. Deagon, “Has Your firm Changed Ways to Compete in a Knowledge Economy,” Investor’s Business Daily, 6 January 1994, p.3
Systems, Oxford University, United Kingdom, pp. 101 – 106. September 3 – 5, 2003a.
[4] Conteh, N.Y and Forgionne, G, “Delivering Enhanced Decision Making Support through Intelligent Just-In-Time Decision Support Systems” Proceeding of the 34th annual conference of the Decision Sciences Institute, Washington D.C, pp. 1 – 6. November 22 – 25, 2003b.
[5] Conteh, N.Y and Forgionne, G, “Simulation Modeling as an Information Systems Evaluation Tool”: Proceeding of the 35th annual conference of the Decision Sciences Institute, Boston, November 22 – 25, 2004a.
[6] Conteh, N.Y and Forgionne, G, “The Design of Dynamic Just-in-time Agent Technology through Simulation Modeling” Frontiers in Artificial Intelligence and Applications: Knowledge- Based Intelligent Engineering Systems. IOS Press B.V., Amsterdam, Netherlands, August 2004b. [7] Davenport, T. et al. (1999). Knowledge Management at
Andersen Consulting. Harvard Business School, 9-499- 032. [8] Dean, J. W., Sharfman, M. P.: “Does Decision Process Matter?
A Study of Decision-making Effectiveness” Academy of Management Journal, Vol. 39:2. (1996) 368-396
[9] Forgionne, G. A.: Decision-making Support Systems Architecture. In: Forgionne, G.A., Gupta, J.N.D., Mora, M.(eds.): Decision-making Systems: Achievements and Challenges for the New Decade. Idea Group Publishing, Hershey PA (2002)
[10] Forgionne, G.A (1999) “An AHP model of DSS effectiveness” European Journal of Information Systems, Palgrave Macmillan Ltd Houndmills, Basingstoke, Hampshire, RG21 6XS, England.
[11] Fulmer, W.E. (1999). Buckman Laboratories. Harvard Business School, 9-800-160.
[12] Hans W. Gottinger, Peter Weimann, Intelligent decision support systems, Decision Support Systems, v.8 n.4, p.317-332, Aug. 1992
[13] Gordon, L.A., et al.(1975). Normative Models in Management Decision Making. New York:National Association of Accounting.
[14] Hunsakers, Philip L. and Hunsaker, Johanna S. Decision styles – in theory, in practice Organizational Dynamics, Vol 10 (Autumn 1981), pp. 23 – 36*)
[15] King, R., DSS: Complementing the Small Business Manager," Proceedings of the Midwest Decision Sciences Institute, May 1990, pp. 168-170, with John Malley and Robert Reich.
[16] Klein M.R. & Methlie L.B (1995) Knowledge-based Decision Support Systems – with applications in Business. New York: John Wiley & Sons. 527 p. ISBN 0-471-95295-8. [17] McLeod, R. P. Academic Information Systems (AIS) Software Package II, 1986. Available from R. P. McLeod, 1106 Glade, College Station, TX 77840, (409) 693-1241. [18] Mintzberg, H. (1973). The nature of Managerial Work.
Englewood Cliffs, NJ: Prentice Hall.
[19] Potter, W., Byrd, T., Mille, J., Kochut, K.: Extending Decision Support Systems: The Integration of Data, Knowledge, and Model Management. Annals of Operations Research, Vol. 38. (1992) 501-527
[20] Power, D.J. and S. Karparthi. “The Changing Technological Context of Decision Support Systems”, In Berkeley, D.,G. Widmeyer, P. Brezillion & V. Rajkovic (Eds.) Context- Sensitive Decision Support Systems. London: Chapman and Hall, 1998.