© 2017, IRJET | Impact Factor value: 5.181 | ISO 9001:2008 Certified Journal
| Page 3304
Comparison of two methods of bolt and washer assembly
Ayush Anand
11
Student, Department of Production Engineering, BIT Mesra, Jharkhand, India
---***---Abstract -
Ergonomics is defined as an appropriate designfor people, the design of systems, processes, equipment and environments so that tasks and activities required of them are within their limitations but also make the best use of their capabilities (Salvendey, 2012). The function of specialists in ergonomics is to design or to improve the workplace, equipment, and procedures for workers to ensure the safe, healthy, and efficient achievement of personal and organizational goals. Poor work layout leads to fatigued, frustrated and hurting workers. In the present paper, two methods of bolt and washer assembly have been compared using some general ergonomic procedure, which was well verified using some software like Minitab, CATIA etc. According to the stats and results, the better method had been chosen among the two and was verified that the principle of motion economy is well applied in the final case.
Key Words: Bolts and washers; RULA analysis; Spaghetti diagram; Normal distribution plot; Two hand process
1. INTRODUCTION
The first step towards reducing ergonomic risks in a production system is to devise methods to understand and characterize the risk events (Montgomery et al. 2009). By making improvements to the work process, workers are provided with a job that is within their body’s capabilities and limitations. Ergonomics can have a profound impact on any organizations like cost reduction, productivity and quality improvement and safety culture. This particular experiment is being done to find out the best work layout and working procedure for the assembly of bolt and washer among two proposed method, which had been proven theoretically and experimentally. A general and systematic procedure had been used which are following:
Critical examination Two hand process chart Normal probability plot
limb assessment) analysis
These above tools would help us to optimize the procedure. Hardware used:-
Decimal minute stopwatch, stock bins, bolts, steel washer, leather washers, rubber washers
Software used:- MINITAB, CATIA
2. PROCEDURE
2.1 Critical examination
In method study, recording is always followed by a critical examination of that recorded date. The examination should be critical but impartial. So examination is just a technique to check the significance or bottlenecks of a process (Jayaram et al. 2006). But which activities to be examined first and now, are the points to be kept is mind while examination. A critical examination table, table 1 had been made to keep an eye on the methods used.
Table- 1: Critical examination table
2.2 Practical observations
A person was made to do assembly of washer and bolts in both methods, say method 1 and method 2.
Primary questions Secondary questions
Established facts Why Alternatives Proposal
(What) 1.Assembly of bolts
and washers
Class lab work Buy assembly
products No change
(How) 1.Assembly
using both hands Normal practice Use fixture Fixture
2.Assembled thing placed in a bin
To be used for future
Stored in gravity
feed Gravity feed
(Where) 1.On a table of height approx. 100 cm
Better for lumbar
and thoracic Using machine No change
© 2017, IRJET | Impact Factor value: 5.181 | ISO 9001:2008 Certified Journal
| Page 3305
Fig- 1: Method 1 setup [image:2.595.31.279.100.237.2]In the method 1, a person had to do assembly of one washer and one bolt at one time. The right hand would be used to bring a washer and left hand would be used to bring one bolt which would be assembled using both hands and then being put in an another bin. This would be repeated till all the assembly has been done. Now, the time had been recorded for every assembly as in table 2.
Table- 2: Method 1 time analysis
In the method 2, a person had to do assembly of two bolt and washer at a time by inserting the bolts into grooves.
Fig-2: Method 2 setup
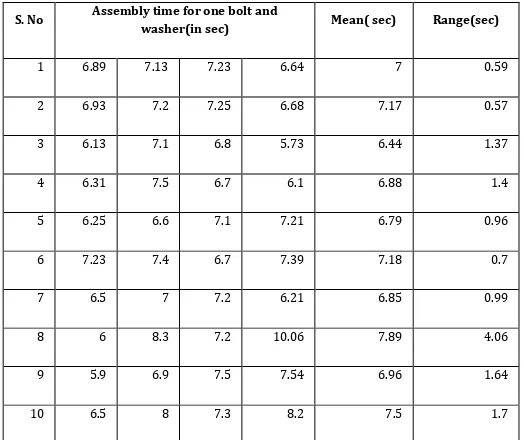
Table 3: Method 2 time analysis
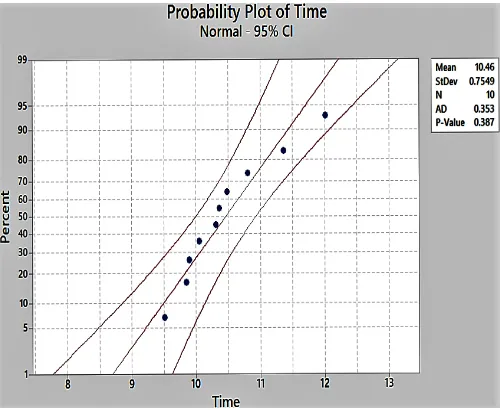
2.3 Normal probability plot
A normal probability plot had been plotted for the above observations. This plot helps in the evaluation of both old and new method. The plotting had been done in MINITAB with 95% confidence interval.
Chart-1: Normal distribution plot for method 1
The mean time for assembly of a bolt with the washers, as shown in fig.3 comes out to be 7.066 seconds. The black dots in the above figure are the observation values from table 1.
S. No
Assembly time for one bolt and washer(in sec)
Mean(
sec) Range(sec)
1 11.53 13.01 10.59 12.91 12.01 2.42
2 11.4 12.1 10.9 11.0 11.36 1.2
3 9.9 11.6 10.3 8. 10.05 3.2
4 10.5 9.83 9.76 10.37 10.31 0.74
5 8.9 9.8 9.2 10.6 9.57 1.7
6 10.1 10.86 11.1 9.38 10.36 1.72
7 10.5 11.2 11.3 10 10.8 1.3
8 11.2 12.1 11.8 8.1 9.89 4
9 10.5 9.1 10.6 9.36 10.80 1.5
10 9.1 10.2 11.2 9 9.85 2.1
S. No Assembly time for one bolt and washer(in sec) Mean( sec) Range(sec)
1 6.89 7.13 7.23 6.64 7 0.59
2 6.93 7.2 7.25 6.68 7.17 0.57
3 6.13 7.1 6.8 5.73 6.44 1.37
4 6.31 7.5 6.7 6.1 6.88 1.4
5 6.25 6.6 7.1 7.21 6.79 0.96
6 7.23 7.4 6.7 7.39 7.18 0.7
7 6.5 7 7.2 6.21 6.85 0.99
8 6 8.3 7.2 10.06 7.89 4.06
9 5.9 6.9 7.5 7.54 6.96 1.64
[image:2.595.29.291.381.601.2] [image:2.595.310.562.437.607.2]© 2017, IRJET | Impact Factor value: 5.181 | ISO 9001:2008 Certified Journal
| Page 3306
Chart -2: Normal distribution plot for method 22.4 Two hand process chart
A chart in which the activities of a workers hands (or limbs) are recorded in their relationship to one another. Generally used for repetitive operation, when one complete cycle of the operation is to be recorded.
[image:3.595.37.289.102.307.2]It is being done for both the observations.
Table -4: Process chart for method 1
Table -5: Process chart for method 2
The symbols used have the following significance:-
Fig-3: Process chart symbols meaning
(http://tohproblemkyahai.com/left-hand-right-hand-chart-two-handed-process-chart/)
Left-hand activity Symbol Right-hand activity Symbol
Moving hand to bolt <--- Moving hand to washer --->
Picking bolt O Picking lock washer O
Moving to assembly ---> Moving to assembly <---
Assembly O Assembly O
Holding bolt D Picking steel washer O
Holding bolt D Moving steel washer <---
Assembly O Assembly O
Holding bolt D Moving hand to pick nut --->
Assembly O Assembly O
Storage ∆ Delay D
Left-hand activity Symbol Right-hand activity Symbol
Moving hand to washer <--- Moving hand to washer --->
Picking lock washer O Picking lock washer O
Moving to fixture ---> Moving to fixture <---
Drop in fixture O Drop in fixture O
Move to leather washer O Moving hand to leather washer --->
Picking leather washer O Picking leather washer O
Moving hand to fixture ---> Moving hand to fixture <---
Assembly in fixture O Assembly in fixture O
Moving hand to steel washer <--- Moving hand to steel washer --->
Picking steel washer O Picking steel washer O
Moving to assembly ---> Moving to assembly <---
Assembly O Assembly O
Moving hand to bolt <--- Moving hand to bolt --->
Picking bolt O Picking bolt O
Moving to assembly ---> Moving to assembly <---
[image:3.595.307.571.490.631.2]© 2017, IRJET | Impact Factor value: 5.181 | ISO 9001:2008 Certified Journal
| Page 3307
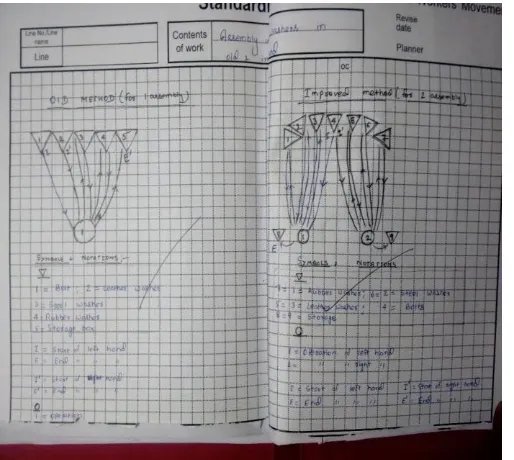
2.5 Standard worksheet chart (spaghetti diagram)
[image:4.595.33.290.172.402.2]The path followed by a worker in doing assembly had also been analyzed on a standard worksheet chart for the both method.
Fig -4: Standard worksheet chart
This helps in evaluating the movements of both left and right hand which is fertile and productive. Clearly, method 2 involves in fewer movements of limbs.
2.6 RULA analysis
Rapid Upper Limb Assessment (RULA) was developed to evaluate the exposure of individual workers to ergonomic risk factors associated with upper extremity MSD (McAtamney, Lynn, and Corlett 1993). The RULA ergonomic assessment tool considers biomechanical and postural load requirements of job tasks/demands on the neck, trunk and upper extremities.
[image:4.595.309.563.427.672.2]So, a RULA analysis has been carried out for both the posture and the RULA score helps in finalizing best posture for a particular method. This had been performed in CATIA.
Fig -5: RULA analysis for method 1
For method 1, as shown in fig.7, arms were not leaned on any support and gravity load has been considered while arms were doing the assembly.
The final score for this observation was Rank 3.
Fig -6: RULA analysis for method 2
All the input were same in both method except that in improved method, worker arms were leaning and have good support.
© 2017, IRJET | Impact Factor value: 5.181 | ISO 9001:2008 Certified Journal
| Page 3308
3. RESULT AND DISCUSSION
As inferred from all the above procedures, method 2 is better in all the perspective from method 1 and this method should be processed while doing assembly of bolts and washers. Also, method 2 is being able to incorporate all the principles of motion economy.
4. ACKNOWLEDGEMENT
The present work is an effort to compare the bolt and washer assembly using different aids. The work would not have been possible to come to the present shape without the able guidance, supervision and help by Dr. Vijay Kumar Singh sir, and my HOD Dr. Vinay Sharma sir. With deep sense of gratitude, I acknowledge my department and my colleagues who helped me for completion of my project.
5. REFERENCES
[1] Azzalini, Adelchi, and Alessandra Dalla Valle. "The multivariate skew-normal distribution." Biometrika 83, no. 4 (1996): 715-726.
[2] Basu, Amit, and Robert W. Blanning. "A formal approach to workflow analysis." Information Systems Research 11, no. 1 (2000): 1736.
[3] Burke, Michael J., Sue Ann Sarpy, Kristin Smith-Crowe, Suzanne Chan-Serafin, Rommel O. Salvador, and Gazi Islam. "Relative effectiveness of worker safety and health training methods." American journal of public health 96, no. 2 (2006): 315-324.
[4] De Looze, M. P., J. W. Van Rhijn, J. Van Deursen, G. H. Tuinzaad, and C. N. Reijneveld. "A participatory and integrative approach to improve productivity and ergonomics in assembly." Production Planning & Control 14, no. 2 (2003): 174-181.
[5] De Verdiere, Alain Colin. "Lagrangian eddy statistics from surface drifters in the eastern North Atlantic." Journal of Marine Research 41, no. 3 (1983): 375-398.
[6] Haines, Helen, John R. Wilson, Peter Vink, and Ernst Koningsveld. "Validating a framework for participatory ergonomics (the PEF)." Ergonomics 45, no. 4 (2002): 309-327.
[7] http://tohproblemkyahai.com/left-hand-right-hand- chart-two-handed-process-chart/.
[8] Jayaram, Uma, Sankar Jayaram, Imtiyaz Shaikh, YoungJun Kim, and Craig Palmer. "Introducing quantitative analysis methods into virtual environments for real-time and continuous ergonomic evaluations." Computers in industry 57, no. 3 (2006): 283-296.
[9] McAtamney, Lynn, and E. Nigel Corlett. "RULA: a survey method for the investigation of work-related upper limb disorders." Applied ergonomics 24, no. 2 (1993): 91-99.
[10] Montgomery, Douglas C., George C. Runger, and Norma F. Hubele. Engineering statistics. John Wiley & Sons, 2009.
[11] Pheasant, Stephen, and Christine M. Haslegrave. Bodyspace: Anthropometry, ergonomics and the design of work. CRC Press, 2016.
[12] Salvendy, Gavriel. Handbook of human factors and ergonomics. John Wiley & Sons, 2012.
[13] Zhu, Yuejian. "Ensemble forecast: A new approach to uncertainty and predictability." Advances in atmospheric sciences 22, no. 6 (2005): 781-788.