1-D CYCLE SIMULATION OFAREFRIGERANTCOMPRESSORWITHREED
VALVE USING EFFECTIVE FLOW AND FORCEAREAS BY CFD
Y. L. Lee
Department of Mechanical & Automotive Engineering, Kongju National University, South Korea E-Mail: [email protected]
ABSTRACT
The refrigerant compressor mainly uses the reed valve in the suction process. The behavior of such a suction valve can be well described through a three-dimensional FSI analysis. However, one-dimensional analysis is still actively used due to excessive computation time of the 3D analysis. For this one-dimensional analysis, effective flow area and effective force area are required. Valve prototypes and valve flow experiments are required for these areas. Therefore, in this paper, to reduce the time and expense, we derived approximate expressions by using CFD instead of experiment. Next, one - dimensional compressor cycle analysis was carried out and the numerical results were compared with the experiment. In addition, we also examined the performance of the compressor according to the suction valve stiffness.
Keywords: refrigerant compressors, PV diagram, refrigeration cycle, effective flow area, effective force area.
INTRODUCTION
Household refrigerators require a lot of electrical energy, and among refrigerator components, compressors consume about 80% of the total refrigerator power [1]. Therefore, raising the efficiency of compressors is very important in terms of environmental conservation and energy consumption reduction.
Various studies have been conducted to improve the efficiency of refrigerant compressors. Relatively simple mathematical models have been developed since 1950 to describe the state of the refrigerant and the motion of the valve during operation [2]. A study on the partial modeling of the cylinder was performed to more accurately describe the actual operating state [3]. Lee et al.
[4] used piston stroke rather than frequency to control the cooling capacity of the refrigerator compressor. In addition, studies on the optimization of compression chambers and mufflers are currently underway, applying gas pulsation theory [5].
The reed valve used in refrigerator compressors is one of the important factors determining the efficiency of compressors. Therefore, various studies have been conducted to optimize the reed valve. Ferreira and Drjesson [6] investigated the effect of geometric shape changes on effective flow area and force area. Schwerzler and Hamilton [7] presented an analytical method for obtaining effective areas and compared the effective areas with the experiments.
To use the reed valve of the compressor for one-dimensional analysis, the effective flow area and effective force area should be determined in advance. Much time and effort are required to obtain these areas through experiment. Figure-1(a) indicates 1-d approximations of the compressor valves and Figure-1(b) shows the suction valve considered in this study. Hwang [8] performed the 1-D analysis after calculating effective flow area and effective force area by CFD using bilinear interpolation.
In this study, CFD analysis was performed to utilize approximate formulas for effective areas proposed by Schwerzler and Hamilton [7]. Also, one - dimensional compressor cycle analysis was performed to compare PV
diagram with experiment. Finally, the performance of the compressor according to the stiffness of the suction valve was also examined.
NUMERICAL METHODS
To obtain effective force area and effective flow area, three-dimensional, steady-state, compressible, and turbulent flow are considered. The turbulent flow is modeled by a realizable k-ε turbulence model proposed by Shinh et al. [9]. The governing equations used RANS
(Reynolds averaged Navier-Stokes) equations as Equation. (1) [10].
(1)
In addition, energy equation for one-dimensional, compressible, and unsteady state flows is used to describe the cycle of the compressor, as Equation. (2) [10].
(2)
In addition, an equation of state such as equation (3) is required.
(3)
minimized by using 1/8 model to shorten the analysis time. The number of cells used in the analysis is about 100,000. In addition, a hybrid mesh in which hexahedral cells and tetrahedral cells
(a) 1-D approximation of valves
(b) Suction reed valve
Figure-1. Schematic of the compressor valves.
are mixed is used as the mesh system of the suction valve flow. The discharge valve was assumed to be an axisymmetric model and analyzed in 2D. The mesh uses quadrilateral cells and the number of cells is about 80,000. The definitions of effective flow area and effective force area are shown in equations (4) and (5). Detailed symbol descriptions can be found elsewhere [8].
(4)
properties of isobutane (R600a) are assumed to be real gas models. The ratio of evaporator pressure and condenser pressure is assumed to be about 9 and the frequency is assumed to be 100 Hz.
(a) Suction valve
(b) Discharge valve
Figure-2. Mesh systems for effective areas.
Table-1. Opening and closing conditions for reed valves.
Events Events conditions BC change
Opening of discharge
valve
Compression chamber pressure
Discharge pressure
Wall → Pressure outlet
Closing of discharge
valve
1) Compression chamber pressure
Discharge pressure 2) piston is at its original
position
Pressure outlet → Wall
Opening of suction
valve
Pressure on compression-chamber side surface of
suction valve
Pressure on compression-chamber side surface of
suction valve
Wall → Interior
Closing of suction
valve
1)Pressure on compression-chamber side surface of suction
valve
Pressure on compression- Interior → Wall
The initial position of the piston at the beginning of the analysis is assumed to be bottom dead center. As the compression progresses, the discharge valve is opened when the pressure of the cylinder reaches the discharge pressure, and the discharge valve is closed when the piston reaches the top dead center. When the piston is moving from the top dead center to the bottom dead center, the pressure on the both sides surfaces of the suction valve are compared. When the pressure on the piston side becomes greater than the pressure on the compression chamber side, the suction valve is opened. Then, when the piston side pressure becomes greater than the pressure on the compression chamber side, the suction valve is closed. Since the behavior of the valve in the entire cycle depends on the effective areas, the areas should be accurately determined. Table-1 summarizes the sequence of processes during a cycle.
EXPERIMENTAL METHOD
The calorimeter as shown in Figure-3 (a) was used for measuring compressor performance. Refrigerant temperatures at the compressor inlet and the condenser outlet are 25℃. For compression chamber pressure and valve lift, pressure and gap sensors are mounted as shown in Figure-3 (b). The more detailed information is available elsewhere [12].
RESULTS AND DISCUSSIONS
Effective areas for suction and discharge valves Figure-4 shows the variation of effective flow area with valve lift. The considered maximum pressure ratio is about 1.04 for the suction valve and about 1.12 for the discharge valve. In the case of the effective flow area of the suction valve, the valve lift increases linearly up to about 0.5 mm, and then gradually becomes constant. The effective flow area of the discharge valve increases linearly with the valve lift. This flow area determines the valve flow rate in 1-d analysis.
(a) Schematic of the experimental equipment
(b) Position of sensors
Figure-3. Schematic of the experimental equipment.
(a) Suction valve
(b) Discharge valve
(a) Suction valve
[image:4.612.81.286.82.449.2](b) Discharge valve
Figure-5. Variation of effective flow area with valve lift for suction valve and discharge valve.
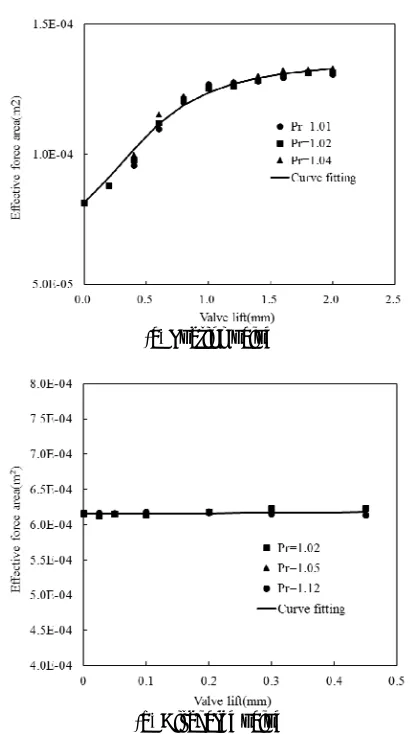
Figure-5 shows the variation of effective force area with valve lift. The considered maximum pressure ratio is about 1.04 for the suction valve and about 1.12 for the discharge valve. First, in case of the effective force area of the suction valve, the valve lift increases linearly up to about 0.5 mm, then gradually becomes constant. The effective force area of the discharge valve is constant according to the valve lift. This force area determines the force acting on the valve in the 1D analysis.
Comparison of PV diagrams
Figure-6 shows the PV diagram where compression chamber volume is numerically calculated for both cases. The spring constant, effective mass and damping coefficient are 120 N/m, 1.97X10⁻⁵ kg, and 9.72X10⁻³. Numerical and experimental PV diagrams showed significant differences in compression and expansion processes. This difference is due to various
but the numerical compression work was estimated to be about 43W.
Compressor performance according to stiffness of suction valve
[image:4.612.321.533.211.345.2]As shown in Table-2, the variation in the performance of the compressor while changing the stiffness of suction valve is shown in Figure-7. The stiffness of suction valve depends on the valve shape, suction orifice position, and so on.
[image:4.612.316.538.405.646.2]Figure-6. Comparison of PV diagram of the numerical model with the experiment.
Table 2. Variation of spring constant, effective mass and damping coefficient.
Case1 Case2 Case3
k(N/m) 80 120 160
me(kg) 1.31E-05 1.97E-05 2.63E-05 C 6.48E-03 9.72E-03 1.30E-02
(b) Cooling capacity
(c) EER
Figure-7. Variation of compression work, cooling capacity and EER with case.
Figure-7 shows the variation of compression work, cooling capacity and EER with case. As the spring constant increases, the maximum lift of the valve decreases and the amount of refrigerant flowing into the compression chamber decreases. As a result, the cooling capacity is reduced. Also, the compression work does not change much but slightly increases and then decreases again. However, the compression work remains almost constant as the variation is only 0.4%. Therefore, as the spring coefficient increases, the compression work remains constant, and the cooling capacity decreases, eventually reducing the EER. When the spring constant is increased from 80 N/m to 160 N/m, the EER decreases by about 0.7%.
CONCLUSIONS
In this paper, 1-d lumped analysis is performed to calculate the performance of a refrigeration compressor. Also, CFD was performed to derive an approximate expression for the effective areas. The following conclusions were drawn from this study.
a) The effective areas of the suction and discharge valves are hardly affected by the pressure ratio. Therefore, it is possible to derive an approximate expression from the geometric information of the valves.
b) PV diagram from 1-d numerical analysis qualitatively agrees with experiment. However, there are noticeable differences in compression and expansion processes. Therefore, it is necessary to consider refrigerant inflow to the suction system from inside the compressor housing.
c) If the stiffness of the suction valve is reduced, the compression work remains almost constant, and the cooling capacity increases, eventually increasing the EER.
It is necessary to consider the inflow of the refrigerant from inside the compressor housing for the 1-d model in the future.
ACKNOWLEDGEMENT
This research was supported by Basic Science Research Program through the National Research Foundation of Korea (NRF) funded by the Ministry of Education, Science and Technology (NRF-2016R1D1A1B02009582).
REFERENCES
[1] H. K. Lee, G. Y. Song, J. S. Park, E. P. Hong and W. H. Jung. 2000. Development of the Linear Compressor for a Household Refrigerator. Proceedings International Compressor Engineering Conference, Purdue University. pp. 31-38.
[2] J.F.T. MacLaren. 1972. A Review of Simple Mathematical Models of Valves in Reciprocating Compressors. Proceedings International Compressor Engineering Conference, Purdue University. pp. 180-187.
[3] R. Prakash and R. Singh. 1974. Mathematical Modeling and Simulation of Refrigerating Compressors. Proceedings International Compressor Engineering Conference, Purdue University. pp. 274-285.
[5] M. Dhar and W. Soedel. 1978. Compressor Simulation Program with Gas Pulsation. Proceedings International Compressor Engineering Conference, Purdue University.
[6] Ferreira, R. T. S. and Drjesson, J. L. 1986. Analysis of the Influence of valve Geometric Parameters on the Effective flow and force Areas. Proceedings of the International Compressor Engineering Conference at Purdue. pp. 632-646.
[7] D. D. Schwerzler and J. F. Hamilton. 1972. An Analytical Method for Determining Effective Flow and Force Areas for Refrigeration Compressor Valving Systems. International Compressor Engineering Conference, Purdue University.
[8] I. S. Hwang. 2018. A Study on the Prediction of Refrigerant Leakage, Valve Behavior and Superheat for Improving Linear Compressor Performance, Ph.D. Dissertation, Kongju National University.
[9] T. H. Shin, W. W. Liou, A. Shabbir and J. A. Zhu. 1995. A New k-ε Eddy-Viscosity Model for High Reynolds Number Turbulent Flows Model Development and Validation. Computer Fluid. 24(3): 227-238.
[10] M. J. Oliverira. 2013. Modeling thermal compressor reciprocal linear operating without oil lube. Federal de Santa Catarina University, pp. 101-111, 2014 Ansys Fluent V14, Ansys Inc.