International Journal of Emerging Technology and Advanced Engineering
Website: www.ijetae.com (ISSN 2250-2459,ISO 9001:2008 Certified Journal, Volume 5, Issue 8, August 2015)
Finding the Location Based Social Networks
Amol S. Nalge
1, Prof. S. R. Durugkar
21
PG Student, SNDCOE & RC Yeola, Nashik, Savitribai Phule University of Pune, India
2Assistant Professor, Head of Department, SNDCOE & RC Yeola, Nashik, Savitribai Phule Pune University, India Abstract—Different profiles having different community
members. Cluster are used to the Us424er where venue check-in and Venue Check-in details . There are used edge-centric co-clustering model for discover discover the communities. Where the edge clustering algorithm is help us to find out the communities .This are used Inter-mode and intra-mode features are helped to us for making the process. Inter mode means that the data will be easily access and Intra mode is nothing but the data will not be easily accessible we used to intra mode features are used in the detect the community process. M2 (module module) Clustering algorithm is used to find out the community which is base on k-means and HM2(Hierarchy Clustering) algorithm is used to fid out the overlapping communities of Location Based Social Networks and also called as Two-step hierarchical module edge clustering. The structure overlap future detection mechanism. So to time taken by the this two algorithm is very high that s why we use the fuzzy algorithm . This location based social network analyzing 1) Data where it contains , 2) the detected community. 3) solution of the detected cluster using the edge-centric algorithm. The communities are dived into the cluster . The system is classified with 1) feature selection and 2) feature fusion mechanism. This also called as the community detected by the overlap cluster thats why we used the fuzzy
algorithm used to find out the community.
Keywords-- overlapping community detection, M2clustering, HM2clustering, clustering ,Fuzzy algorithm.
I. INTRODUCTION
The socializes network is nothing but the relationships between single cluster,groups or society for overlap clustering. This is used to shows a social stucture determined above both interaction [4]. So we can study the structures of socializes network analysis to identify the overlap structure . We used that partition of the systems according to the properties.
Socialized networks as well as of them and divide it to three type that is a)social psychology b)sociology c) statistics. Sociology emphasizing indicate theories of the data overlapping. the Jacob Moreno is used on web of group find out the with developing [2]. These approaches were mathematically formalized and theories in the 1950s .social phenomena primarily aim to contrebution and investigated the properties of relations between itself. Socializes network is nothing but the sociology, and The social science. With this other complex networks, it show the content of the related field of socialized network .this is to create the special parts of science.
The socialized network is shows a social science structure determined by such component as well as the interaction between themselves. We further vision the rapid development of detected communities in recent years which gap between the human beings and whole world
Whole world means socialized elements on line nothing but the socialized networks with which having the in offline communities .significant means location based social networks (LBSNs, facebook, twitter). It is also work as clustering between the two communities .suppose we want the cluster of twitter user and the another of the face book use people then find out the another cluster from the other than the face book and the twitter user form the dataset using the foursquare API.There for find out the online as well as offline communities then we can detect it on the cluster.
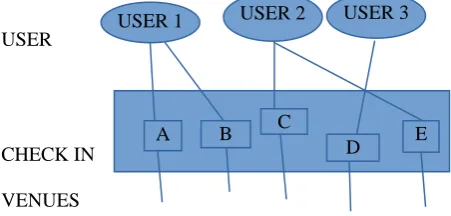
USER
CHECK IN
[image:1.595.315.541.410.518.2]VENUES
Fig. 1. User-venue check-in network example.
II. RELATED WORK
In this section, we briefly review the related work that can be classified into three types of categories.
The first category contains the understanding data of the user behaviors based on LBSNs. [7],[8] analyzed the user venue chech-in,venue user-user geographic and Geo-social properties of four social networks (Facebook, Foursquare, or cut,and Twitter). [9] find out the user dynamics checkin and the find out the pattern of the Foursquare. [10] studied the virtual patterns of Api-users and similar factor affect on the people. Api-users-uses the three features (i.e. tips, what is dones, and what is to-dos). We can studied the group of profiles in LBSNs. Li et al. [12] proposed two various clustering find out the different communities. [12] used a various algorithm which is based on the cluster to group Api data which is related to above categories of user-venues Check-in they had detect the communities and find out the type of activity in each region of a city.
USER 1 USER 2 USER 3
A B C
International Journal of Emerging Technology and Advanced Engineering
Website: www.ijetae.com (ISSN 2250-2459,ISO 9001:2008 Certified Journal, Volume 5, Issue 8, August 2015)
Although we mentioned studies offer important of the properties of user interactions in LBSNs, Our work aims to find out the clusters of communities in an overlapping manner. The second category indicate the find out the community in the social network [2]. In order to find out the communities from a socialized network, one typically choses an function which having the cluster is a data with internal connectivity than external connectivity, and then apply the cluster algorithms to extract clusters by optimizing the objective function. In general,detection of communities can be categories in two approaches: overlapping and non-verlapping approaches. Some of the methods are module maximization [4], [5], Girvan .Newman algorithm [1], Louvain algorithm [6], clique percolation [7], link communities [8], etc. As users425 in LBSNs form the social network form communities, owe can not apply community detection on the network to find out the communities.
The third category focuses is detection of the communities , which are the closest to our work. Most of the existing works on community form the cluster. The main task is to developing a cluster measure from source.This measure, standard k-means cluster algorithms and edge clustering are then applied to form cluster . where the weight of edge is defined as attribute values shared by the two end nodes. we apply graph clustering algorithms on the constructed matrix to perform clustering. The state-of-the-art distance-based approach is the SA-cluster that defined a unified distance measure similarities of the attribute . Communties data and edges are added to the original graph to connect nodes that share the community ,which is form the nearest cluster . Afterward, a cluster algorithm cluster is proposed on the k-means method.
However, all these works in the third and last category attempted to optimize the two communities; thus, the communities detected were not exactly . therefore we detect the community link between users and venue where it is located and also find out the time taken to the detect the community and accuracy of the detected communities structure. Specifically, we formulate time and accuracy to community detection problem into clustering issue, viewing both inter mode links and intra mode attributes of clustering. With this we can show that that the community obtain for the using the clustering algorithms.
III. METHODOLOGY
The community is defined as a cluster check-ins with user and venue as two modes.
We use u = (u1, u2, . . . , um) show the user set, and v = (v1, v2, . . . , vn) to used to refer thevenue category set.
A community Ci(1 ≤ i ≤ k) is a find out users and
[image:2.595.327.547.279.517.2]venue categories, such that k= number of communities. On one hand, the check-in network between u and v category form a matrix M, where each entry MijЄ[0.∞] shows that the 425number of check-ins that Ui has take over vi . Therefore, each user denoted as as a vector of venue category, and each venue category can be denoted as a vector of users. On other side, users and venue categories might have several independent attributes, denoted as (ui1, ui2, . . . , ux), and (uj1, uj2, . . . , uiy), respectively. Normally, every attribute contains a some social part of users or venue categories.
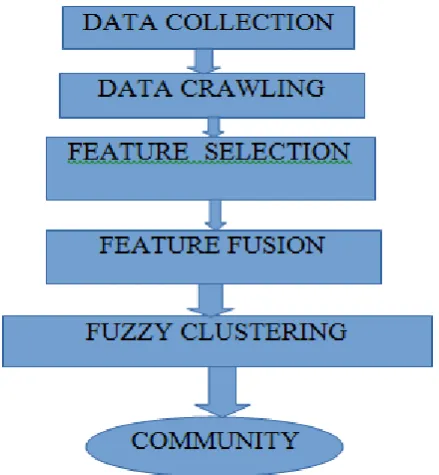
Fig. 2. Community discovering and profiling framework.
For instance, a user has a certain number of followers and followings in Foursquare, and a venue category has a common operating time. Therefore, both the user mode and the venue mode have two types : an inter-mode and an intra mode type of representation respectively.
From above notations, the overlapping community we can find out in LBSNs can be formulated as a multimode and multi-attribute edge-centric co-clustering problem as follows.
Input:
1) A check-in matrix M(|u|×|v|), where u= numbers of users
v= numbers of venue.
2) A user attributes matrix M(|u|×|A|), where |A| =number of user attributes.
International Journal of Emerging Technology and Advanced Engineering
Website: www.ijetae.com (ISSN 2250-2459,ISO 9001:2008 Certified Journal, Volume 5, Issue 8, August 2015)
4) The number of communities k, which is optional based on the clustering algorithm.
Output:
k overlapping communities that consist of both users and venue categories.
IV. MULTIMODE &MULTI-ATTRIBUTE FUZZY
CLUSTERING FRAMEWORK
The key idea of this community discovering and profiling framework is shown in Fig. 1. First, collected data from the cluster and then we select the data feature normalization means that the select the feature and after that data fusion are performed. This is found out the or detected community using Fuzzy clustering algorithm. Finally, by combining the data we can detected communities together with user in meta data.
While the selecting of cluster of the data (i.e. communities) has first task of the finding network and having few challenges to detected that the community. Therefore to find out the communities is very easy to findings the features of each community. Thereby, a large community profiling is used as the community. With the recently people can be used location-based social networks that is LBSNs ( e.g., Foursquare, Face book Places), huge amount of digital footprints such they can collect the data about users locations where it is situated, profiles as well as their on line social connections provide sufficient meta data for community profiling which are useful for the create the cluster in form of the profile . Different from our social media such as (e.g., Flickr, Face book) which having the various groups for users to join with social media as well as the LBSNs usually there have no various communities. In the large number of data users, detected communities and findings its profiling needed so as to find outr the communities such as direct marketing, group tracking, etc. what we can do is that we know theat how the cluster of having the data this cluster take time less as compare to the previous edge clustering algorithm. Therefore we used the user and venue relationship , we find out with a nested large community profiling framework. Specifically, we first find out the edge-clustering for users and venues into communities, and then based on the meta data of users and venues. We put them into the very large community profiling mechanism to show priorities, passion and willingness of a community. The accuracy is validated by intensive empirical evaluations using the collected Foursquare data set of 266,838 users with 9,803,764 check-ins over 2,477,122 venues worldwide Graphs to model relationships among data so the we can increase the our efficiency as well. For large graphs, it is is difficult to display the find out the edge to display they can be seen as the visually scluttered and thus difficult to understand.
Thus proposed a large geometry-based edge-clustering can diveded edges into the bag/sack to reduce the olerlap of the edge. Our method uses guide the edge-clustering process. Edges such as set of bags can be formed by combines all edges to some control points on the mesh. The control of the different levels of details automatically based on underling graph patterns. Users can further face the edge-clustering results through several advanced visualization techniques such as find out the color . Compared with other edge-clustering , our approach is easily find out the communities. This experiments on some large graphs demonstrate the efficiencies of our method. sim form we can also find the efficiency of graph using the [5].sim formula.
A. Feature Description
The intermode is describes the structure communities data that accessible between a check- in user and the other users.
According to [5], we adopt two intermode features (i.e., user-venue and venue-user) where each user is equal to venue that is nothing but the categories and each venue indicate the a vector of nothing but users.
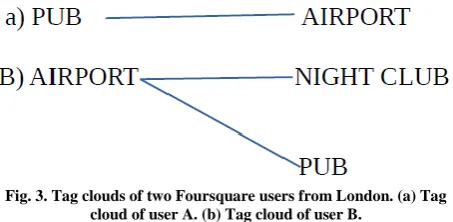
[image:3.595.318.545.448.559.2]The intramode feature is the data can be the not easily accessible to similar attributes . Where node is nothing but the user venue or check ins. We select three intramode based for Foursquare data.
Fig. 3. Tag clouds of two Foursquare users from London. (a) Tag cloud of user A. (b) Tag cloud of user B.
1)Intermode Feature User-Venue Similarity:-
a) from above figure we find out the as cluster can be classifies the venues into sub-categories .
b)we adopt cosine euclidean similarity formula to calculate the user-venue.
2)Intermode Feature Venue-User Similarity:-
a) Data of venue category of Foursquare can be show that the data can be access by as a vector by treating users as features as well .
b)Here Venue are temporal similarity
3)Feature Normalization and Fusion:-
a) we simply calculate the data using the sim x formula into the interval [0, 1] .
b) 1.Intramode Feature: User Social-Influence Similarity:
2.Intramode Feature: User Geo-Span Similarity
International Journal of Emerging Technology and Advanced Engineering
Website: www.ijetae.com (ISSN 2250-2459,ISO 9001:2008 Certified Journal, Volume 5, Issue 8, August 2015)
V. CLUSTERING ALGORITHM
On the above we can describe as the edge clustering problem is converted into an ordinary cluster means we can show fuzziness , which can be handled by using various of clustering algorithms.
There are nothing but the Fuzzy Algorithm to find out the simplest cluster .
The clustering algorithm :
1) Fuzzy based clustering algorithm:- Input:
• E, an edge list such that ei|1 ≤ i ≤ n • k= the number of communities.
k edges are randomly selected .using the sine algorithm and clusterin form algorithm .
• Mu, the user-user similarity matrix • Mv, the venue-venue similarity matrix.
Output:
• D, an edge dendrogram.
Which are the form of the find out the community from various cluster.
V. PERFORMANCE EVALUATION
A. Data Collection
Here Foursquare API provides less action taken on the check-in information; we shows that Facebook to form of clusters, dataset of Facebook choose users from that to obtain the cluster and publish it . Our data collection started from October 24th, 2011 and lasted for eight weeks, which is in a raw dataset of more than 12 million check-ins performed by more than 700 000 users over 3 million venues. In the meantime, we also know that relevant data to users and venues, to show the information of each venue.
B. Experiment Setup
To increase the performance of existing system , we can used the Fuzzy algorithm in which we can find out the important cities such as the we chose three large cities (i.e., London, Los Angeles, and New York). Then we can collect this cities important data suppose the biggest resort in the large cities Then we formulated it on the new cluster . First, collect the data which are the which is important to the data which is unimportant data .the check-ins that are form the other venue , where other venue is used from the datset using the Foursquare API. Second, use the only to create the another cluster.
[image:4.595.335.491.467.678.2]Therefore we can used the two cluster that is on is important data second is the unimportant dataset. Here we can formulate the various of the feature set.
TABLE 1
Different Feature Sets Evaluated in the Experiments
FEATURE SET USED FEATURE
I USER VENUE WHICH ARE IN THE SAME EDGE CLUTERING
II VENUE THAT ARE TEMPORARY SIMILAR
III USER SOCIAL INFLUENCE GROUP
IV USER GEO SPAM SIMILARITY
V FIND THE FINAL CLUSTER.
Here check-ins means find out the region of less data to be occur to clustering formation , which means inactive users/data come with their region are sort out . Finally, users who used Fuzzy algorithm are to form the large data-set ( check-in speed faster than than 1200 km/h, which is the common airplane speed) and check-ins from these users are eliminated as well.
The time is taken for the form the cluster is less as compare to the previous one.
C. Benchmark:-
Thus, we conducted a series of experiments to find out the performance of single algorithm this is nothing but the Fuzzy based algorithm (i.e., M2 Clustering and HM2 Clustering) shown in Table I
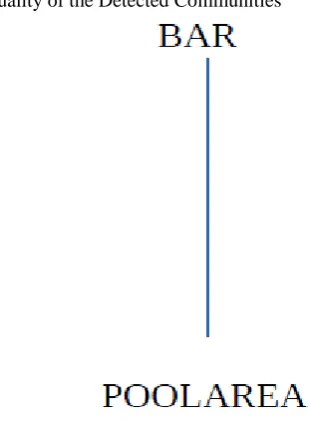
Quality of the Detected Communities
Fig. 4:- Tag clod of one topic in clustering topic model
International Journal of Emerging Technology and Advanced Engineering
Website: www.ijetae.com (ISSN 2250-2459,ISO 9001:2008 Certified Journal, Volume 5, Issue 8, August 2015)
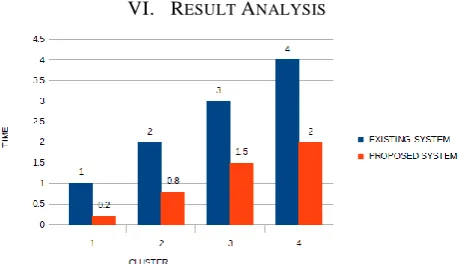
[image:5.595.50.280.134.266.2]VI. RESULT ANALYSIS
[image:5.595.311.549.183.571.2]Fig 5:- Difference between existing and proposed system
Fig 6:- Difference between time taken bey the cluster with efficiency.
VII. CONCLUSION
Thus we can from the user-venue check-in network and user attributes, we proposed a multimode multi-attribute edge Fuzzy clustering framework to detect overlapping communities for LBSNs users. Experimental results showed that the proposed framework was able to discover the communities from different user venue and at several community , which can be used to different applications, such as more than one clustering we reported several cluster to findings the coomunity. The fundamental studied suggested several interesting problems by exploring this Providing a framework to guide the selection and fusion from different cluster features is one direction to work on. The proposed community detection community can also help the study of friend place also .
Acknowledgment
The authors would like to thank all of their colleagues for their discussions and suggestions.
REFERENCES
[1] Zhu Wang ,Daqing Zhang ,Xingshe Zhou, Dingqi Yang, Zhiyong Yu, and Zhiwan Yu,”Discovering and profiling overlapping communities in location based soxcila networks”,IEE TRANSACTION ON SYSTEM, MAN AND CYBERNETICS SYSTEM ,VOL 44 NO.4 APRIL 2014
[2] M. E. J. Newman and M. Girvan, “Finding and evaluating community structure in networks,” Phys. Rev. E, vol. 69, no. 2, pp. 26 113–26 127, 2004.
[3] S. Fortunato, “Community detection in graphs,” Phys. Rep., vol. 486, nos. 3–5, pp. 75–174, 2010.
[4] Y.-Y. Ahn, J. P. Bagrow, and S. Lehmann, “Link communities reveal multiscale complexity in networks,” Nature, vol. 466, no. 7307, pp. 761–764, 2010.
[5] J. D. Cruz, C. Bothorel, and F. Poulet, “Entropy based community detection in augmented social networks,” in Proc. IEEE CASoN, 2011, pp. 163–168.
[6] X. Wang, L. Tang, H. Gao, and H. Liu, “Discovering overlapping groups in social media,” in Proc. ICDM, 2010, pp. 569–578. [7] I. S. Dhillon, “Coclustering documents and words using bipartite
spectral graph partitioning,” in Proc. KDD, 2001, pp. 269–274. [8] S. Scellato, C. Mascolo, M. Musolesi, and V. Latora, “Distance
matters: Geo-social metrics for online social networks,” in Proc. WOSN, 2010, p. 8.
[9] S. Scellato, A. Noulas, R. Lambiotte, and C. Mascolo, “Socio-spatial properties of online location-based social networks,” in Proc. ICWSM, 2011, pp. 329–336.
[10] A. Noulas, S. Scellato, C. Mascolo, and M. Pontil, “An empirical study of geographic user activity patterns in Foursquare,” in Proc. ICWSM, 2011, pp. 570–573.
[11] Z. Cheng, J. Caverlee, K. Lee, and D. Z. Sui, “Exploring millions of footprints in location sharing services,” in Proc. ICWSM, 2011, pp. 81–88.
[12] M. A. Vasconcelos, S. Ricci, J. Almeida, F. Benevenuto, and V. Almeida, “Tips, dones and todos: Uncovering user profiles in Foursquare,” in Proc. WSDM, 2012, pp. 653–662.
[13] N. Li and G. Chen, “Analysis of a location-based social network,” in Proc. CSE, 2009, pp. 263–270.