Journal of Chemical and Pharmaceutical Research, 2015, 7(7):1084-1093
Research Article
CODEN(USA) : JCPRC5
ISSN : 0975-7384
Formulation and characterisation of Simvastatin nanoparticles loaded
transdermal patch
Vijaya Bhaskar N.
1*, Ravi Prakash P.
1and Devanna N.
21
Department of Pharmacetics, Creative Educational Society’s College of Pharmacy, Chinnatekur, Kurnool, Andhra Pradesh. India
2JNTUA College of Engineering, Kalikiri, Chitoor, Andhra Pradesh, India
_____________________________________________________________________________________________
ABSTRACT
The aim of the present study was to formulate and evaluate Simvastatin nanoparticles, loaded into transdermal patch. Simvastatin, a lipid lowering agent, because of its short biological half life (t1/2, 2 hours) only 5% of its dose reaches to the systemic circulation of the blood on oral administration. Hence it is a suitable drug to formulate into transdermal form. Polymeric nanoparticles containing drug and non-toxic biocompatible polymers (chitosan, PLA & PCL) with a surfactant were prepared using solvent evaporation technique. FTIR study reports have shown that there was no interaction between drug and excipients. Nanoparticles were evaluated for their size, poly dispersity index (PDI), entrapment efficiency and in vitro release studies. Scanning electron microscopy reports shown that the nanoparticles are spherical shape and has size range 122.4 – 170.3 nm. PDI was found to be in the range of 0.094 – 0.204. Percent entrapment efficiency was between 82.5±1.6 – 92.8±1.2. Based on the results of the entrapment and in vitro release studies, formulation SP4 (PLA) found to be suitable to formulate into transdermal patch. The nanoparticles were loaded into a transdermal patch formulated using HPMC in varying concentration. All the patches prepared were evaluated for folding endurance, flatness, tensile strength, moisture content and moisture uptake were found to be in necessary range. The in vitro release studies has shown TPN1 was found to be better than other formulations and it was selected as optimised formulation.
Keywords: Simvastatin, biocompatible polymers, nanoparticles, solvent evaporation, transdermal patch.
_____________________________________________________________________________________________
INTRODUCTION
Simvastatin is an antihyperlipidemic drug derived synthetically from a fermentation product of Aspergillus terreus. Simvastatin is a BCS class II drug used with exercise, diet, and weight-loss to control elevated cholesterol, or hypercholesterolemia [1]. Simvastatin is a methylated derivative of lovastatin that acts by competitively inhibiting 3-hydroxy-3-methylglutaryl A (HMG-CoA) reductase, the enzyme that catalyzes the rate limiting step in cholesterol biosynthesis.
Simvastatin is having plasma half life of 2 hrs and poor oral bioavailability (<5%) due to the extensive first pass metabolism. Possible methods to avoid first pass metabolism include transdermal, buccal, rectal, and parenteral routes of administration.
Transdermal delivery can be a potential route for systemic delivery of antihyperlipidemics. Bioavailability can be enhanced via bypassing first pass metabolism. Bypassing the gastrointestinal (GI) tract would obviate the GI irritation that frequently occurs with statin drugs [3]. Steady absorption of a drug for a longer period of time eliminates the need for frequent dosing of the drug which contribute to improved patient compliance [4].
Many strategies have been employed to improve the dermal and transdermal delivery of drugs, e.g. increasing the effective concentration of the drug in the vehicle, improving the partitioning between the formulation and the skin, the use of chemical penetration enhancers and different physical enhancement methods [5, 6]. Furthermore, carrier systems like liposomes, microparticles or nanoparticles [7-9] have been explored. Formulation and evaluation of transdermal drug delivery system of Simvastatin have used natural and synthetic permeation enhancers were reported [10].
Recent advances in nanoparticulate systems for improved drug delivery display a great potential for the administration of a wide variety of active pharmaceuticals [11]. The main challenge in transdermal drug delivery is to overcome the inherent barrier of the skin.
Some of the most widely used polymers in the nanoparticle formulation are poly (lactic acid), poly (glycolic acid), and their co-polymer, poly (lactide- co -glycolide) (PLGA), which are known for their good biocompatibility and resorbability through natural pathways [12]. In oral and parenteral applications, solid biodegradable polymeric NP based on PLGA have shown their advantage over liposomes by their increased stability [13-15], but in the field of
dermal delivery their potential appears to be rather unexplored. Solid lipid nanoparticle (SLNs) of simvastatin
prepared with Trimyristin by hot homogenization followed by ultrasonication method for oral administration was reported earlier [16].
In the present study TDDS formulation was preferred over conventional tablet or capsule formulations, as it has several advantages like it controlled release pattern thus decreasing the dosing frequency [17-20].
The objective of this chapter was to investigate the influence of Nanoparticles on the permeation and penetration of the lipophilic model drug Simvastatin into skin using Chitosan, PLA, PCL as carrier polymer using the solvent evaporation method.
EXPEIRMENTAL SECTION
Materials: Simvastatin (Days healthcare), chitosan, PLA, PCL (Fine chemicals), HPMCK 100M(Yarrow),
tween20, span60 (Molychem). All other chemical and reagents were of analytical grade.
Identification of Drugs:
The obtained sample was examined by infrared absorption spectral analysis and was compared with the reference standard IR spectrum of Simvastatin.
Solubility studies of Simvastatin
Excess drug (25mg) was added to 25ml of purified water, 0.1N HCl, buffer with pH 4.5, 6.8 & 7.4 respectively. Solutions has taken in a series of 50ml stoppered conical flasks and the mixtures were shaken for 48hrs at 37°C on a rotary flask shaker. After 48hrs of shaking to achieve equilibrium, 2ml aliquots were withdrawn at 4hrs interval and filtered immediately. The filtered samples were diluted suitably and assayed for Simvastatin using the HPLC technique.
Standard calibration curve of Simvastatin
A Precise RP-HPLC method can be used to estimate Simvastatin from the formulations. Simvastatin (10mg) was weighed and transferred into 10 ml volumetric flask containing 7 ml of mobile phase (buffer with pH6.8 and acetonitrile in the ratio of 40 : 60). The solution was sonicated for 15 min to dissolve the drug completely and the volume made up with mobile phase to get the concentration of 1 mg/ml solution. Further pipette out 1 ml of the above stock solution into 10 ml volumetric flask and dilute up to the mark with diluents. A series of dilutions ranging from 10-200 µg/ml were prepared. The mobile phase was pumped from the solvent reservoir in the ratio of 40:60 to the column at a flow rate 1ml/min, whereas runtime was set to 14 min. The column was maintained at ambient and the volume of each injection was 20µl. Prior to injection of the solutions, column was equilibrated for at least 30 min with mobile phase flowing through the system. The eluent were monitored at 239 nm. All the
solutions were filtered through 0.22 µ membrane filter. The solutions were injected in triplicate into the HPLC
column, keeping the injection volume constant (20 µl). Chromatograms were recorded at 239 nm and calibration
Compatibility Studies:
The compatibility of drug and polymers under the experimental condition is an important prerequisite before formulation. Incompatibility between drugs and excipients can alter the stability and bioavailability of drugs, thereby, affecting its safety and efficacy. Study of drug–excipients compatibility is an important process in the development of a stable dosage form. Drug–excipients compatibility testing at an early stage helps in the selection of excipients that increases the probability of developing a stable dosage form.
The FT-IR spectra were by using BRUKER spectrophotometer and the spectrum was recorded in the region of
4000-400 cm-1. The samples (drug, polymer and mixture of drug and polymers) were mixed with 200-400 mg of
potassium bromide (KBr). The samples were compressed as discs by applying pressure of 5 tons for 5 minutes in a hydraulic press. The prepared pellet was placed in the light path and the spectrum was recorded.
Method of preparation of Simvastatin polymeric nanoparticles using Solvent extraction method
Polymeric nanoparticles of Simvastatin was prepared by the solvent evaporation method. Required quantity of drug was dissolved in ethanol and 10 mM Tris buffer respectively, and required quantity of polymers such as chitosan, PLA, PCL was dissolved in 0.25% acetic acid, dichloromethane respectively. The drug solution was added in drops to the 2 % Span60 solution and emulsified in a quasi- emulsifier under high pressure homogenization at 20,000 rpm for 15 min. To complete the precipitation process, 200ml of water was added and mixed in a magnetic stirrer. Organic solvent was removed by using Rotovapor. The thus formed nanoparticles suspension was freeze-dried under -20ºC to get free flowing powder of nanoparticles.
Table1 : Formulation Table
S.No Ingredient % w/w SP1 SP2 SP3 SP4 SP5 SP6 1 Simvastatin 0.2 0.2 0.2 0.2 0.2 0.2 2 Chitosan 1 2 0 0 0 0
3 PLA 0 0 1 2 0 0
4 PCL 0 0 0 0 1 2
5 Span 60 2 2 2 2 2 2 6 Dichloromethane q.s q.s q.s q.s q.s q.s
7 Ethanol q.s q.s q.s q.s q.s q.s
8 Acetic acid q.s q.s q.s q.s q.s q.s
Evaluation of nanoparticles Morphology of Nanoparticles
Morphology of nanoparticles was characterised by scanning electron microscope (SEM) [21]. SEM is one of the most limited instruments widely applied to surface microstructure imaging. SEM is a type of electron microscopy that images the sample surface of a solid specimen by using a focused beam of high-energy electrons. Nanoparticles containing Simvastatin was taken in a cover glass and transferred on a specimen stub. Dried samples were coated with a platinum alloy to a thickness of 100° A using a sputter coater. After coating, scanning was done to examine the shape and size.
Particle size distribution:
The size of the nanoparticles was analyzed by using a Zetasizer, Ver. 6.20 (Malvern Instrument Ltd). The formulation was placed in the sample holder and the particle size was measured [22].
Poly dispersibility index (PDI)
Polydispersity index [23] is a parameter to define the particle size distribution of nanoparticles obtained from photon correlation spectroscopic analysis. It is a dimensionless number extrapolated from the autocorrelation function and ranges from a value of 0.01 for mono dispersed particles and up to values of 0.5-0.7. Samples with the very broad size distribution have polydispersity index values > 0.7.
In vitro release studies
Release kinetics studies
To analyze the in vitro release data various kinetic models were used to describe the release kinetics. The zero order rate Eq. (1) describes the systems where the drug release rate is independent of its concentration [24]. The first order Eq. (2) describes the release from the system where release rate is concentration dependent [25]. Higuchi [26] described the release of drugs from insoluble matrix as a square root of time dependent process based on Fickian
diffusion Eq. (3). Where, k0 is zero-order rate constant expressed in units of concentration/time and t is the time.
Q = K0t (1)
Log C = LogC0 − Kt / 2.303 (2)
Where, C0 is the initial concentration of drug and k is first order constant.
= Kt1/2 (3)
Where, K is the constant reflecting the design variables of the system.
The following plots were made:
1. Cumulative % drug release vs. time (zero order kinetic model);
2. Log cumulative of % drug remaining vs. time (first order kinetic model); 3. Cumulative % drug release vs. square root of time (Higuchi model); 4. Log cumulative % drug release vs. log time (Korsmeyer model)
Preparation of nanoparticulated transdermal patches
Transdermal patches were prepared by dissolving varying amounts of HPMC K100M (polymer) and PEG (plasticizer) in 50ml of distilled water. The mixture was soaked overnight to remove air bubbles. 100mg of Nanoparticles were incorporated into the polymeric solution. The prepared solution was poured into glass petri
dishes of 25 cm2 area and dried at room temperature [27, 28]. After 12 h, the patches were cut in 5 cm2 area and
[image:4.595.113.498.435.486.2]packed into aluminum foil until used.
Table 2: Formulation of Transdermal Patch
Form.Code Quantity of Nanoparticles
(mg) Amount of HPMC K100M (mg)
PEG 400 (10%w/w of polymer) (mg)
TPN1 100 500 50
TPN2 100 1000 100
TPN3 100 1500 150
Evaluation parameters for transdermal patches Weight variation
The polymer film with the surface area 5cm2 was cut at 3 different places in the cast film. The weight of each film
strip was taken and average weight variation was calculated.
Thickness of transdermal patches
Thickness of nanoparticulated transdermal patches was measured by digital verniar calipers. The values were taken by triplicate.
Drug content in nanoparticulated transdermal patch
The patches (n=3) of 5 cm2 were weighted and dissolved in 100ml dichloro methane. The solution was filtered
through 0.45 µm membrane filter and samples were analyzed by HPLC method.
Folding endurance:
The folding endurance was measured manually for the prepared patches. It is expressed as the number of times the patch is folded at the same place either to break the patch or to develop visible cracks. This is important to check the ability of sample to withstand folding. This also gives an indication of brittleness [29].
Flatness:
Longitudinal strips will be cut out of the prepared medicated film the lengths of each strip is measured. Then variation in the length due to the non-uniformity in flatness will be measured. Flatness will be calculated by measuring constriction of the strips and a zero percent constriction is considered to be equal to a hundred percent flatness [31].
Constriction (%) = S1 − S2 /S1 × 100
Where, S1- initial length of strip S2 - final length of strip
Tensile strength:
Tensile strength was determined by weight pulley method [32]. The weight required for breaking the patch was taken as a measure of tensile strength of the patch.
Moisture content:
The prepared films were weighed individually and kept in desiccators containing calcium chloride at room temperature for 24 h. The films were weighed again and again after specified interval until they show a constant weight. The percent moisture content was calculated using following formula [33].
% Moisture content= Initial weight-Final weight/Final weight*100
Moisture uptake: Weighed films were taken and exposed to 84% relative humidity using saturated solution of
potassium chloride in desiccators until a constant weight is achieved. % moisture uptake was calculated as given below.
% Moisture uptake = Final weight-Initial weight/Initial weight*100
In vitro drug release studies:
The in vitro drug release of simvastatin was performed by using a modified USP type II dissolution apparatus using 900 ml dissolution medium (pH 6.8 buffer + 1% tween20). A circular patch with an internal diameter of 5.2 cm was used for the study and a stainless steel ring was employed to sink the patch at bottom of dissolution apparatus. All dissolution studies were performed at 37 ±0.5 °C (temperature of the skin) at 100 rpm. Samples were withdrawn at predetermined time intervals and replaced with an equal volume of fresh dissolution media to maintain sink conditions and their concentrations were analyzed using HPLC spectroscopy [34].
To study the release kinetics, data obtained from in vitro drug release studies were fitted in various kinetic models : zero order as cumulative percent of drug released vs. time, first order as log cumulative percentage of drug remaining vs. time and Higuchi’s model as cumulative percent drug released vs. square root of time. To determine the mechanism of drug release, the data were fitted into Korsmeyer and Peppas equation as log cumulative percentage of drug released vs. log time, and the exponent n was calculated from the slope of the straight line. For slab matrix, if the exponent is 0.5, then diffusion mechanism is Fickian; if 0.5<n <1.0, mechanism is non- fickian; if n is 1.0, the mechanism is zero order and if n >1.0, then it is super case II transport [35].
RESULTS AND DISCUSSION
Solubility Studies
The results of solubility studies were given in Table 3. The saturation solubility studies indicated that pH 6.8 phosphate buffer along with 1.0% and 1.5 % tween20 shows maximum solubility compared to other media. Average saturation solubility of simvastatin in purified water was found to be 0.00726 mg/ml. Based upon the solubility results phosphate buffer with pH6.8 and 1% tween 20 was selected as a medium for dissolution studies.
Compatability studies
The characteristic peaks for Simvastatin, viz. –OH stretching at 3550, -Ar-H stretching at 3011, C-H stretching in
CH3 at 2956 & 2872, C=O stretching at 1698, and C=C aromatic stretching at 1466 cm-1 was also noticed in
Table 3: Soubility studies of Simvastatin pure drug
Solutions mg/ml Purified water 0.00726 ± 0.25 0.1N HCl 0.0198 ± 0.19 pH 4.5 0.0124 ± 0.15 pH 6.8 0.05895 ± 0.16 pH 7.4 0.05581 ± 0.21 pH 6.8 + 0.5 % Tween20 0.13542 ± 0.12 pH 6.8 + 1.0 % Tween20 0.89532 ± 0.25 pH 6.8 + 1.5 % Tween20 1.02378 ± 0.32
Particle size and poly dispersity index
[image:6.595.87.531.289.572.2]The nanoparticles size was a very important factor for drug permeation through the skin. Particle size is often used to characterize the nanoparticles facilitation via the skin and understanding of aggregation. In the case of large surface area, the attractive force between the particles and chance for possible aggregation in smaller sized particles. To overcome such aggregation, the addition of a surfactant in the preparation was necessary [36]. Span60 appeared to be the most suitable surfactant for reducing aggregation between nanoparticles, as it suspends quickly after formation.
Fig 1. FTIR Spectrum of Simvastain
The particle size data (Table 4 ) showed that the nanoparticle produced submicron size and had low poly dispersity, which indicate relative narrow size distribution. The formulations SP1-SP6 shows the particle size range between 122.4± 3.4 nm to 170.3± 1.2 nm. The PDI of all formulations was found to be in the range of 0.094-0.204 which concluded that prepared nanoparticle was monodispersed in nature.
Table 4 : Physical evaluation of Simvastatin Polymeric Nanoparticles
[image:6.595.167.448.673.744.2]Fig 2 : FTIR Spectrum of Simvastatin and excipients mixture
Fig 3 : SEM image of SP4 Formulation
An increase in the amount of polymer resulted in the decrease in particle size and PDI. This may be due to the inclusion of the surfactant. Particle size and PDI of PCL Simvastatin nanoparticles (SP4) were found to be 122.4 nm and 0.126. Insufficient polymer synthesis may form polymer with a high PDI that degrade more rapidly. Particle size was a critical factor in the variation of entrapment efficient, drug release, bioavailability, efficiency and penetration via stratum corneum.
Entrapment efficiency:
[image:7.595.145.472.332.583.2]encapsulate large amount of hydrophobic drugs, whereas hydrophilic polymer entrap greater amount of hydrophilic drugs. High entrapment observed in PLA, due to its poor aqueous solubility. The polymeric matrix decreases the drug leakage and drug release.
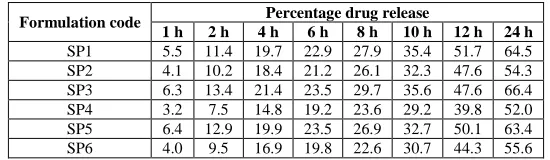
Table 5: In vitro release of polymeric nanoparticles
Formulation code Percentage drug release
1 h 2 h 4 h 6 h 8 h 10 h 12 h 24 h SP1 5.5 11.4 19.7 22.9 27.9 35.4 51.7 64.5 SP2 4.1 10.2 18.4 21.2 26.1 32.3 47.6 54.3 SP3 6.3 13.4 21.4 23.5 29.7 35.6 47.6 66.4 SP4 3.2 7.5 14.8 19.2 23.6 29.2 39.8 52.0 SP5 6.4 12.9 19.9 23.5 26.9 32.7 50.1 63.4 SP6 4.0 9.5 16.9 19.8 22.6 30.7 44.3 55.6
Table 6 : In vitro drug release kinetics from nanoparticles formulations
Formulation code Zero order First order Higuchi Korsmeyer-Peppas Drug release mechanism r2 Slope r2 Slope r2 Slope r2 Diffusion exponent (n)
SP 1 0.968 2.831 0.958 0.019 0.979 16.2 0.988 0.777 Non-Fickian SP 2 0.844 2.334 0.916 0.014 0.941 13.61 0.962 0.812 Non-Fickian SP 3 0.949 2.719 0.986 0.019 0.975 15.42 0.980 0.717 Non-Fickian SP 4 0.934 2.238 0.968 0.013 0.977 13.05 0.980 0.886 Non-Fickian SP 5 0.925 2.628 0.957 0.018 0.947 14.93 0.973 0.708 Non-Fickian SP 6 0.923 2.372 0.953 0.015 0.952 13.71 0.971 0.819 Non-Fickian
The in vitro release of Simvastatin from polymeric nanoparticles exhibited an initial burst effect, which may be due to the presence of some drug particles on the surface of the nanoparticles. The initial rapid drug release ended very early and for the remaining time, nearly linear behavior was observed.The results indicated that some factors such as a drug-polymer ratio governed the drug release from these nanoparticles. Drug release rates were decreased with increasing concentration of polymer in all the formulations. The results shown indicated that the in vitro release of Simvastatin from SP4 was slowest among all formulations. High entrapment of the drug in the nanoparticles was controlling the release of drug from the formulation.
The release kinetics from nanoparticles were shown in Table . All the formulations fit First order model, R2 values
calculated are in the range of 0.916 to 0.986. Value of exponent n from Koresmeyer model was in the range of 0.708 to 0.886. This is an indication that the dominant drug transport mechanism appears to be non-Fickian diffusion (n 0.45 ˂ n=0.89).
Evaluation of transdermal patches
Results of various parameters studied of nanoparticulated transdermal patches were given in Table 7 and were found to be in desired range. Folding endurance test results indicated that the patches would not break and would maintain their integrity with general skin folding when applied. The flatness study showed that all the formulations had the same strip length before and after their cuts, indicating 100% flatness. No constriction was observed; all patches had a smooth, flat surface; and that smooth surface could be maintained when the patch was applied to the skin.
Table 7: Evaluation of various parameters of Transdermal Patch
Parameters TPN1 TPN2 TPN3
Weight variation (g) 0.381 ± 0.023 0.392 ± 0.021 0.398 ± 0.031 Thickness (mm) 0.210±0.011 0.215±0.016 0.230±0.013 Drug content (%) 96.52±1.210 98.53±1.238 96.82±1.569 Folding endurance 86.21±4.231 92.11±4.231 98.14±6.231
Flatness 100 100 100
Tensile strength (Kg/mm2) 3.87±0.013 3.91±0.013 4.02±0.111
Moisture content (%) 2.254±0.534 2.720±0.325 3.103±0.125 Moisture uptake (%) 2.8±0.05 3.1±0.23 3.6±0.09
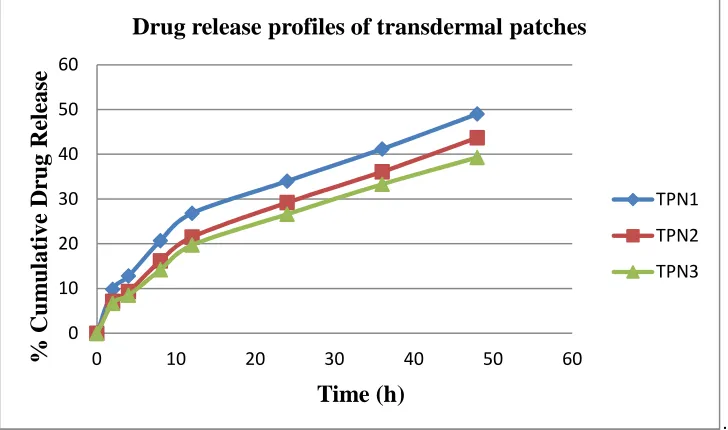
[image:8.595.168.443.133.213.2]The in vitro release profiles of different transdermal patches were shown in Fig 4. The cumulative percentage drug release for TPN1, TPN2 and TPN3 was found to be 49.0±1.3, 43.7±1.5 and 39.3±0.7 respectively at 48 h. It was observed that as the concentration of polymer increases the drug release was found to be decreased. TPN1 which has shown better release can be considered as best formulation.
.
Fig. 4 : Release profiles of Simvastin nanoparticles loaded transdermal patches
Table 8: In vitro kinetics studies of Transdermal patch
Formulation code Zero order First order Higuchi Korsmeyer-Peppas Drug release mechanism r2 Slope r2 Slope r2 Slope r2 Diffusion exponent (n)
TPN1 0.742 1.18 0.956 0.005 0.992 6.997 0.990 0.510 Non-Fickian TPN2 0.842 1.030 0.972 0.004 0.995 6.608 0.991 0.582 Non-Fickian TPN3 0.941 0.748 0.968 0.004 0.996 5.990 0.991 0.576 Non-Fickian
The description of dissolution profile of a model function has been attempted using different kinetics (zero order, first order, Higuchi square root model, Korsmeyer’s Peppas model (Table 8). All the formulations (TPN1-TPN3)
followed first order release kinetics. The correlation coefficients (R2) were found to be in the range of 0.956-0.972.
The data were subjected to Higuchi and the line obtained were comparatively linear (r2 = 0.992-0.996) suggesting
that the diffusion might be of drug release. To confirm further release mechanism of the drug, the data was subjected to Korsmeyer’s Peppas equation. The release exponent ‘n’ value (0.5 < n < 1) of korsmeyer’s peppas model indicated that release of drug from all the patches followed anomalous transport [38].
CONCLUSION
It can be concluded that Simvastatin, poorly water soluble drug converted to nanoparticles, which are then included in Transdermal patch to overcome problems encountered in oral administration. The Simvastatin polymeric nanoparticles were prepared by solvent evaporation method using Chitosan, PLA and PCL as polymers. The physical parameters, entrapment and release studies indicated the formulation SP4 prepared using PLA was suitable to prepare transdermal patch. The transdermal patches containing polymeric nanoparticles using HPMC in varying concentrations were subjected to various parameters and found that formulation TPN1 shown the sustained release over a period of 48 h, which can benefit the patient in decreasing the dosing frequency. So it is concluded that transdermal patch containing polymeric nanoparticles can represent as a potential drug delivery approach for treating hyperlipidemia. Further, it may be used for pharmacokinetic and pharmacodynamic studies in suitable animal models.
Acknowledgement
We also extend our thanks Principal & Management of C.E.S. College of Pharmacy, Chinnatekur, Kurnool for providing necessary facilities to do the research work.
0 10 20 30 40 50 60
0 10 20 30 40 50 60
%
C
u
m
u
lat
ive
D
ru
g R
el
eas
e
Time (h)
Drug release profiles of transdermal patches
TPN1
TPN2
[image:9.595.125.489.131.346.2]REFERENCES
[1] MA Nadkarni; SN Vyas; MS Baghel; B Ravishankar. AYU Int Res J Ayurveda., 2010, 31(3), 287–293. [2] SS Agrawal; P Munjal. Indian J Pharm Sci.,. 2007, 69 (4), 535-539.
[3] S Kumar; LK Tyagi; A Chandra. Int J Pharm Res Dev., 2011, 3(7), 87-95. [4] G Darwhekar; K Jain; KV Patidar. Asian J Pharm Life Sci., 2011, 1(3), 269-277. [5] GW Cleary. Drug Delivery Technol., 2003, 3 (5), 35-40.
[6] BW Barry. Drugs and the Pharmaceutical Sciences, Volume 18, Marcel Dekker, Inc., New York and Basel,
1983; 1-39.
[7] BW Barry. Percutaneous Penetration Enhancers, 2nd edition, CRC press, Taylor & Francis Group. 2006; 3-15.
[8] H Wagner; KH Kostka; W Adelhardt; UF Schaefer . Eur J Pharm Biopharm., 2004, 58 (1),121-129. [9] AK Kohli; HO Alpar. Int J Pharm., 2004, 275 (1-2), 13-17.
[10] P Manisha; A Geeta; SL Harikumar. Der Pharmacia Lettre., 2014, 6 (5), 358-368. [11] DJ Chetty; Chein YW. Crit Rev Ther Drug Carrier Syst., 1998, 15: 629-670. [12] L Brannon-Peppas. Int J Pharm., 1995, 116 (1), 1-9.
[13] ML Hans; AM Lowman. Curr Opin Solid State Mater Sci., 2002, 6 (4), 319-327.
[14] KS Soppimath; TM Aminabhavi; AR Kulkarni; WE Rudzinski. J Controlled Release., 2001, 70 (1-2), 1-20.
[15] MNVR Kumar; M Sameti; C Kneuer C; A Lamprecht; CM Lehr. American Scientific Publishers., 2003, 9 , 1-19.
[16] K Krishnam Raju; B Sudhakar; KV Ramana Murthy. ISRN Nanotechnology., 2014, Volume 2014, 1-8. [17] BW Barry. Eur J Pharm Sci., 2001, 14(2), 101-14.
[18] B Mukherjee; Kanupriya; S Mahapatra; S Das; B Patra. J Appl Res., 2005, 5, 96–108.
[19] A Boucaud; MA Garrigue; L Machet; L Vaillant; F Patat. J Controlled Release., 2002, 81(1-2), 113-9. [20] DM Brahmankar; SB Jaiswal. Biopharmaceutics & Pharmacokinetics – A treatise, I edition. 1995, 333-371. [21] EA Essa. Asian J Pharm., 2010, 4 (4), 227-233.
[22] A Elbary; HM El-laithy; MI Tadros . Int J Pharm ., 2008,357, 189–198.
[23] M Nidhin; R Indumathy; KJ Sreeram; U Balachandran. Bull Mater Sci., 2008 , 31, 93-96.
[24] TP Hadjiioannou; GD Christian; MA Koupparis. VCH Publishers Inc.; New York, USA. Quantitative calculations in pharmaceutical practice and research. 1993 .
[25] DW Bourne; GS Banker; CT Rhodes. Pharmacokinetics. in: Modern pharmaceutics. 4th ed. Eds., Marcel
Dekker Inc, New York, 2002.
[26] T Higuchi. J Pharm Sci., 1963,52,1145–1149.
[27] RV Kulkarni; S Mutalik; D Hiremath. Ind J Pharm Sci., 2002,64 (1),28-31. [28] BJ Munden; HD George; GS Banker. J Pharm Sci., 1967, 53(4), 395-401.
[29] S Raghuraman; R Velrajan; B Ravi; D Jeyabalan; J Benito; V Sankar. Ind J Pharm Sci., 2002, 64(1), 32 -36. [30] VK Devi; S Saisivam ; GR Maria; PU Deepti. Drug Dev Ind Pharm., 2003, 29(5), 495‐503.
[31] P Arora; P Mukherjee. J Pharm Sci., 2002, 91(9), 2076-89.
[32] R Gannu; YV Vishnu; V Kishan; YM Rao. PDA J Pharm Sci Technol., 2008, 62(6), 391-401.
[33] J Bagyalakshmi; RP Vamsikrishna; R Manavalan; TK Ravi; PK Manna. AAPS Pharm Sci Tech., 2007, 8(1), E50-E55.
[34] NK Jain. In Advances in controlled and novel drug delivery, 1st ed., CBS Publishers, New Delhi, 2001, 108. [35] MI Alam; S Baboota; K Kohli; J Ali; A Ahuja. PDA J Pharm Sci Tech., 2009, 63(5), 429-437.
[36] TB Duane;DK Jacqueline; Lisa Brannon-Peppas. J Nanopart Res., 2000, 2(2),173-181.