Journal of Chemical and Pharmaceutical Research, 2014, 6(5):1636-1640
Research Article
CODEN(USA) : JCPRC5
ISSN : 0975-7384
Analysis the environment influence of spatial and temporal variation of strategy of
land-based pollution for river cross section
Xu Jin
1,2*, Chi Yifan
1, Ji Rong
1, Chen Yangyingjie
1and Liu Cheng
11
School of Management, Tianjin University of Technology, Tianjin, China
2
School of Environmental Science and Technology, Tianjin University, Tianjin, China
_____________________________________________________________________________________________ABSTRACT
Bohai is an important supportive system of Bohai regional economic development, with the Bohai coastal region increasing intentive economic development, Bohai environmental pressure is also growing,which is the world's most serious air pollution areas.Bohai regional development plans are included in the national overall development strategy and the area has an important position in the country. A series of water problems such as water shortage, ecological degradation and water pollution faced greatly restrict the economic and social development of the region.Land-based source of pollution is one of the main causes of pollution in the Bohai sea coastal waters, and drainage channel is the main contributor of Land-based source of pollution. In this paper,we choose the main pollution sources and channel section as object of the study of Dagu river which is the main pollution river in Tianjin Bohai area , on the basis of understanding the pollution source emission characteristics,layout sample point and monitoring the water quality changes both of upstream and downstream at point sources of pollution ,analysis the influence of river section and contribution which made by the source points of pollution.Based on single factor evaluation method of principal component analysis method for analysis,using the principle of location selection choose Tianjin Dagu river pollution source location and determine the sampling point.Investigation of historical data and field monitoring of toxic and harmful substances in sewage, to determine the region priority pollutants list and the major pollution sources.Set sampling point both in the upstream and downstream of pollution source.And in order to provide basis for reducing and limiting emissions and setting the control strategy.Some corresponding land-based source of pollution control method and pollution prevention and control strategies was put forward in the paper. In order to improve the efficiency of development and utilization of water resources and protect the environment in Tianjin.
Key Words:land-based sources of pollution, principal components analysis(PCA), factor analysis, priority pollutants, single factor evaluation method
_____________________________________________________________________________________________
INTRODUCTION
_____________________________________________________________________________
1 Inspection Planning and Evaluation Standards 1.1Description of sampling point detection
To study source and effect pollution levels on sewage river water quality.On basis of preliminary work,set two kinds of sampling points in pollution source and channel section,including point set of pollution sources in 50m upstream and 200m downstream.
1.2Research and monitoring of the main pollutants
Research and detection scheme in two stages.On the first stage comprehensive testing analysis to target channel main pollution source water quality by month,determine main pollutants,master pollutant discharge source,emission intensity and spatial characteristics in the test cycle.On the second stage monitoring main pollution sources and water quality of upstream and downstream,analysis and source-analysis impact on the river section of pollution sources.The poisonous and harmful material wait to be detected is DBP,DEHP and benzene series [9].
1.3The evaluation method and standard
This paper adopts single factor index evaluation method to clearly determine main pollution factors, pollution period and pollution area.The nature of Dagu sewage discharge is belong to Ⅴ.Surface water environmental quality class
assessment should be based on the waters functional category which should be achieved."Standard of sewage comprehensive discharge"of the People's Republic of China provisions when water in drainage system of surface water environment quality standard “GB3838-2002 ”[10].
2.Analysis the impact on the river cross section by pollution sources temporal variation 2.1 Analysis the space and time changes of CODCr
Figure (a) as water-stage fluctuation of Dagu river pollution source point and CODCr section.It can be seen,durning the level period and dry season,the larger cross section appear both in Zhijiang drainage outlet and section of north gate outlet.While wet season shows uniform increase.Wet season has plentiful water, the mixture of pollutants dilution effect is stronger; upstream water in north gate section change is bigger,may be because water is less in dry season and single factor index of chemical sewage outlet in Nan Bin is bigger.
(a)Dagu river pollution source point,section CODCr and NH3-N change water period
(b) Dagu river sections CODCr and NH3-N of the water phase change Fig.1 spatial and temporal change analysis of CODCr and NH3-N in Dagu river
Withered water period
0 2 4 6 8 10 12 14 16 18
南滨上 南滨 之江之江下北闸上 北闸 新城大沽上 大沽大沽下 采样点编号
Pollution source Main stream section
High water season
0 2 4 6 8 10 12 14 16
南滨上 南滨 之江 之江下北闸上 北闸 新城 大沽上 大沽 大沽下
采样点编号
COD in dex of sing le fac tor
Normal river flow period
0 1 2 3 4 5 6 7 8 9 U pst re a m o f na n b in z hi j i an g l ow e r r eac he s of U pst re a m o f n ort h g at e N ort h g at e N
ew city
U pst re a m o f d ag u d ag u L owe r r ea c hes of d ag u COD in dex of sing le fac tor inde x of sing le fac tor
Withered water period
0.00 1.00 2.00 3.00 4.00 5.00 6.00 7.00 8.00 9.00
南滨上南滨 之江之江下北闸上北闸 新城大沽上 大沽大沽下
NH3
Error!
Pollution source Main stream section
High water season
0 10 20 30 40 50 60 70 80 90
南滨上 南滨 之江 之江下北闸上 北闸 新城 大沽上 大沽 大沽下
采样点编号
NH3
Error!
Reference source not found.
-N in dex of sing le fac tor
Normal river flow period
0 5 10 15 20 25 30 35 40 45 50 55 60 U pst re a m o f n an b in n
an bin
z hi j i an g L owe r re a che s of z hi j ian g U pst re a m of n o rth n or t h g at e N ort h g at e N
ew city
U pst re a m o f d ag L owe r re ac h es o f d ag u NH3 - N in dex of 0.00 0.50 1.00 1.50 2.00 2.50 3.00 3.50 4.00 4.50 5.00
Upstream of nanbin Lower reaches of zhijiang
Upstream of north gate Upstream of dagu
Lower reaches of dagu
NH3
Error!
Reference
source
Withered water period High water season Normal river flow period
0.00 0.50 1.00 1.50 2.00 2.50 3.00 3.50
Upstream of nanbin Lower reaches
of zhijiang
Upstream of nanbin Upstream of dagu
Lower reaches of dagu
COD ind ex of sin gle fa ct or
_____________________________________________________________________________
2.2Analysis the space and time changes of NH3-N
Figure (b) as temporal and spatial variation of Dagu river pollution source point and NH3- N section.NH3 - N of three water phases in metro station load are significantly higher than main section and other outlet, and NH3 - N of metro station downstream on upstream of Dagu river is the highest.Three phases of water channel section of NH3 - N content from high to low is wet season, dry season and level period.
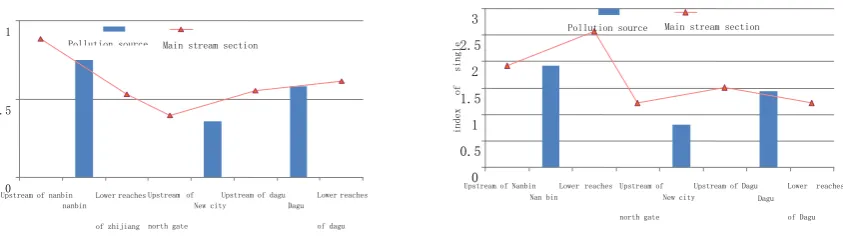
2.3Analysis the space and time changes of TP
Main river section of TP are different with contributor relations and other pollution indicators,except outlet of north gate in wet season, all shows main river section is higher than contributors, description in three water phase point sources on river section of phosphorus pollution contribute nothing or very small.Water from three phase comparison chart shows that phosphorus pollution of Nan Bin in Dagu sewage river section background is serious,the highest standard is 2.5 times.Phosphorus pollution had been emissions to Dagu river before selected background section.The upstream of Dagu has serious TP pollution in wet season may be due to contribution of north gate and metro station.In general, phosphorus pollution of Dagu river exceed, the point source contribution to the TP is very small.
[image:3.595.76.498.290.408.2]2.4Analysis of poisonous and harmful material
Fig. 2 Effect of DBP and DEHP pollution in Dagu river source point on the river bed
Figure 2 as PAEs pollution relationship diagram of Dagu sewage river pollution source point and river section.You can see from picture, two kinds of ester substances shown river section is higher than point source pollution level.DBP and DEHP are both present decline trend.In study area, point source contribution to river pollution of phthalate esters are small. In general,DBP pollution of Dagu river section is serious, almost all levels is overweight,it also checked out DEHP but its can amount to mark.
3.Analysis the pollutant source of river section
Table1 variable variance expression level
Using SPSS software to carry on principal component analysis arithmetic can get cumulative contribution rate shows all percentage of index information that principal component contains.Table 1 is each variable variance expression level.The result of factor analysis is basic effective to each elements.So choose principal factor analysis research of the relationship between all variables are appropriate.Fig3 is main factor characteristic root and variance contribution rates of Dagu river pollutants.Use Kasier as a standard, analysis water body pollution source can get four main factors.This means,ex-four factors explain almost all variance.The Scree test method is according to the shape of figure 4 to determine number of factors.The figure shows that start from the fifth point curve tending to straight line, so extraction of first four factors as the required factors, in accordance with Kasier standard of judgment.First principal factor(F1):The load of Cu,pH is higher,mainly is heavy metal pollution.So F1 can be defined as smelting of pollution sources.F2:Load of NH3-N,TN,TP is high,main performance is eutrophication pollution,it can be defined as living pollution sources.F3:Load of SS and CODCr is higher.Mainly displays in suspended pollution.F4:Zinc,DO as main pollutants.So the fourth principal component defined as chemical source.
Arrangement according to comprehensive score size,get pollution degree of profile ranking in figure 5 and 6. Formulation prevention and control of Dagu sewage river pollution strategy method has important guiding
factor Cu Zn Pb Cd DO T pH CODCr SS NH3-N TN TP
The initial 1.000 1.000 1.000 1.000 1.000 1.000 1.000 1.000 1.000 1.000 1.000 1.000 Extraction 0.971 0.994 0.997 0.985 0.987 0.961 0.991 0.991 0.886 0.979 0.965 0.939
0 0.5 1
Upstream of nanbin nanbin
Lower reaches
of zhijiang Upstream of
north gate New city
Upstream of dagu Dagu
Lower reaches
of dagu
inde
x
of
sing
le
Pollution source Main stream section
0 0.5 1 1.5 2 2.5 3
Upstream of Nanbin Nan bin
Lower reaches
Upstream of
north gate New city
Upstream of Dagu Dagu
Lower reaches
of Dagu
inde
x o
f si
ngl
e
_____________________________________________________________________________
significance.Through observing total score that the most polluted section of Dagu river is nearby chemical and metro station,so we should give more attention to it outlet and metro station.The most polluted section of Dagu chemical sewage outlet is source of F1,F3 and F4,fully explain pollution control should be headed by control of suspended particulate matter and metallurgical forgings.The most polluted area in F2 is new town and Nanbin should be focusing on the control of living source pollution.
Fig3: The regression standard expected value Fig4:scree test plot
Fig5:Cumulative probability of observation Fig6:Regression standard expected value
CONCLUSION
The most polluted Dagu sewage river section is upstream and downstream of Dagu chemical.Organic pollution is focus on CODCr and NH3-N.Nanbin chemical and new pump station mainly emissions chemical electrolytic wastewater,dye and living wastewater contribute.In aspect of heavy metal pollution,Dagu river pollution are mainly composed of Zn,Cr,Cd pollution.Zn is obvious violation,mainly by Nanbin chemical emissions of dye waste water. Electrolytic chemical effluent from Dagu chemical sewage is the largest contribution to Cr, Cd pollution.Esters of Dagu river sewage pollution are mainly composed of DBP pollution.PAEs content of drainage channel background is higher.It is pollution cumulative effect or contribution of sediment pollution. Overall, various pollution sources in wet season have the heaviest load of estuaries and Bohai bay.
Acknowledgments:
This research was supported by the Natural Science Foundation of China(Grant No,71203158)and Humanities and Social Science Foundation of Ministry of Education of China(Grant No,12YJC630248).
REFERENCES
[1]The present situation investigation and control countermeasures of organic pollutants in Bohai sea area of land and nearshore.J.Department of Chinese academy of sciences,2010,69
[2]China's Marine environment quality bulletin in 2005.R.State oceanic administration,2006.The overall planning of environmental protection of Bohai sea..R. 2008
[3] State Environmental Protection Administration of pollution control department.Chinese environmental pollution control countermeasures.M.2008.
_____________________________________________________________________________
[5]Hu Y Y.et al.Response surface optimization determination of pesticide muhiresidues by matrix solid-phase dispersion and gas chromatography.J.Journal of Chromatography A,2005:188
[6] Yin Hailong,Xu Zuxin. J.Resources and environment in Yangtze river basin,2008 (5) : 729-733.
[7]Soonthornnond P,Christensen E R.Source apportionment of pollutants and flows of combined sewer wastewater.J.Water Research,2012:1989-1998.
[8]Christensen E R,Arora S.Source apportionment of PAHs in sediments using factor analysis by time records,USA.J.Water Research,2011:168-176.
[9] Hu Cheng,et al.The source of pollutants in water environment analysis method and its application.J.Water resources protection, 2010: 57-69.