Data in Brief
Transcriptome analysis of the mouse E14.5 (TS23) developing humerus
and differential expression in muscle-less mutant embryos lacking
mechanical stimulation
Rebecca A. Rolfe
a,b,⁎
, Elaine M. Kenny
c, Paul Cormican
c, Paula Murphy
a,b aDepartment of Zoology, School of Natural Sciences, Trinity College Dublin, Dublin, Irelandb
Trinity Centre for Bioengineering, School of Engineering, Trinity College Dublin, Dublin, Ireland
c
TrinSeq, Institute of Molecular Medicine, Ireland
a b s t r a c t
a r t i c l e i n f o
Article history:
Received 12 February 2014
Received in revised form 11 March 2014 Accepted 12 March 2014
Available online 22 March 2014
Keywords:
Transcriptome Skeletal development Humerus
Mechanical stimulation Gene expression Microarray TS23
Mechanical stimulation is important for the correct formation of the skeleton. Splotch-delayed mutant embryos (Pax3Spd/Spd) that develop with no limb muscle and therefore no limb movement experience an altered mechan-ical environment resulting in specific defects in ossification and joint formation, particularly in the forelimb. To test the hypothesis that mechanical stimuli influence the regulation of genes important in skeletal development we generated a transcriptome profile of the developing humerus at Theiler stage 23 (TS23), and then identified differentially expressed genes in muscle-less mutant embryos compared to control littermates. Here we describe the experimental methods and analysis of the resulting data, publically available in the ArrayExpress database under E-MTAB-1745 (Transcriptome of control humerus), E-MTAB-1744 (Microarray; differential expression) and E-MTAB-1746 (RNA-sequencing; differential expression). Our data provide a resource for exploring the tran-scriptome that underlies skeletal development at TS23 in the mouse humerus. The interpretation and description of this data can be found in a recent publication inBMC Genomics[1]. This is a resource for exploring the molecular mechanisms that are involved in skeletal development and mechanotransduction.
© 2014 The Authors. Published by Elsevier Inc. This is an open access article under the CC BY-NC-ND license (http://creativecommons.org/licenses/by-nc-nd/3.0/).
Specifications
Organism/cell line/tissue Mus musculusembryo, humerus, TS23 Strain C57BL/6Pax3Spd/+
, C57BL/6Pax3Spd/Spd
Sequencer or array type Agilent Mouse GE v2 Microarrays (4x44K format) Illumina GAII—RNA sequencing
Data format Raw and processed Experimental factors Muscle-less mutant–v-control
Experimental features The purpose of this profiling analysis was to identify differentially expressed genes between muscle-less and control embryonic (TS23) humerus tissue, in order to determine mechanosensitive genes that impact skeletal development.
Consent n/a
Direct link to deposited data
Deposited data can be found here:http://www.ebi.ac.uk/arrayexpress/ experiments/E-MTAB-1744/(Microarray; differential expression),http:// www.ebi.ac.uk/arrayexpress/experiments/E-MTAB-1745/(Transcriptome
⁎ Corresponding author.
E-mail address:[email protected](R.A. Rolfe).
of control TS23 humerus) and http://www.ebi.ac.uk/arrayexpress/ experiments/E-MTAB-1746/(RNA-sequencing; differential expression).
Experimental design, materials and methods
Mouse model & RNA extraction
Heterozygous C57BL/Pax3Spd(Jackson Laboratory, Maine USA) mice were time-mated to produce homozygousPax3Spd/Spdmutant embryos and littermate controls (Pax3Spd/+). All animal work was carried out
under the guidelines of the Trinity College Dublin Bioresources Unit and Bioethics Committee. All embryonic material was harvested and staged according to Theiler criteria[2] to obtain Theiler stage 23 (TS23), embryos at embryonic day 14.5 (E14.5). All the embryos were genotyped[3]following PCR amplification to confirm homozygote mutants and distinguish heterozygote and homozygote wildtype littermates. The forelimb wasfinely micro-dissected from control and mutant (Pax3Spd/Spd) embryos and the humerus and associated joints removed. The humeri were pooled from multiple embryos of the same genotype (2–4) totalling between 4–8 humeri for RNA extraction per replicate. Tissue was mechanically homogenised using a motor operat-ed pestle and mortar system in appropriate extraction buffer and total
http://dx.doi.org/10.1016/j.gdata.2014.03.003
2213-5960/© 2014 The Authors. Published by Elsevier Inc. This is an open access article under the CC BY-NC-ND license (http://creativecommons.org/licenses/by-nc-nd/3.0/). Contents lists available atScienceDirect
Genomics Data
RNA was extracted (SV Total RNA Isolation System: Promega, UK). RNA quantity and integrity were assessed on a 2100 Bioanalyser (Agilent Technologies). RNA samples with RNA integrity number (RIN) values greater than 8 were used for microarray and RNA-sequencing analy-sis. Details of the samples used for array hybridization and RNA-sequencing as described in ArrayExpress are shown inTable 1.
Microarray study design
[image:2.595.41.560.76.165.2]Four independent pooled sets of biological replicate samples were used for microarray (n = 4 biological replicates) analysis, as shown in Table 1. All microarrays were processed at IMGM® Laboratories (Martinsried, Germany). The protocol involved the reverse transcrip-tion of 100 ng of total RNA per sample into cDNA and then the conver-sion into labelled cRNA by in vitro transcription (Low input quick-amp labelling kit one-colour, Agilent Technologies) incorporating cyanine-3-CTP. All cRNA was quality control checked to asses yield and activity prior to hybridisation. The cRNA values ranged from 4.53μg to 1.70μg and completely fulfilled the quality criteria defined by Agilent. The cRNA was cleaned up and quantified and 1.65μg of each Cyanine-3-labelled cRNA sample was fragmented and prepared for one-colour based hybridisation (Gene Expression Hybridisation Kit, Agilent Technologies). The cRNA samples were hybridised at 65 °C for 17 h on separate Mouse GE v2 Microarrays (4x44K format) (G4846A, Agilent Technologies), which contain 39,485 coding and non-coding sequences of the mouse genome. Microarrays were then washed with increased stringency using Gene Expression Wash Buffers (Agilent Technologies) followed by drying with Acetonitrile (Sigma). Fluorescent signal
intensities were detected with Scan Control A.8.4.1 software (Agilent Technologies) in the Agilent DNA microarray scanner and extracted from the images using Feature Extraction 10.7.3.1 software (Agilent Technologies). A workflow of the individual protocol followed for microarray preparation can be seen inTable 2.
RNA-sequencing alignment
A total of six independent DNase-treated RNA (3μg) samples of the control and mutant preparations, as indicated inTable 1, were used to prepare RNA-sequencing libraries with the TruSeq RNA Sample Prep kit for RNA-sequencing. Libraries were prepared according to the Illumina protocol (Illumina Part #15008136 Rev. A) and sequenced on an Illumina GAII sequencer (Trinity Genome Sequencing Laboratory, Institute of Molecular Medicine, Trinity College Dublin, Ireland). The workflow to prepare the libraries consisted of purification and fragmen-tation of the mRNA,first strand cDNA synthesis, second strand cDNA synthesis, repair of fragmented ends into blunt ends, adenylate 3′ ends, ligation of adapters, PCR amplification and library validation. The six constructed cDNA libraries represent triplicate biological replicates for each group. 40 bp single end reads were obtained from an Illumina GAII in FASTQ format, with one sample per sequencing lane (n = 6). The Tophat aligner (http://tophat.cbcb.umd.edu/) was used to align the reads to the mouse reference genome (mm9). After alignment the read counts for each gene were extracted using htseq-count (http:// www-huber.embl.de/users/anders/HTSeq/) based on an mm9 Refseq gfffile. A workflow of the individual protocols followed for RNA-sequencing preparation can be seen inTable 2.
Table 1
Details of samples used for microarray hybridization and RNA-sequencinga.
Source name Organism Part Developmental stage Genotype Experimental procedure RINb
RS-209_01 Control 1 Mus musculus Humerus Theiler stage 23 Splotch-delayed (Pax3Spd/+
) Microarray & RNAseq 9.1 RS-211_08 Control 2 Mus musculus Humerus Theiler stage 23 Splotch-delayed (Pax3Spd/+
) Microarray & RNAseq 9 RS-211_09 Control 3 Mus musculus Humerus Theiler stage 23 Splotch-delayed (Pax3Spd/+
) Microarray 8.5
RS-211_10 Control 4 Mus musculus Humerus Theiler stage 23 Splotch-delayed (Pax3Spd/+
) Microarray & RNAseq 8.1 RS-209_03 Mutant 1 Mus musculus Humerus Theiler stage 23 Splotch-delayed (Pax3Spd/Spd) Microarray & RNAseq 9.2
RS-211_04 Mutant 2 Mus musculus Humerus Theiler stage 23 Splotch-delayed (Pax3Spd/Spd
) Microarray & RNAseq 8.4 RS-211_06 Mutant 3 Mus musculus Humerus Theiler stage 23 Splotch-delayed (Pax3Spd/Spd
) Microarray & RNAseq 8.2 RS-211_07 Mutant 4 Mus musculus Humerus Theiler stage 23 Splotch-delayed (Pax3Spd/Spd
) Microarray 9
a
[image:2.595.44.577.566.735.2]Source name as defined in ArrayExpress database. b RIN: RNA integrity number.
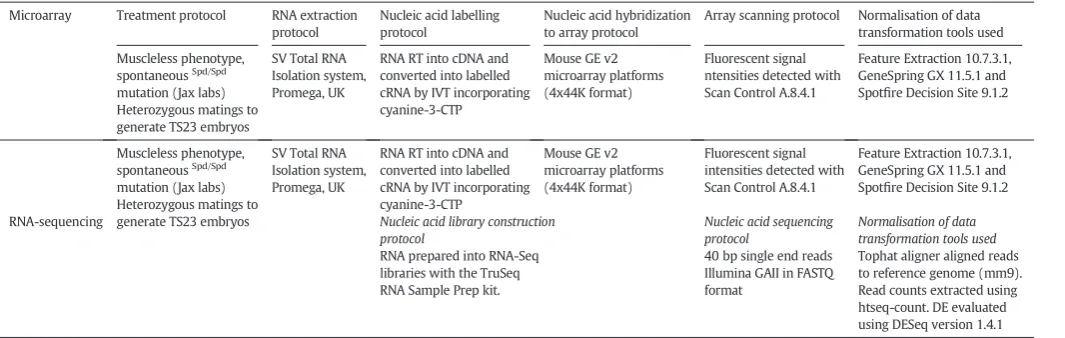
Table 2
Details of protocols used for microarray hybridization and RNA-sequencing*.
Microarray Treatment protocol RNA extraction protocol
Nucleic acid labelling protocol
Nucleic acid hybridization to array protocol
Array scanning protocol Normalisation of data transformation tools used
Muscleless phenotype, spontaneousSpd/Spd mutation (Jax labs) Heterozygous matings to generate TS23 embryos
SV Total RNA Isolation system, Promega, UK
RNA RT into cDNA and converted into labelled cRNA by IVT incorporating cyanine-3-CTP
Mouse GE v2 microarray platforms (4x44K format)
Fluorescent signal ntensities detected with Scan Control A.8.4.1
Feature Extraction 10.7.3.1, GeneSpring GX 11.5.1 and Spotfire Decision Site 9.1.2
Muscleless phenotype, spontaneousSpd/Spd mutation (Jax labs) Heterozygous matings to generate TS23 embryos
SV Total RNA Isolation system, Promega, UK
RNA RT into cDNA and converted into labelled cRNA by IVT incorporating cyanine-3-CTP
Mouse GE v2 microarray platforms (4x44K format)
Fluorescent signal intensities detected with Scan Control A.8.4.1
Feature Extraction 10.7.3.1, GeneSpring GX 11.5.1 and Spotfire Decision Site 9.1.2
RNA-sequencing Nucleic acid library construction protocol
Nucleic acid sequencing protocol
Normalisation of data transformation tools used
RNA prepared into RNA-Seq libraries with the TruSeq RNA Sample Prep kit.
40 bp single end reads Illumina GAII in FASTQ format
Tophat aligner aligned reads to reference genome (mm9). Read counts extracted using htseq-count. DE evaluated using DESeq version 1.4.1
Whole transcriptome profile of developing humerus at TS23
The three constructed libraries of the TS23 control developing humerus samples representing distinct biological replicates were se-quenced using Illumina GAII and aligned to the mm9 mouse reference genome. Following alignment, an average read count value was com-puted from the three replicates and the total number of transcripts with greater than/equal to 5 reads were defined as expressed.
Differential expression quantification
Microarray
The software tools Feature Extraction 10.7.3.1, GeneSpring GX 11.5.1 (both Agilent Technologies) and Spotfire Decision Site 9.1.2 (TIBCO) were used for quality control and statistical data analysis. Quantile normalisation was applied to each data set in order to impose the same distribution of probe signal intensities for each array[4], thus adjusting them to a uniform level that can allow for comparable downstream analysis. Welch's approximatet-test (“unpaired unequal variance”, parametric) was applied to compare the control and mutant groups. A corrected p-value was calculated based on the algorithm of Benjamini and Hochberg[5], based on control of the false discovery rate (FDR). In each comparison, two groups were compared in a pairwise manner. The extent and direction of differential expression between the groups were determined by calculating a fold change value. A fold change of≥2 and FDR-adjusted p-value of≤0.05 were used as criteria to indicate differential expression (DE) between the two groups. For example a fold change value of 2 indicates a two-fold induction or up-regulation, and a fold change of−2 indicated a two-fold repression or down-regulation. The two-fold change threshold signifies that probes are induced by a factor of 2 (equal to 100% increase in averaged normalised signal) or repressed by the same factor (equal to a decrease of the initial signal by 50%).
RNA-sequencing
Differential expression (DE) at a gene level in our two groups (control and mutant) was evaluated using DESeq version 1.4.1, imple-mented in R 2.14.1. DESeq uses a negative binomial distribution to model genic read counts following normalisation based on size factors and variance. As with the microarray data the extent and direction of differential expression was determined by calculating a fold change value. The read count for an expressed gene from the control sample (n = 3) was directly compared to the read count from the mutant (n = 3) in order to obtain the fold change value. Values≥2 were taken as an indication of induction or up-regulation of expression, while values ≤0.5 were taken to indicate repression or down-regulation of expression. The p-values presented are adjusted for multiple-testing with the procedure of Benjamini and Hochberg to
control the type I error rate, and a cut off of p≤0.05 was used as a threshold to define differential expression (Table 3).
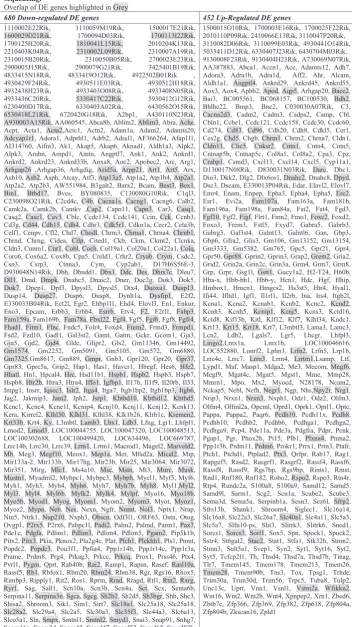
Discussion
The data described here catalogue the transcriptome of a developing skeletal rudiment (humerus; TS23), as well as reveal differentially expressed genes between humeri developing normally and humeri with reduced mechanical stimulation(Table 3). These datasets have re-cently been analysed and interpreted to reveal aspects of the molecular mechanisms involved in mechanotransduction during skeletal develop-ment[1]. Here we describe the publically available datasets in order to facilitate future analyses and integration with other appropriate studies. The normal transcriptome (E-MTAB-1745) provides a valuable resource to help understand the processes that are occurring during skeletogenesis at this stage of development when ossification and joint specification is occurring. These data can be used in combination with other genome wide databases and tools, for example EurExpress (www.eurexpress.org) which examines the spatial expression patterns of 18,000 coding genes and over 400 microRNAs in the whole mouse embryo at the same developmental stage examined here, TS23[6]. Combining these resources gives information on the quantitative and spatial expression of individual genes providing the basis to explore reg-ulatory networks active during the development of skeletal rudiments. Differential expression was revealed by both Microarray (374) and RNAseq (1037) approaches with RNAseq showing greater sensitivity in this respect[1]. These datasets can now be mined and integrated with the results of other experiments examining the impact of mechan-ical stimuli on developing tissues (e.g.[7]) and cells (e.g.[8]), focusing perhaps on specific pathways or genes. This holds the potential to reveal highly informed and supported hypotheses to drive functional studies, for example, asking if similar pathways and component genes are affect-ed by mechanical stimuli in different biological contexts.
Conflict of interest
The authors declare that they have no conflicts of interest.
References
[1] R.A. Rolfe, et al., Identification of mechanosensitive genes during skeletal develop-ment: alteration of genes associated with cytoskeletal rearrangement and cell signal-ling pathways. BMC Genomics 15 (1) (2014) 48.
[2] K. Theiler., The House Mouse. Springer, Berlin, Heidelberg, New York, 1972.
[3] C.R. Keller-Peck, R.J. Mullen, Altered cell proliferation in the spinal cord of mouse neu-ral tube mutants curly tail and Pax3 splotch-delayed. Brain Res. Dev. Brain Res. 102 (2) (1997) 177–188.
[5]Y. Benjamini, Y. Hochberg, Controlling the false discovery rate: a practical and powerful approach to multiple testing. J. R. Statist. Soc. B. 57 (1) (1995) 289–300.
[6] G. Diez-Roux, et al., A high-resolution anatomical atlas of the transcriptome in the mouse embryo. PLoS Biol. 9 (1) (2011) e1000582.
[7]C.M. Reijnders, et al., Increased expression of matrix extracellular phosphoglycoprotein (MEPE) in cortical bone of the rat tibia after mechanical loading: identification by oligonucleotide microarray. PLoS One 8 (11) (2013) e79672.