IJPSR (2013), Vol. 4, Issue 8 (Research Article)
Received on 04 April, 2013; received in revised form, 24 May, 2013; accepted, 27 July, 2013; published, 01 August, 2013
SYSTEMATIC FORMULATION DEVELOPMENT OF IMMEDIATE RELEASE TABLET DOSAGE FORM USING QUALITY BY DESIGN APPROACH
Namrata Saxena* and Birendra Shrivastava
Mylan laboratories Limited, Plot No. 34A, Anrich Industrial Estate, Bollaram, Jinnaram Mandal, Medak district, Andhra Pradesh, India
ABSTRACT: The main goal of this study was to develop a stable formulation of model antibacterial drug as an immediate- release tablet systematically using Quality by Design approach of which design of experiments is an integral part. The model drug was found to be a BCS class II drug official in USP having a plasma half-life of three to four hours. The formulation development work was initiated with wet granulation method and a total of three trials were conducted to determine the critical material attributes of the formulation used as factors for the experimental designs. The binder (Povidone K29/32,), Superdisintegrant (Crosscarmellose Sodium), Lubricant (Stearic acid and magnesium stearate), Pregelatinized Starch 1500 (binder and disintegrant) were determined to be critical for the formulation of the model antibacterial drug. A fractional factorial design (FFD) for four factors at two levels was selected to screen the varied response variable. A total of eight trials were conducted (24-1FFD).The four factors viz. Povidone K29/32(X1), Crosscarmellose Sodium (X2), lubricant ratio (X3) and Pregelatinised starch 1500 IG:EG (X4) were varied as required by the experimental design and the factor levels were coded. (+1 for high and -1 for low). Disintegration time was taken as response variable. A central composite design (CCD) for two factors at three levels was selected to optimize the varied response variable. A total of thirteen trials were conducted. The two factors viz. PovidoneK29/32 (X1), Crosscarmellose Sodium(X2), were varied as required by the experimental design and the factor levels were coded. (+1 for high, 0 for moderate and -1 for low). Friability (5) and in vitro % drug release in 5 minutes (Q5) were taken as response variables. The formulated tablets were evaluated for various precompression parameters like bulk density, tapped density, Carr’s index, Hausner’s ratio and post compression parameters like thickness, hardness, weight variation, friability, disintegration test and in vitro drug release studies. From this study, it was concluded that optimized formulation containing Crosscarmellose Sodium (8.16%) and Povidone K29/32(1.37%) showed satisfactory friability, in vitro % drug release at 5 mins (Q5) and other physical characteristics of immediate release tablets. A design space was created using desired levels of response variables. A composition was selected within design space as optimized formulation and internally validated. Linear correlation plots were drawn for the predicted and observed responses.
INTRODUCTION: Bacterial disease is the widespread disease affecting almost majority of the
population worldwide 1.
QUICK RESPONSE CODE
DOI:
10.13040/IJPSR.0975-8232.4(8).3110-24
Hence, a suitable antibacterial model drug was chosen for formulation development as it is the drug of choice for the bacterial diseases (Respiratory tract diseases and moderate skin infections). However, formulation development of robust immediate release tablet of the given drug requires a plethora of excipients. An appropriate
Keywords:
Model antibacterial drug BCS II, Immediate release tablet, Wet granulation, Quality by Design, statistical design of experiments,
Design Space
Correspondence to Author:
Namrata Saxena,
M. Pharmacy Scholar,
(Pharmaceutical Quality Assurance), School of Pharmaceutical Sciences, Jaipur National University, Jaipur-302025, Rajasthan, India
This cannot be achieved by traditional approaches of changing one variable at a time (OVAT).
The traditional approach tests product quality by checking it against the approved regulatory specifications at the end of manufacturing stream at great effort and cost. Also, there is a great deal of unpredictability in scaling up a product from research and development to production scale and reasons for failure are generally not understood. Failure of products to comply with their specifications would amount to either rejection of the batch or reworking of the batch with increased cost and regulatory burden. Post approval changes even of non-critical nature will need pre approval by the regulatory authorities. To sustain market competition, a sound knowledge and understanding of product and process is necessary. This scientific understanding facilitates establishment of an expanded design space.
The traditional approach to drug-design
experimentation requires that only one factor at a time be changed while keeping all other variables constant. This approach has many major flaws, but the two most egregious ones are: It cannot assess factor interactions, which in pharmaceutical processes must be anticipated and it covers a small fraction of the total feasible factor space. Statistical design of experiments (DoE), a matrix-based multifactor method, measures interaction effects and it encompasses the entire multidimensional experimental region. Aided by the software programmed for this purpose, DoE has become recognized as an important tool for more rapid pharmaceutical process and product development.
Hence the current work is focused on systematic development of immediate release product using a
holistic approach of Quality by Design 1, 2 of which
Design of Experiments 3 is an integral part.
Fractional Factorial Design 4 is a convenient and
economical experimental design chosen for screening as it gives a minimum number of experiments compared to a full factorial design (FD). The rotatable central composite design is widely employed for optimization problems and has the advantage over the orthogonal design, that the variance of the predicted response is a function of only the distance from the centroid irrespective of direction.
Immediate release dosage forms 5 are formulated to
release the active drug immediately after oral administration, to obtain rapid and complete
systemic drug absorption. Such IR 6 products result
in relatively rapid drug absorption and onset of accompanying pharmacodynamic effects. The given model drug is an Immediate release tablet prepared by wet granulation.
The main aim of the work is to optimize and evaluate the immediate release tablets of a model antibacterial drug through Quality by Design using Design of Experiments so as to overcome the drawbacks of OVAT. The major objective of the present investigation was to minimize the disintegration time, to maximize the percent drug release, to create a design space and select an optimum formulation and to validate the Model.
MATERIALS AND METHODS 7, 8 : Model drug was procured from Mylan laboratories limited,
Hyderabad, India. Crosscarmellose sodium 9 and
Avicel (PH 101 and PH 102) were procured from FMC-Bio polymer, Mumbai, India. Pregelatinised starch was procured from Colorcon, Goa. Povidone IP (K-30) was supplied by BASF. Aerosil 200 Pharma was supplied by EVONIK. Stearic acid and Magnesium stearate were procured from Ferro, Hyderabad. All other ingredients used were of Analytical grade. All materials used throughout the study conformed to USP XXIV standards.
Preparation of Model Drug Immediate release tablet 10, 11: Prescreening Trials, Screening Trials and Optimization Trials were conducted. DoE validation and selection of optimum formulation was carried out. 500mg of the model drug was fabricated. Model drug 500 mg, Avicel PH 101, pregelatinised starch 1500 and crosscarmellose sodium (Ac-Di-Sol) sifted through #30 ASTM
sieve was granulated 12, 13 with Povidone k29/32
solution( dissolved in sufficient quantity of purified water to get a clear solution).
The wet coherent mass was dried in hot air over at
a temperature of 60±10oC until the moisture
content 14 of granules was NMT 2% and passed
The above granules were lubricated with specified quantity of stearic acid (as applicable) and magnesium stearate sifted through #60 ASTM sieve and mixed for 2-3 minutes. Precompression
parameters (Bulk density, Tapped density,
Compressibility index, and Hausner’s ratio) of the
granules 15 were evaluated before compression into
tablets. The granules were compressed using 19 X 8.5mm capsule shaped, biconcave, punches. The weights of the tablets was kept constant, which was 965 mg for all formulations. Prescreening Trials were performed to determine the Critical Material Attributes. To screen out the critical material attributes, different tablet formulations of model antibacterial drug were formulated using varying amounts of binder, disintegrant, lubricant (i.e.
Povidone K29/32, Crosscarmellose Sodium,
lubricant ratio and Pregelatinized Starch 1500 IG:EG) and Microcrystalline Cellulose PH 102 as inert diluent along with a fixed quantity of Aerosil 200 Pharma as glidant. Microcrystalline Cellulose PH 101 was taken in a sufficient quantity to
maintain a constant tablet mass of 965 mg. Table 1
shows the formulation batches of prescreening
trials. Table 2 shows the formulation batches of
screening trials.
A fractional factorial design (FFD) for four factors at two levels was selected to screen the varied response variable. The four factors viz. Povidone
K29/32(X1), Crosscarmellose Sodium (X2),
lubricant ratio (X3) and Pregelatinized Starch 1500 IG: EG (X4) were varied as required by the experimental design and the factor levels were coded. (+1 for high and -1 for low) Disintegration
time was taken as response variable. Table 3
shows the factor combinations as per chosen experimental design, FFD.
To optimize the formulation, different tablet formulations of model antibacterial drug were formulated using varying amounts of binder and
disintegrant (Povidone K29/32 and
Crosscarmellose Sodium) Microcrystalline
Cellulose PH 102 as inert diluent along with a fixed quantity of lubricant (stearic acid and magnesium stearate), Pregelatinized Starch 1500 and Aerosil 200 Pharma (glidant). Microcrystalline Cellulose PH 101 was taken in a sufficient quantity to maintain a constant tablet mass of 965 mg.
Table 4 shows optimization trials of formulation development.
A central composite design (CCD) for two factors at three levels was selected to optimize the varied response variable. The two factors viz. Povidone K29/32(X1), Crosscarmellose Sodium(X2), were varied as required by the experimental design Friability and dissolution (Q5) were taken as
response variables. Table 5 shows factor
[image:3.612.63.553.483.706.2]combinations as per chosen experimental design, CCD.
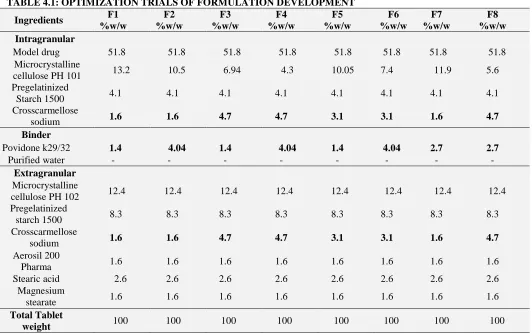
TABLE 1: FORMULATION OF PRESCREENING TRIAL BATCHES
Ingredients F1%w/w F2 %w/w F3 %w/w
Intragranular
Model drug 51.8 51.8 51.8
Microcrystalline cellulose PH 101 15.5 9.8 7.3
Pregelatinized starch 1500 4.1 4.1 4.1
Crosscarmellose sodium 4.1 4.1 4.1
Binder
Povidone k29/32 2.07 2.07 2.07
Purified water - - -
Extragranular
Microcrystalline cellulose PH 102 12.4 12.4 12.4
Pregelatinized starch 1500 - 8.3 8.3
Crosscarmellose sodium 4.1 4.1 4.1
Aerosil 200 Pharma 1.6 1.6 1.6
Stearic acid 2.6 - -
Magnesium stearate 1.6 1.6 4.1
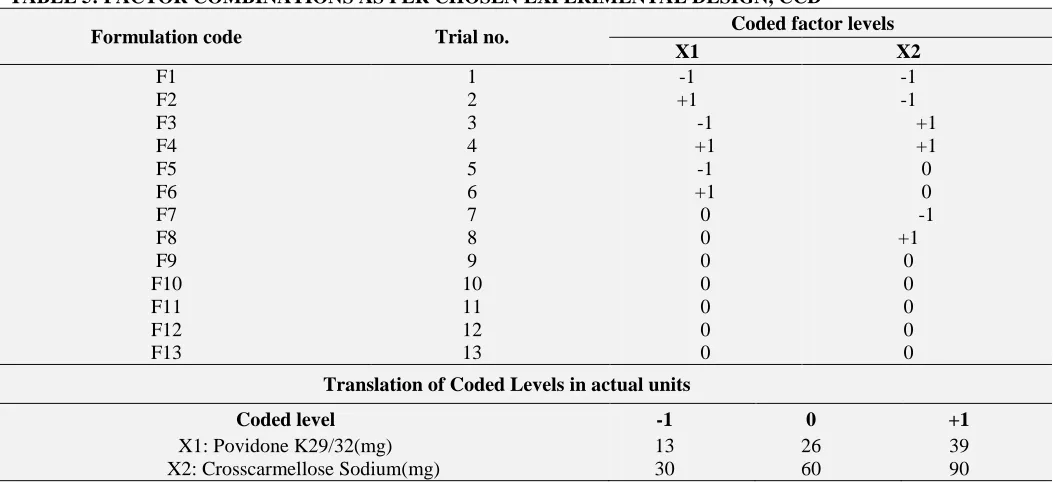
TABLE 2: SCREENING TRIALS OF FORMULATION DEVELOPMENT
Ingredients F1
%w/w
F2 %w/w
F3 %w/w
F4 %w/w
F5 %w/w
F6 %w/w
F7 %w/w
F8 %w/w Intragranular
Model drug 51.8 51.8 51.8 51.8 51.8 51.8 51.8 51.8
Microcrystalline
cellulose PH 101 8.3 12.4 6.2 6.2 8.3 4.2 2.07 10.4
Pregelatinized
Starch 1500 6.2 2.5 2.5 2.5 6.2 2.5 6.2 6.2
Crosscarmellose
sodium 3.1 3.1 3.1 5.2 5.2 5.2 5.2 3.1
Binder Povidone
k29/32 1.03 1.03 3.1 3.1 1.03 1.03 3.1 3.1
Purified
water - - - -
Extragranular Microcrystalline
cellulose PH 102 12.4 12.4 12.4 12.4 12.4 12.4 12.4 12.4
Pregelatinized
starch 1500 6.2 9.95 9.95 9.95 6.2 9.95 6.2 6.2
Crosscarmellose
sodium 3.1 3.1 3.1 5.2 5.2 5.2 5.2 3.1
Aerosil 200
Pharma 1.6 1.6 1.6 1.6 1.6 1.6 1.6 1.6
Stearic acid 3.9 1.3 3.9 1.3 1.3 3.9 3.9 1.3
Magnesium
stearate 2.3 0.77 2.3 0.77 0.77 2.3 2.3 0.77
Total Tablet
[image:4.612.59.557.450.670.2]weight 100 100 100 100 100 100 100 100
TABLE 3: FACTOR COMBINATIONS AS PER CHOSEN EXPERIMENTAL DESIGN, FFD
Formulation code Trial no. Coded factor levels
X1 X2 X3 X4
F1 1 -1 -1 +1 +1
F2 2 +1 -1 -1 -1
F3 3 +1 -1 +1 -1
F4 4 +1 +1 -1 -1
F5 5 -1 +1 -1 -1
F6 6 -1 +1 +1 +1
F7 7 +1 +1 +1 +1
F8 8 +1 -1 -1 +1
Translation of Coded Levels in actual units
Coded level -1 +1
X1: Povidone K29/32(mg) 10 30
X2: Crosscarmellose Sodium (Mg) 60 100
X3: Lubricant (mg) 20 60
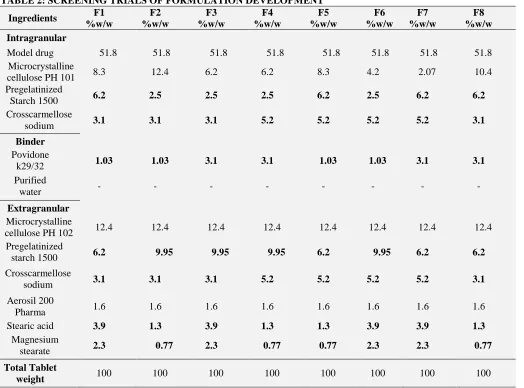
TABLE 4.1: OPTIMIZATION TRIALS OF FORMULATION DEVELOPMENT
Ingredients F1
%w/w
F2 %w/w
F3 %w/w
F4 %w/w
F5 %w/w
F6 %w/w
F7 %w/w
F8 %w/w Intragranular
Model drug 51.8 51.8 51.8 51.8 51.8 51.8 51.8 51.8
Microcrystalline
cellulose PH 101 13.2 10.5 6.94 4.3 10.05 7.4 11.9 5.6
Pregelatinized
Starch 1500 4.1 4.1 4.1 4.1 4.1 4.1 4.1 4.1
Crosscarmellose
sodium 1.6 1.6 4.7 4.7 3.1 3.1 1.6 4.7
Binder
Povidone k29/32 1.4 4.04 1.4 4.04 1.4 4.04 2.7 2.7
Purified water - - - -
Extragranular Microcrystalline
cellulose PH 102 12.4 12.4 12.4 12.4 12.4 12.4 12.4 12.4
Pregelatinized
starch 1500 8.3 8.3 8.3 8.3 8.3 8.3 8.3 8.3
Crosscarmellose
sodium 1.6 1.6 4.7 4.7 3.1 3.1 1.6 4.7
Aerosil 200
Pharma 1.6 1.6 1.6 1.6 1.6 1.6 1.6 1.6
Stearic acid 2.6 2.6 2.6 2.6 2.6 2.6 2.6 2.6
Magnesium
stearate 1.6 1.6 1.6 1.6 1.6 1.6 1.6 1.6
Total Tablet
weight 100 100 100 100 100 100 100 100
TABLE 4.2: OPTIMIZATION TRIALS OF FORMULATION DEVELOPMENT
Ingredients F9 %w/w F10 %w/w F11 %w/w F12 %w/w F13
%w/w Intragranular
Model drug 51.8 51.8 51.8 51.8 51.8
Microcrystalline cellulose PH
101 8.7 11.9 5.6 11.9 5.6
Pregelatinized Starch 1500 4.1 4.1 4.1 4.1 4.1
Crosscarmellose sodium 3.1 3.1 3.1 3.1 3.1
Binder
Povidone k29/32 2.7 2.7 2.7 2.7 2.7
Purified water - - - - -
Extragranular Microcrystalline cellulose PH
102 12.4 12.4 12.4 12.4 12.4
Pregelatinized starch 1500 8.3 8.3 8.3 8.3 8.3
Crosscarmellose sodium 3.1 3.1 3.1 3.1 3.1
Aerosil 200 Pharma 1.6 1.6 1.6 1.6 1.6
Stearic acid 2.6 2.6 2.6 2.6 2.6
Magnesium stearate 1.6 1.6 1.6 1.6 1.6
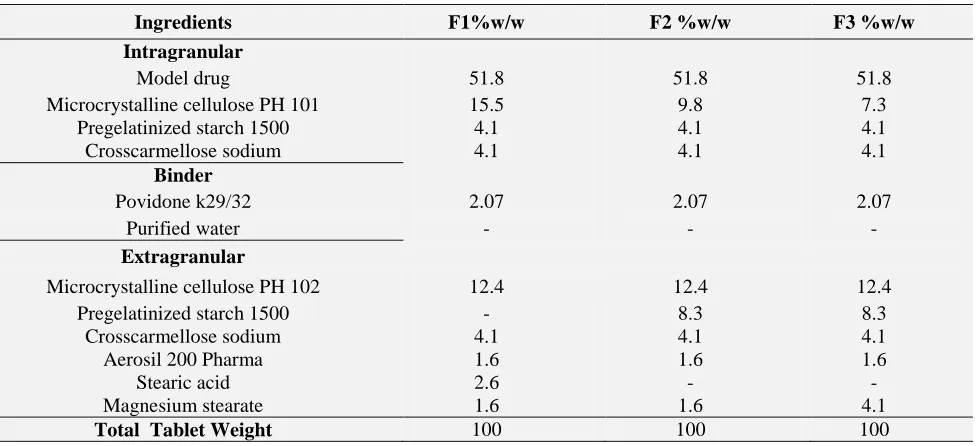
[image:5.612.46.573.403.676.2]TABLE 5: FACTOR COMBINATIONS AS PER CHOSEN EXPERIMENTAL DESIGN, CCD
Formulation code Trial no. Coded factor levels
X1 X2
F1 1 -1 -1
F2 2 +1 -1
F3 3 -1 +1
F4 4 +1 +1
F5 5 -1 0
F6 6 +1 0
F7 7 0 -1
F8 8 0 +1
F9 9 0 0
F10 10 0 0
F11 11 0 0
F12 12 0 0
F13 13 0 0
Translation of Coded Levels in actual units
Coded level -1 0 +1
X1: Povidone K29/32(mg) 13 26 39
X2: Crosscarmellose Sodium(mg) 30 60 90
In vitro Drug Release study: The in vitro drug release study was performed using USP type II paddle apparatus using 900 ml Acetate Buffer (pH=5) at 50 rpm at 37±0.5°C. The samples were withdrawn at predetermined time intervals for a period of 30 minutes and replaced with the fresh medium.
The samples were filtered through 0.22μm hydrophilic PVDF filters, suitably diluted and analyzed at 200 nm using HPLC (Column: Inertsil ODC-3V 100nmX4.6mm, Flow rate: 1.0 ml/min, Column oven temperature: 50±2ºC, Sample tray temperature: 25±2ºC, Injection volume: 10μL, Runtime: 8 minutes, Bandwidth: 16nm, Standard
solution- 56 mg of the model drug USP was accurately weighed and transferred to a 100ml volumetric flask and kept for sonication and made up to the marked volume using water, Mobile phase- 620 volumes of pH 2.5 buffer and 380 volumes of acetonitrile were added and mixed well
and kept for sonication).
10 μL of filtered portion of the standard solution and sample solution were separately injected into the HPLC system. The chromatogram was recorded and the responses were measured for the major peaks. The amount of drug released was calculated in percentage with respect to label claim by using the following expression;
% Drug released = (AT/AS) × (WS/Vs1) × (Vs2/Vs3) × (TV/L) × (P/100) × 100
Where, AS is average area of the Model drug peak in standard solution, AT is Area of the Model drug peak in sample solution, WS is Weight of Model drug taken for standard in g, Vs1 is volume of initial standard stock, Vs2 is pipette amount of standard stock, Vs3 is volume of final standard solution, L is label claim, TV is test volume, P is Potency of standard.
Optimization Data Analysis: For the studied design, the multiple linear regression analysis (MLRA) method was applied using the design Expert software to fit the full second order polynomial equation with added interaction terms.
Polynomial regression results were demonstrated for the studied responses.
DoE Validation and selection of Optimum formulation: Design space was created and one of the compositions from design space was used as optimum formulation and validated. Four other batches were selected as check-points to validate DoE optimization using friability and Q5 as the response variables. The observed and predicted responses were critically compared. Linear correlation plots were constructed for the five
chosen optimized formulations. Table 6 shows
TABLE 6: OPTIMIZED BATCH OBTAINED FROM DESIGN SPACE AND OTHER VALIDATION BATCHES
Ingredients OF1 VF1 VF2 VF3 VF4
%w/w %w/w %w/w %w/w %w/w
Intragranular
Model drug 51.8 51.8 51.8 51.8 51.8
Microcrystalline cellulose PH 101 8.08 13.2 13.2 6.94 4.3
Pregelatinized Starch 1500 4.15 4.1 4.1 4.1 4.1
Crosscarmellose sodium 4.08 1.6 1.6 4.7 4.7
Binder
Povidone k29/32 1.37 1.4 1.4 1.4 4.04
Purified water - - - - -
Extragranular
Microcrystalline cellulose PH 102 12.44 12.4 12.4 12.4 12.4
Pregelatinized starch 1500 8.3 8.3 8.3 8.3 8.3
Crosscarmellose sodium 4.08 1.6 1.6 4.7 4.7
Aerosil 200 Pharma 1.6 1.6 1.6 1.6 1.6
Stearic acid 2.6 2.6 2.6 2.6 2.6
Magnesium stearate 1.6 1.6 1.6 1.6 1.6
Total Tablet weight 100 100 100 100 100
RESULTS AND DISCUSSION 16: Organoleptic properties of the drug were evaluated. Model Drug was found to be crystalline, off white powder with unpleasant odor and taste. Bulk density and tapped density of the drug was found to be 0.282 g/ml and
0.341g/ml respectively. From the recorded
observations it was found that Carr’s index of drug was <20 and Hausner’s ratio <1.25 indicating Fair flow properties. From percentage cumulative size distribution it was found that around 65% of particles were above 250 microns and 35% were below 250 microns. No physical changes like color change, caking, odor etc. were observed after 4
weeks at 40oC & 75% RH indicating that there was
no incompatibility between the Model drug and the excipients.
All the formulations of prescreening trials showed poor flow characteristics. Sticking on punches was seen when stearic acid was not included in the
formulation (Prescreening trial 2) and disintegration
time increased upon excluding pregelatinized starch 1500 (Prescreening trial 1) in the formulation. Disintegration time was also increased when a high amount of magnesium stearate was used in the formulation (Prescreening trial 3). Thus, it was found that pregelatinized starch 1500 and a suitable ratio of both the lubricants (stearic acid and magnesium stearate) were necessary in
extra granular portion of the formulation. Hence,
further trials were conducted including these
critical material attributes. Table 7 shows
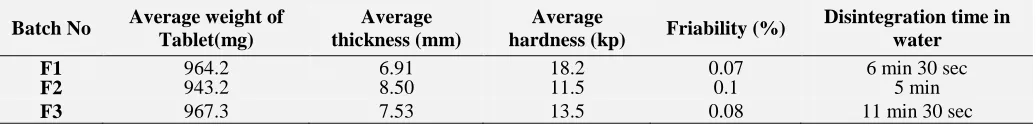
[image:7.612.48.566.529.592.2]post-compression parameters of prescreening trial formulations.
TABLE 7: POST COMPRESSION PARAMETERS OF PRESCREENING TRIAL FORMULATIONS
Batch No Average weight of Tablet(mg)
Average thickness (mm)
Average
hardness (kp) Friability (%)
Disintegration time in water
F1 964.2 6.91 18.2 0.07 6 min 30 sec
F2 943.2 8.50 11.5 0.1 5 min
F3 967.3 7.53 13.5 0.08 11 min 30 sec
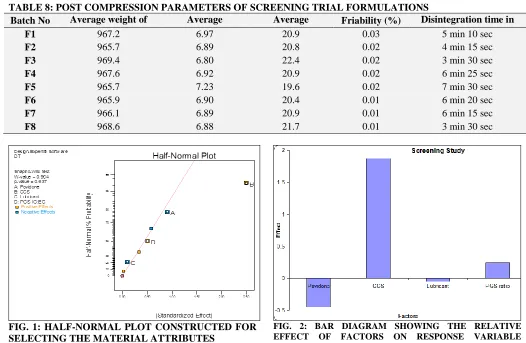
All the formulations of screening and optimization trials showed a passable flow. All physical parameters of the compressed tablets (weight variation, thickness, friability and hardness) were within the permissible limits of USP. From the results (Bar diagram) of screening studies, it was
determined that Povidone K29/32and
Crosscarmellose Sodium were having a strong
impact on the Critical Quality Attribute (response
variable, Disintegration time) 17. Table 8 shows
post compression parameters of screening trial
formulations. Figure 1 shows Half-Normal Plot
constructed for selecting the material attributes.
Figure 2 shows Bar Diagram showing the relative
effect of factors on response variable
TABLE 8: POST COMPRESSION PARAMETERS OF SCREENING TRIAL FORMULATIONS Batch No Average weight of
Tablet(mg)
Average thickness (mm)
Average hardness (kp)
Friability (%) Disintegration time in water
F1 967.2 6.97 20.9 0.03 5 min 10 sec
F2 965.7 6.89 20.8 0.02 4 min 15 sec
F3 969.4 6.80 22.4 0.02 3 min 30 sec
F4 967.6 6.92 20.9 0.02 6 min 25 sec
F5 965.7 7.23 19.6 0.02 7 min 30 sec
F6 965.9 6.90 20.4 0.01 6 min 20 sec
F7 966.1 6.89 20.9 0.01 6 min 15 sec
F8 968.6 6.88 21.7 0.01 3 min 30 sec
FIG. 1: HALF-NORMAL PLOT CONSTRUCTED FOR SELECTING THE MATERIAL ATTRIBUTES
FIG. 2: BAR DIAGRAM SHOWING THE RELATIVE EFFECT OF FACTORS ON RESPONSE VARIABLE
(DISINTEGRATION TIME)
Thus, further trials were conducted to optimize the formulation using these two factors (Povidone K29/32, Crosscarmellose Sodium) and fixing the other two (Lubricant, Pregelatinized Starch 1500 IG: EG) in a suitable experimental design.
A central composite design (CCD) for two factors
at three levels with ά=1, equivalent to 32
factorial design (FD) was chosen as the experimental design to optimize the varied response variables. This is an effective second-order experimental design associated with a minimum of experiments to
estimate the influence of individual variables (main effects) and their second-order effects. Further, this design has an added advantage of determining the quadratic response surface, not estimable using an FD at two levels. Dissolution (Q5 i.e. % drug release at 5 minutes) and friability were taken as
response variables (CQAs). Table 9 shows post
compression parameters of optimization trial
formulations. Figure 3 18shows Dissolution profile
[image:8.612.41.567.41.384.2]of various optimization trial formulations (f1 to f13) of the model antibacterial drug prepared as per the experimental design.
TABLE 9: POST COMPRESSION PARAMETERS OF OPTIMIZATION TRIAL FORMULATIONS
Batch No. Average weight of Tablet (mg)
Average thickness (mm)
Average hardness
(kp) Friability (%)
% drug release in 5 mins
F1 966.5 6.89 21.9 0.1 93
F2 967.6 6.89 21.9 0.08 88
F3 964.9 7.00 20.6 0.03 92
F4 968.5 7.06 20.2 0.05 63
F5 963.9 6.92 21.7 0.01 98
F6 964.5 6.91 21.9 0.06 76
F7 966.3 6.91 21.8 0.1 93
F8 967.3 6.91 21.6 0.05 60
F9 964.8 6.91 22.0 0.1 95
F10 965.6 6.91 21.7 0.12 95
F11 964.8 6.91 21.7 0.09 95
F12 965.0 6.90 21.8 0.06 95
[image:8.612.53.560.571.754.2]FIG. 3: DISSOLUTION PROFILE OF VARIOUS OPTIMIZATION TRIAL FORMULATIONS (f1 to f13) OF THE MODEL ANTIBACTERIAL DRUG PREPARED AS PER THE EXPERIMENTAL DESIGN
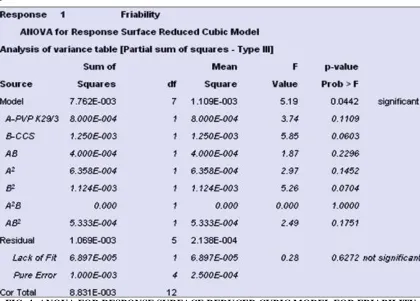
ANOVA for Response Surface Reduced Cubic Model for Friability was found to be significant indicating the fitness of the model chosen.
[image:9.612.81.538.56.291.2]Figure 4 shows Anova for Response Surface Reduced Cubic Model for Friability.
FIG. 4: ANOVA FOR RESPONSE SURFACE REDUCED CUBIC MODEL FOR FRIABILITY
The 3D graph for friability indicates that at low levels of Crosscarmellose Sodium, with a gradual
[image:9.612.95.515.367.668.2]FIG. 5: 3D GRAPH SHOWING THE INFLUENCE OF CROSCARMELLOSE SODIUM AND POVIDONE K29/32ON FRIABILITY OF THE OPTIMIZATION TRIAL FORMULATIONS
At high levels of Crosscarmellose Sodium, with a gradual increase in Povidone K29/32, friability shows a gradual, not very significant increase. At low levels of Povidone K29/32, with a gradual increase in Crosscarmellose Sodium, friability first increases and then decreases. At high levels of Povidone K29/32, with a gradual increase in Crosscarmellose Sodium, Friability decreases
gradually followed by a slight increase later. Contour plot for friability indicates an interaction between the critical factors and response variables.
Figure 6 shows Contour Plot showing the influence of crosscarmellose sodium and povidone k29/32on friability of the optimization trial formulations.
[image:10.612.90.527.456.725.2]ANOVA for Response Surface Reduced Cubic Model for % drug release profile at 5 mins(Q5) was found to be significant indicating the fitness of
the model chosen. Figure 7 shows ANOVA For
Response Surface Cubic Model For % Drug
Release At 5 Mins (Q5).
FIG. 7: ANOVA FOR RESPONSE SURFACE CUBIC MODEL FOR % DRUG RELEASE AT 5 MINS (Q5)
The 3D graph for Q5 indicates that at low levels of Crosscarmellose Sodium and with a gradual increase in Povidone K29/32, Q5 slightly increases and remains constant.
[image:11.612.95.513.70.359.2] [image:11.612.91.524.451.725.2]At high levels of Crosscarmellose Sodium and with a gradual increase in Povidone K29/32, Q5 shows a decrease first and then slowly increases. At low levels of Povidone K29/32, with a gradual increase in Crosscarmellose Sodium, Q5 first increases gradually upto a point and then slowly decreases. At high levels of Povidone K29/32, with a gradual increase in Crosscarmellose Sodium, Q5 decreases
gradually. Contour plot for % drug release profile
at 5 mins(Q5) indicates an interaction between the
critical factors and response variables. Figure 9
shows contour plot showing the influence of crosscarmellose sodium and povidone k29/32on % drug release at 5 mins (q5) of the optimization trial formulations.
FIG. 9: CONTOUR PLOT SHOWING THE INFLUENCE OF CROSCARMELLOSE SODIUM AND POVIDONE K29/32ON % DRUG RELEASE AT 5 MINS (Q5) OF THE OPTIMIZATION TRIAL FORMULATIONS
Thus, a composition having a low level of povidone K29/32 and a slightly high level of crosscarmellose sodium was found to be optimum. All the formulations of validation batches and the optimum formulation selected from design space
showed a passable flow. Figure 10 shows overlay
plot showing the formulation selected as optimum
from the design space. Figure 11 shows Overlay
Plot showing the formulations selected for Doe Validation.
[image:12.612.119.495.513.742.2]FIG. 11: OVERLAY PLOT SHOWING THE FORMULATIONS SELECTED FOR DOE VALIDATION
All physical parameters (weight variation,
thickness, friability and hardness) of the
compressed tablets were within the permissible
limits of USP. Retention time and peak area of the
optimized batch solution was found to be
6.585mins and 780393 µV*sec respectively.
In-vitro % drug release in 5 min was found to be 97%.
R2 values were found to be 0.9997 and 0.9919 for
linear correlation plot drawn between predicted vs.
observed friability and Q5 respectively. Table 10
shows Post Compression Parameters of Validation
Batches. Table 11 shows Data for Linear
Correlation Plot for the chosen Optimized and
Validation Formulations. Figure 12 shows Linear
Correlation Plot for Friability Predicted and
Observed. Figure 13 shows Linear Correlation
Plot for In-vitro % Drug Release at 5 Minutes
[image:13.612.97.516.45.362.2]Predicted and Observed.
TABLE 10: POST COMPRESSION PARAMETERS OF VALIDATION BATCHES
Batch no. Average weight of Tablet (mg)
Average thickness (mm)
Average hardness
(kp) Friability (%)
%Drug release at 5 mins(Q5)
OF1 966.9 7.12 21.1 0.069 97
VF1 966.5 6.89 21.9 0.1 93
VF2 967.6 6.89 21.9 0.08 88
VF3 964.9 7.00 20.6 0.03 92
VF4 968.5 7.06 20.2 0.05 63
TABLE 11: DATA FOR LINEAR CORRELATION PLOT FOR THE CHOSEN OPTIMIZED AND VALIDATION FORMULATIONS
Batch no. Friability (%) Q5 (% drug release at 5 mins)
Predicted Observed Predicted Observed
OF1 0.066 0.069 97.39 97
VF1 0.098 0.1 89.89 93
[image:13.612.43.567.642.739.2]FIG. 12: LINEAR CORRELATION PLOT FOR FRIABILITY PREDICTED AND OBSERVED
FIG. 13: LINEAR CORRELATION PLOT FOR IN VITRO % DRUG RELEASE AT 5 MINUTES PREDICTED AND OBSERVED
Linear correlation plots drawn between the predicted and observed responses demonstrated high values of R (0.9919 to 0.9997) indicating excellent goodness of fit (p< 0.001).The optimum formulation was selected by trading off various response variables and adopting the following maximizing criteria Q5(%) >85 and friability (%) <0.08. Upon comprehensive evaluation of design space, the formulation (Povidone K29/32= 13.19 mg (1.37%) and Crosscarmellose Sodium= 78.79 mg (8.08%)) fulfilled the optimal criteria of best regulation of the release rate and friability of 97.39% and 0.066 % respectively.
From this study, it was concluded that optimizing
levels of binder (Povidone K29/32) and
superdisintegrant (Crosscarmellose sodium) is
imperative to acquire maximum in vitro % drug
release and adequate friability.
Miniscule bias between the observed and predictive responses confirms the high prognostic ability of the study design. The study offers a platform technology, the results of which can be successfully extrapolated to other molecules too.
REFERENCES:
1. Naseem et al: Quality by design approach for formulation development: A case study of dispersible tablets. International Journal of Pharmaceutics 2012; 423: 167-178.
2. Sandipan Roy: Quality by Design: A Holistic concept of building quality in pharmaceuticals. International Journal of Pharmaceutical and Biomedical Research 2012; 3:100-108.
3. Srinivas et al: Preparation and evaluation (in vitro) nizatidine immediate release tablets. International Journal of Pharmtech Research 2011; 3:1688-1692. 4. FDA GUIDANCE: Q8 (R1) Pharmaceutical
Development 1998; Revision 1 http://www.fda.gov /OHRMS/DOCKETS/98fr/07d-0493-gdl0001.pdf 5. Bhupinder Singh et al: Optimizing Drug Delivery
Systems Using Systematic “Design of Experiments” Part 1: Fundamental aspects. Therapeutic Drug Carrier Systems 2005; 22: 27-105.
6. Agrawal et al: Wet granulation fine particle ethylcellulose tablets: effect of production variables and mathematical modelling of drug release. AAPS pharmScitech journal 2003; 5:48-60.
7. Biljana et al: Formulation and evaluation of immediate release tablets with different types of paracetamol powders prepared by direct compression. African Journal of Pharmacy and Pharmacology 2011; 5:31 – 41.
8. C.Mallikarjuna et al: Acelofenac by simple wet granulation method. African Journal of Pharmacy and Pharmacology 2011; 5:76-82.
9. Erah et al: The stability of amoxicillin, clarithromycin, metronidazole in gastric juice: relevance to the treatment of helicobacter Pylori infection. Journal of Antimicrobial Chemotherapy 1997; 39: 5-12.
10. Gupta et al: Correlation between disintegration and dissolution for immediate release tablets. AAPS Pharm SciTech 2009; 10(2): 495–499.
11. Jacob Kristensen et al: Wet Granulation in Rotary Processor and Fluid Bed: Comparison of Granule and Tablet Properties. American Association of Pharmaceutical Scientists 2006; 7:46-53.
12. Jigar et al: Development of Immediate release tablet of antibiotic drug used to treat STDs by dry granulation using superdisintegrant Crosscarmellose Sodium. American Journal of Pharmtech Research 2011; 1:211-218.
[image:14.612.52.301.37.480.2] [image:14.612.49.301.45.232.2]14. Natarajan et al: Development of Immediate release tablet of paroxetine HCl by wet granulation. International Journal of Research in Pharmaceutical and Biomedical Sciences 2009; 2:1095-1099. 15. Pathak et al: Formulation and optimization of
immediate release tablet of an antialcoholic drug by dry granulation method. International Journal of Comprehensive Pharmacy 2011; 3:1-4.
16. Sahoo et al: Development of disulfiram immediate release tablets by roller compaction using high
functionality excipients. International Journal of Pharmaceutical Sciences 2011; 3:1096-1102. 17. Sakr et al: Upgrading wet granulation monitoring
from hand squeeze test to mixing torque rheometry. Saudi Pharmaceutical Journal 2012; 20:9–19. 18. Venkatesh et al: Formulation and evaluation of
valacyclovir tablets using different formulation parameters and their effects on the dissolution rate of tablets. International Journal of Pharmaceutical Development and Technology 2012; 2:6-10.
All © 2013 are reserved by International Journal of Pharmaceutical Sciences and Research. This Journal licensed under a Creative Commons Attribution-NonCommercial-ShareAlike 3.0 Unported License.
This article can be downloaded to ANDROID OS based mobile. Scan QR Code using Code/Bar Scanner from your mobile. (Scanners are available on Google Playstore)
How to cite this article: