Dumontheil, Iroise and Klingberg, T. (2012) Brain activity during a
visuospatial working memory task predicts arithmetical performance 2 years
later. Cerebral Cortex 22 (5), pp. 1078-1085. ISSN 1047-3211.
Downloaded from:
Usage Guidelines:
Please refer to usage guidelines at or alternatively
1
Brain activity during a visuospatial working memory task predicts arithmetical performance two
years later
Iroise Dumontheil1, Torkel Klingberg1
1. Neuroscience Department, Karolinska Institutet, Retzius väg 8, SE-17177 Stockholm, Sweden
Correspondence should be addressed to:
Dr. Iroise Dumontheil
Neuroscience Department
Retzius väg 8
Karolinska Institutet
SE-171 77 Stockholm, Sweden
Email: [email protected]
Phone: +44 796 9955 478
Fax: +46 8 517 773 49
2
Abstract
Visuospatial working memory (WM) capacity is highly correlated with mathematical reasoning
abilities and can predict future development of arithmetical performance. Activity in the intraparietal
sulcus (IPS) during visuospatial WM tasks correlates with interindividual differences in WM capacity.
This region has also been implicated in numerical representation and its structure and activity reflect
arithmetical performance impairments (e.g. dyscalculia). We collected behavioural (N=246) and
neuroimaging data (N=46) in a longitudinal sample to test whether IPS activity during a visuospatial
WM task could provide more information than psychological testing alone and predict arithmetical
performance two years later in healthy participants aged 6 to 16 years. Non-verbal reasoning and
verbal and visuospatial WM measures were found to be independent predictors of arithmetical
outcome. In addition, WM activation in the left IPS predicted arithmetical outcome independently of
behavioural measures. A logistic model including both behavioural and imaging data showed
improved sensitivity by correctly classifying more than twice as many children as poor arithmetical
performers after two years than a model with behavioural measures only. These results demonstrate
that neuroimaging data can provide useful information in addition to behavioural assessments and
be used to improve the identification of individuals at risk of future low academic performance.
3
Of the various mathematical domains taught at school, number, counting and arithmetic are those in
which cognitive theory and experimental methods are the most developed (Butterworth 2005).
Arithmetic is an academic skill which relies on a range of cognitive processes (Dehaene et al. 2004).
Poor arithmetical abilities are a serious handicap for individuals and for society in general, increasing
the risk of unemployment and depression, and significantly reducing lifetime earnings (Gross 2009).
Children who have difficulties in arithmetic early on tend to remain low achievers (Andersson 2010).
For this reason, finding early cognitive markers of individual differences in arithmetical abilities and
their future development is a critical step for the implementation of successful intervention (Ramani
and Siegler 2008; Räsänen et al. 2009; Holmes et al. 2009).
Behavioural studies have suggested that working memory (WM) could be one of the cognitive
markers associated with arithmetical achievement (see Raghubar et al. 2010 for review). WM refers
to a set of mental processes that enable us to hold and manipulate relevant information for brief
periods of time. WM capacity is correlated with arithmetical performance both in children with and
without known learning difficulties (Henry and MacLean 2003; Maybery and Do 2003; Kyttälä et al.
2003; Alloway et al. 2005; Alloway et al. 2009; Geary et al. 2009; Meyer et al. 2010). WM measures
can also predict future development of arithmetical ability (Jarvis and Gathercole 2003; Gersten et al.
2005; Bull et al. 2008; Alloway and Alloway 2010, but see Gathercole et al. 2003; Geary et al. 2009)
above and beyond measures of general intelligence or reasoning abilities (Alloway and Alloway
2010).
A number of theoretical models of WM have been proposed and these may differ in their potential
use for the study of differences in arithmetical development (Berch 2008). Experimental studies
typically make a distinction based of the type of information held in WM, whether it is verbal or
visuospatial. The evidence is mixed regarding whether visuospatial or verbal WM has the most
4
Rasmussen and Bisanz 2005; Bull et al. 2008; Meyer et al. 2010), and whether WM and non-verbal
reasoning have independent predictive values (Passolunghi et al. 2007; Alloway and Alloway 2010;
Primi et al. 2010).
Arithmetical impairments, for example in the case of developmental dyscalculia, may arise from
deficits in elementary numerical processing such as impaired representation and processing of basic
numerical magnitude, impaired numerosity coding or impaired “number sense” (see Butterworth
2005; 2010 for review). Meta-analyses have identified the intraparietal sulcus (IPS) as the locus of
numerical representation (Dehaene et al. 2003; Cohen Kadosh et al. 2008). Both structure (Isaacs et
al. 2001; Rotzer et al. 2008; Rykhlevskaia et al. 2009) and brain activity (Kaufmann et al. 2009; Kucian
et al. 2006; Mussolin et al. 2010; Price et al. 2007; Rotzer et al. 2009) in this region reflect group
differences in mathematical difficulties and current research points to IPS abnormalities as the single
biological marker of developmental dyscalculia (Rubinsten and Henik 2009; Butterworth 2010). Brain
imaging data indicate that numerical and WM functions converge in the IPS (Zago and
Tzourio-Mazoyer 2002; Zago et al. 2008), which shows WM activation across several stimulus presentation
modalities (Linden 2007). Moreover, individual differences in activity in the IPS are correlated with
WM capacity differences among adults (Todd and Marois 2005), as well as when comparing children
and adults (Klingberg et al. 2002a; Crone et al. 2006).
In the present study we first attempted to replicate previous findings regarding the predictive power
of WM and reasoning measures for future arithmetical performance (Raghubar et al. 2010) using
longitudinal data collected in a large sample of participants ranging in age from 6 to 16 years (N =
246). This focus on a wide age range is novel compared to previous studies, which tested single age
groups (Gathercole et al. 2003; Bull et al. 2008; Alloway and Alloway 2010), or used age-corrected
measures (Bull et al. 2008). Moreover, the inclusion of different age groups allowed us to investigate
5
Because of the mixed evidence regarding whether visuospatial or verbal WM is most relevant to
arithmetical abilities, and of the value of recording multiple and varied measures, we assessed three
behavioural measures of WM, which differed in terms of stimulus-type: a verbal WM task with word
stimuli, a verbal WM task with number stimuli, and a visuospatial WM task.
We first tested whether the different types of WM measures and non-verbal matrix reasoning
contributed to prediction of arithmetical performance two years later. Arithmetical performance was
assessed with grade-dependent tests of elementary arithmetic. Our second and main goal was to
assess whether brain activity, measured as change in the blood-oxygenation level dependent (BOLD)
contrast, could improve prediction of arithmetical outcome. The hypothesis behind this analysis was
that physiological measures would provide a more direct evaluation of the key neural substrates
necessary for arithmetical performance. Whole-brain and local IPS activation during a visuospatial
WM task was measured in a subset of 46 participants. Bilateral IPS regions of interests (ROI) were
defined using the results of a meta-analysis of numerical representation (Cohen Kadosh et al. 2008)
6
Materials and Methods
Participants
Participants were healthy volunteers recruited using random sampling from the population registry
in Nynäshamn in Sweden, and part of a longitudinal study of typical development (‘Brainchild’ study,
Söderqvist et al. 2010). Included here were participants aged between 6 and 16 years at the first time
of testing (T1) who participated in the second round of testing (T2) two years later. The upper limit of
the age range was chosen to only include participants in the educational system at T1 and T2.
Exclusion criteria were a diagnosed neuropsychological disorder other than attention deficit and
hyperactivity disorder (ADHD) and dyslexia, a mother tongue other than Swedish and severe hearing
or vision impairment. We expected normal rates of these disorders in the population. ADHD
symptoms corresponding to the DSM-IV criteria (American Psychiatric Association [DSM-IV-TR],
2000) were rated by parents for 223 out of the 246 participants at T1. One child was rated as having
more than 6 symptoms of hyperactivity, none was rated as having more than 6 symptoms of
inattention. Informed consent was obtained from the participants and from the parents of children
under 18. The study was approved by the local ethics committee of the Karolinska University
Hospital, Stockholm.
Behavioural assessment
A total of 246 participants (125 males) participated in the behavioural assessment. The sample
included participants aged 6 (N=42), 8 (N=37), 10 (N=46), 12 (N=45), 14 (N=40) and 16 years old
(N=36) at T1 (mean age: T1 10.83 years (SD 3.33); T2 12.86 (3.36)). Participants completed a large
neuropsychological battery administered individually in a quiet room. In a separate session
arithmetical achievement was measured by a written test performed individually in isolation or in a
group.
7
Visuospatial WM was assessed using the Dot Matrix task from the Automated Working Memory
Assessment (AWMA) battery (Alloway 2007). This task involves remembering the location and order
of dots displayed sequentially in a grid on a computer screen. Verbal WM was assessed with a
Backwards Digit recall task. Numbers were read aloud to the participants, who verbally repeated
them in the reverse order. In both these tests, difficulty was increased after four trials were correctly
answered by adding one item to be remembered. The tests terminated when three errors were
committed on one level. The scores used were the total number of correct trials. The third WM task
was a 3-back task. Participants were read a total of twenty Swedish words and were asked to
indicate, by responding yes or no on each trial, whether the word was the same as the word read
three trials before. A score was calculated by subtracting the number of false alarms (wrong yes
responses) from the number of correct responses. Although this task has not been validated and the
data suggest poorer reliability than the other WM measures, it was included to obtain a measure of
non-numerical verbal WM.
Reasoning ability
Raven’s Progressive Matrices were used as a measure of reasoning ability (Raven 1998). Participants
in the youngest age group (6 year-olds) performed sub-tests A-D, whilst all other participants
performed all subtests (A-E), each comprising 12 items. The test did not have a time limit, although if
the participant did not give an answer within one minute the administrator asked for an answer.
Arithmetical abilities
The arithmetical assessment was based on the Trends in Mathematics and Science Study (TIMSS;
Martin et al. 2004) and Basic Number Screening Test (BNST; Gillham and Hesse 2001) and was
designed in four school-grade dependent versions (grades 2, 4, 6 and grade 8, suitable for 14-27 year
olds). Grades 2 and 4 problems included magnitude judgements, questions about the number
8
fractions). Grades 6 and 8 problems included elementary arithmetic and elementary algebra (simple
equations with variables). Items were piloted in second and sixth graders (N = 400) at three schools
in a suburb of Stockholm. Testing time was 30 minutes.
Preprocessing analyses
The raw results of the arithmetical and reasoning tests were initially transformed into ability scores.
This transformation was carried out by item response theory (IRT) analyses using a partial credit
model. The ability score of the IRT analyses is a measure of the probability of a participant passing
the test, a function of the difficulty level of the item and the ability of the participant (see Berman
Nutley et al. 2010, for details). These measures were then transformed into Z-scores. This
preprocessing permitted combined analyses of different age groups, even though the groups did not
perform the exact same tasks since the tests were age dependent.
Brain imaging
Data collection
A subset of 46 participants (23 males) were randomly selected to participate in the imaging part of
the study (Söderqvist et al. 2010). This sample included participants aged 6 (N=6), 8 (N=9), 10 (N=9),
12 (N=6), 14 (N=9) and 16 years old (N=7) at T1 (overall mean age: T1 10.96 (3.35); T2 13.02 (3.35)).
MRI data was collected on a 1.5 T Siemens scanner. T2*-weighted functional images were acquired
with a gradient echo EPI (Echo Planar Imaging) pulse sequence with TR = 3000 ms, TE = 50 ms, flip
angle = 90º, 30 oblique slices, 4.5 mm slice thickness, 0.5 mm interslice distance, 220 x 220 mm FOV,
64 x 64 grid, resulting in a voxel size of 3.44 x 3.44 x 4.5 mm. Structural T1-weighted spin echo images
were acquired with a 3D MPRAGE sequence (FOV = 256 x 256 mm, 256 x 256 grid, 1 mm3 voxel size).
9
Participants performed a visuo-spatial WM grid task in two 5 min sessions including 16 WM and 16
Control trials. Trial order was pseudo-randomized. Stimuli were presented with E-Prime software
using an MR compatible visual system (NordicNeuroLab). Dots were presented sequentially in a
four-by-four grid for 500 ms, with 500 ms interval between dots. Two loads (2 dots or 4 dots) were
implemented in the paradigm. 1500 ms after the last dot and the grid disappeared a cue was
presented in the grid for 3000 ms. The cue was a number referring to a serial position in the previous
stimulus sequence. Participants indicated with a yes/no response (right index and middle finger
responses respectively) whether the number and its position in the grid matched, e.g. “2?” would
prompt the participant to indicate whether the second circle had appeared in the grid position filled
by the number. In the Control condition, the cue (number 8) always required a “no” response. A new
sequence began 2000 ms after the response cue disappeared.
Data analysis
Preprocessing and statistical analyses (see Söderqvist et al. 2010) were carried out with SPM5
(http://www.fil.ion.ucl.ac.uk/spm/software/spm5). Separate boxcar regressors modeled correct
trials of the WM and Control load 2 and 4 conditions, with durations of 8 s (load 2) or 10 s (load 4).
These regressors were convolved with a canonical hemodynamic response function, its temporal and
dispersion derivatives, and, together with regressors representing residual movement-related
artifacts and the mean over scans, comprised the full model for each session. Parameter estimates
calculated from the least mean squares fit of the model to the data were used in a pair-wise contrast
at the individual subject level to compare WM and Control conditions, irrespective of load. Contrast
images for each participant were then entered in a one-sample test group analysis. Three regions of
interest (ROIs) were defined and mean WM – Control parameter estimates were calculated for each
ROI using MarsBar (Brett et al 2002). The first ROI corresponded to the whole-brain contrast WM –
Control corrected for false discovery rate (P < 0.05). The other two ROIs were 8 mm-radius spheres
10
(Figure 2). ROIs were plotted on a surface based human atlas (PALS)(Van Essen 2005) using the Caret
11
Results
Prediction of arithmetical performance: Behavioural measures
A total of 246 participants were included in the behavioural analyses. T1 behavioural measures were
scores on the Dot Matrix, Backwards Digit and 3-back WM tasks, and on the Raven’s matrices
reasoning task. Arithmetical performance was the dependent variable assessed at T2. Reasoning and
arithmetical scores were preprocessed using IRT to take into account age group differences in items
tested, obtaining individual ability scores subsequently transformed into Z scores (see Berman Nutley
et al. 2010, for details).
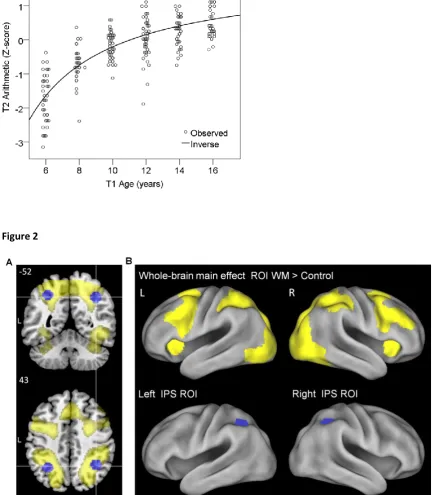
In a first step, a curve fitting analysis was performed to assess how best to model changes in
arithmetical performance at T2 as a function of age at T1 (Figure 1). Linear, logarithmic and inverse
fits were tested and the results indicated that an inverse function of age at T1 was the best fit for
ArithmeticZ at T2 (R2 = .580, .622 and .642 respectively). Age-1 at T1 was thus the variable entered in
all subsequent regression analyses.
Insert Figure 1 here
Multiple regression analyses were performed comparing a model with T1 Age-1 only and a model
including reasoning and all three WM measures at T1. T2 ArithmeticZ was the dependent variable.
Including the behavioural measures significantly improved the fit of the model. All four behavioural
measures were found to be significant independent predictors of arithmetical outcome (Table 1).
High reasoning and high WM scores at T1 predicted high arithmetical scores at T2.
12
A second set of multiple regression analyses was performed to test for possible changes with age in
the relationship between the behavioural measures and arithmetical outcome. T1 Age-1 was
transformed into Z-scores to reduce collinearity between main effects and interactions (Aiken and
West, 1991). T1 Age-1Z, reasoning and all three WM measures at T1 were first entered in the model
predicting arithmetical score at T2. In a second stage, interaction terms between T1 Age-1Z and the
four behavioural measures at T1 were entered in the model. The R2 change following inclusion of the
interaction predictors was not significant (ΔR2 = .006, P= 0.213). Individually, the only significant
interaction predictor was the interaction between Backwards Digit score and T1 Age-1Z (β=.21, P=
0.044, all other Ps > 0.24). Thus the predictive relationship between reasoning and WM measures
and arithmetical outcome was mostly stable across the age range (6-16 years old) of our participants.
Prediction of arithmetical performance: Neuroimaging
A subset of 46 participants were scanned at T1 while performing a visuospatial WM task. The
contrast of interest compared WM conditions (loads 2 or 4) to Control conditions matched for
stimulus presentation and response production. WM – Control mean activation was calculated in the
whole-brain WM – Control activation ROI, and in two 8 mm-radius sphere ROIs centered in the left
(-31 -54 46) and right (37 -50 43) IPS (coordinates from Cohen Kadosh et al. 2008) (Figure 2).
Insert Figure 2 here
A first set of regression analyses were performed to test whether WM – Control activations were
significant predictors of arithmetical outcome irrespective of participants’ age. Individually, both
whole-brain ROI BOLD and left IPS BOLD at T1 significantly positively predicted arithmetic
performance at T2 (respectively F(1,44) = 7.07, P = 0.011, β = .372, R2 = .138; F(1,44) = 5.40, P =
0.025, β = .331, R2 = .109). There was a trend for a similar effect for the right IPS BOLD at T1 (F(1,44)
13
We then performed a set of multiple regressions where T1 Age-1 was entered first in the model, the
whole-brain ROI activation second, and then either the right or left IPS ROI activations. This approach
enabled us to assess specific IPS effects once overall brain activation and age were taken into
account. The left IPS independently explained a significant amount (5.1%) of additional variance in T2
ArithmeticZ (Table 2). Greater left IPS residual activation once the effect of age was taken into
account was associated with poorer arithmetical performance 2 years later. In this case, the right IPS
was not a significant predictor of arithmetical outcome (ΔR2 = .003, P > 0.5).
Similarly to the behavioural analyses, additional multiple regression analyses of the fMRI data were
performed to test for possible changes with age in the relationship between the left IPS and
whole-brain BOLD measures and arithmetical outcome. T1 Age-1Z, and whole-brain and left IPS WM-Control
BOLD at T1 were first entered in the model. In a second stage, interaction terms between T1 Age-1Z
and the two BOLD measures at T1 were entered in the model. The R2 change following inclusion of
the interaction predictors was not significant (ΔR2 = .007, P= 0.592, individual interaction predictors
Ps >0.3). Thus the predictive relationship between whole-brain and left IPS BOLD measures and
arithmetical outcome appeared stable across the age range (6-16 years old) of our participants.
Insert Table 2 here
A second set of multiple regression analyses assessed the significance of the WM and reasoning
behavioural measures in the smaller neuroimaging sample of participants and tested whether the
left IPS effect remained significant when behavioural measures were first included in the model.
Results showed that in this smaller sample behavioural measures explained 10.1% more variance
than age only. Only the reasoning and visuospatial WM measures significantly contributed to the
14
activation was included led to a further significant improvement of the full regression model of 2.5 %
(Table 3).
Insert Table 3 here
Identification of the 20% lower performers
As an illustration of the added benefit of using neuroimaging data as a predictor of arithmetical
outcome, we classified the fMRI sample into the 20% lower T2 ArithmeticZ performers and 80%
better performers per age group (6, 8, 10, 12, 14 or 16 years old at T1). The 20% threshold was
chosen as an intermediary value between the 25% poor functional numeracy observed in adults
(Parsons and Bynner 2005) and the 15% cutoff used for mathematics learning disability (MLD) in
elementary school children (Geary et al. 2009). Binary logistic regression analyses were performed on
these data to assess how well our models could classify the participants in these two categories.
Sensitivity represents the proportion of lower 20% performers correctly identified as low performers,
specificity the proportion of higher 80% performers correctly identified as high performers.
A model including age and all behavioural measures did not classify the participants better (trend
only: 24 = 8.6, P = 0.073, sensitivity 22.2%, specificity 97.3%, accuracy 82.6%) than a model with age
alone (sensitivity 0%, specificity 100%, accuracy 80.4%). However, including whole-brain and left IPS
WM – Control activity made a significant improvement to the model ( 22 = 6.5, P = 0.039), with the
final full model (including behavioural and BOLD measures) classifying the participants in this smaller
group significantly better than the model with age alone ( 26 = 15.1, P = 0.020, sensitivity 55.6%,
specificity 94.6%, accuracy 87.0%). Adding fMRI measures to the model led to the correct
15
Discussion
This longitudinal study combined behavioural and brain imaging measures to test whether functional
imaging data could improve prediction of arithmetical outcome in 6 to 16 years-old participants. Our
results show that greater activation in the left, but not right, IPS during a visuospatial WM task
relative to the rest of the brain is associated with poorer arithmetical performance two years later.
Left IPS activity is still a significant, although small, predictor when WM and reasoning abilities are
first entered as predictors of arithmetical outcome. Although the participant samples were small, the
use of brain imaging data improved more than two-fold the accurate classification of participants as
poor arithmetical performers two years later. These results provide initial evidence that brain
imaging is a sensitive tool for the identification of children at risk of poor academic outcome.
Developmental changes in arithmetical performance could be fitted by an inverse function of age,
with the steepest improvements in performance observed between participants aged 6 and 8 at T1.
A large part of the variance in arithmetical performance in our sample (64.2%) was predicted by age
-1. In this aspect the present study differs from previous longitudinal research in that a wide age range
was included in the analyses instead of focusing on a single age group (Gathercole et al. 2003; Bull et
al. 2008; Alloway and Alloway 2010) or using age-corrected measures (Bull et al. 2008). In line with
previous longitudinal data (see Raghubar et al. 2010 for review), WM and reasoning abilities were
found to be significant predictors of arithmetical outcome. Here, reasoning and all three WM
measures were unique predictors of arithmetical performance two years later, accounting together
for an additional 13% of variance when age was first entered in the model. These results fit with
previous findings of unique contributing effects of WM and non-verbal IQ (Alloway and Alloway
2010) and verbal and visuospatial WM (Bull et al. 2008) for the prediction of mathematical outcome
and extend the findings to a wide developmental age range. Overall there was little evidence for a
16
Our findings thus suggest a consistent association between WM and reasoning measures and
arithmetical abilities throughout childhood and adolescence.
In the smaller fMRI sample, only reasoning and visuospatial WM were significant predictors of
arithmetical score at T2, which suggests verbal WM may be less strongly associated with arithmetical
performance. In line with these results, verbal WM measures at age 4 have been found to predict
reading comprehension, writing and spelling, but not mathematics, 2.5 years later (Gathercole et al.
2003), and to predict mathematical performance at the entrance but not at the end of the 1st or 3rd
years of primary school (Bull et al. 2008) (see also Meyer et al. 2010). Note that, possibly
counterintuitively, those verbal WM measures that were less strongly associated with arithmetical
performance two years later in our sample, the Backwards Digit and 3-back tasks, were those that
involved some aspect of numerical representation. Indeed it could be argued that although the
3-back task required maintaining and updating non-numerical Swedish words in WM, participants
needed to count until 3 to perform the task accurately.
These results overall support the use of WM measures, in particular visuospatial WM, for the early
identification of children at risk of poor academic outcome in arithmetic. WM training programmes
(Klingberg 2010) have been shown to improve clinical symptoms of psychiatric disorders such as
ADHD (Klingberg et al. 2002b; Klingberg et al. 2005), as well as performance on tests of mathematics,
with mathematical reasoning improvements observed six months after WM training (Holmes et al.
2009). Previous mathematics training studies have focused on specific number-related training and
obtained mixed results: training using number vs. colour-based board games led to improvements in
performance of a range of numerical tasks at the end of training and nine weeks later (Ramani and
Siegler 2008), while training on computerised tasks emphasising either numerical comparison or
small exact numerosities showed improvement in number comparison but not counting or arithmetic
17
The main aim of the current study was to investigate whether brain imaging measures of WM would
complement typical behavioural assessments and contribute uniquely to the prediction of
arithmetical outcome. The analyses focused on the IPS, a brain region which has been specifically
implicated in both numerical processing (Dehaene et al. 2003; Cohen Kadosh et al. 2008) and
visuospatial WM (Linden 2007), and where visuospatial WM and arithmetical tasks show overlapping
activity (Zago and Tzourio-Mazoyer 2002; Zago et al. 2008). IPS activation during number processing
tasks correlates with arithmetical or mathematical abilities (Rubinsten and Henik 2009; Butterworth
2010), and IPS activation during visuospatial WM tasks correlates with WM capacity (Klingberg et al.
2002a; Todd and Marois 2005; Crone et al. 2006). However, there is no previous evidence that WM
activation in the IPS may be directly linked to arithmetical performance. Instead, different neural
populations may underlie the activations observed in visuopatial WM and number processing tasks.
The present study argues against this by showing that neural activity during visuospatial WM tasks in
the IPS has predictive value for the development of arithmetical abilities.
Our results first indicated that greater activation in the whole-brain WM-Control network, in the left
IPS or in the right IPS (although at trend level only), predicted better arithmetical performance two
years later. These results are broadly consistent with those of Rotzer et al. (2009), which showed that
poor arithmetical abilities were associated with weaker right IPS activation during a spatial WM task
in 8-10 years-old children. When the age of the participants was included in our analyses, the results
showed that in combination with whole brain activity, left IPS activity during a visuospatial WM task
predicted 5% more variance in arithmetical performance two years later than age alone. There was
no significant interaction between the BOLD predictors and age, suggesting the observed effects
were consistent across the age range of the participants. Further, whole brain activity and left IPS
activity predicted 2.5% more variance than age and the behavioural reasoning and WM measures.
18
and left IPS activity during the visuospatial WM task, highlighting the specifically high association
between visuospatial WM and arithmetical performance.
When age was taken into account as a predictor, greater activation in the left IPS was thus associated
with poorer arithmetical performance two years later, while there was a trend for greater activation
in the whole-brain ROI to be associated with better arithmetical outcome. This direction of the IPS
association, and its hemispheric localisation, differ from Rotzer et al. (2009)’s findings. However, in
their study age was not taken into account. It is possible that age effects on the WM activation in the
right IPS might have affected the observed positive correlation between right IPS WM activation and
arithmetical performance observed by Rozter et al. (2009). The direction of the left IPS residual
effect observed in the current study is novel and will need to be investigated further. It is possible
that a complex pattern of relative activation levels in the different brain regions of the WM network
is what is relevant for predicting arithmetical outcome. Such a pattern may be behind the present
finding that, when age is covaried, weaker left IPS activation, in the context of a greater whole-brain
network WM activation, is associated with better arithmetical outcome.
A potential limitation of these results lies in the fact that the visuospatial WM task in the scanner
included the presentation of a single digit number in the response phase of the task. It is thus
possible that the association between IPS activation during the task and arithmetical performance
two years later partly reflects the processing of numerical representation in the response phase.
Indeed both spoken and written numerals have been shown to specifically activate the IPS (Eger et
al. 2003; Naccache and Dehaene 2001). However, the Control condition of the visuospatial WM task
also included the presentation of a single digit number, which should have reduce this potential
confound and suggests that the findings observed here may be specific to visuospatial WM
19
To test a potential application of these results, we performed additional analyses which showed that
age and behavioural measures could correctly classify only 2/9 of the 20% lower arithmetical
performers, while adding fMRI WM data to the model improved this classification more than
two-fold to 5/9. Although the sample sizes were small, these results suggest than fMRI data can be used
to improve the identification of individuals at risk of future low academic performance in the domain
of mathematics. This study thus extends previous research showing that brain measures
(event-related potentials), could identify infants and young children at risk for dyslexia (Maurer et al. 2009;
Guttorm et al. 2010, see Gabrieli 2009 for review) and provides further support for the usefulness of
neuroimaging data. It remains to be seen which fMRI cognitive task would best predict arithmetical
outcome. A combination of brain activation during a numerical processing task and numerical
performance measures outside the scanner may have the best predictive power. However, an
advantage of WM tasks is that they do not require number knowledge and could thus be performed,
and trained, at an earlier age.
Underlying the link between visuospatial WM and arithmetical abilities may be their reliance on a
common spatial “memory map”. In non-human primates, visuospatial information is assumed to be
kept in WM by sustained activity in neurons coding specifically for stimuli at different visual angles
(Funahashi et al. 1989). In humans, neural specificity for the visuospatial location of stimuli can be
demonstrated by showing retinotopic organisation in a cortical region. Retinotopy has been found
both in the IPS and the frontal eye field during the delay period of a visuospatial WM task (Konen and
Kastner 2008; Silver and Kastner 2009). Such a spatial memory map could also be used for an
analogue, spatial representation of numbers, and there is indeed evidence of spatial aspects of the
representation of numbers. Behavioural data suggest that number comparison is performed using a
mental number line, an analogue spatial representation in which numerical magnitude is represented
along an axis oriented according to the direction of writing (Dehaene et al. 1993). This representation
20
(SNARC task, Dehaene et al. 1993), and induces corresponding left/right shifts of attention (Nicholls
et al. 2008). There is evidence in early development for a number-space mapping (de Hevia and
Spelke 2010) and a general magnitude representation shared between the dimensions of space,
number and time (Lourenco and Longo 2010). In adults, a common fronto-parietal network
supporting processing of these three dimensions has been proposed (Walsh 2003), and is supported
by studies showing all three dimensions are similarly affected by saccadic compression (Burr et al.
2010). Thus the spatial mapping required by visuospatial WM tasks and the mental number line
mapping required by number comparison and arithmetical tasks may recruit similar neural
populations.
Although the effects were small, the fact that neuroimaging data could significantly improve
arithmetical outcome prediction compared to behavioural measures may be related to the
intermediate phenotypes concept put forwards in the imaging genetics literature (Meyer-Lindenberg
and Weinberger 2006). The suggestion is that neuroimaging measures may be more sensitive to
individual differences by being closer to the biological substrate. Dyscalculia and poor performance in
arithmetic are quite specifically associated with dysfunction of the IPS. Imaging data, which contrasts
well-matched conditions in terms of visual stimuli and motor responses, can provide information on
a subpart of the components that add to a behavioural WM score, e.g. processes of maintenance of
information over a delay, and can provide localised measures of corresponding brain function. In
addition, imaging data may reflect physiological or neural properties that might provide information
about future capacity, e.g. number of neurons, or measures of structural maturity (synaptic
connectivity strength and myelination), that are the basis of future cognitive development. In the
present study, IPS activation during visuospatial WM may thus reflect the potential of local neural
21
Note that, although our participants where overall typically developing, it is likely that our results
have validity for children with larger arithmetical deficits or dyscalculia, as it has been suggested that
the genetic components of mathematics learning disability are likely to be the same as those
underlying individual differences in mathematics achievement (Kovas et al. 2007). Moreover, the
results obtained here in a large age range suggest that some behavioural and brain measures are
good predictors of future arithmetical performance throughout development. Further work may
identify whether some measures may be more specific to young age groups, for the development of
22
References
Aiken LS, West SG. 1991. Multiple regression: Testing and interpreting interactions. Newbury Park,
CA: Sage.
Alloway TP, Gathercole SE, Adams A-M, Willis C, Eaglen R, Lamont E. 2005. Working memory and
phonological awareness as predictors of progress towards early learning goals at school entry. Brit J
Dev Psychol. 23:417-426.
Alloway TP. 2007. Automated Working Memory Assessment manual. Oxford: Harcourt.
Alloway TP, Gathercole SE, Kirkwood H, Elliott J. 2009. The cognitive and behavioral characteristics of
children with low working memory. Child Dev. 80:606-621.
Alloway TP, Alloway RG. 2010. Investigating the predictive roles of working memory and IQ in
academic attainment. J Exp Child Psychol. 106:20-29.
American Psychiatric Association. (2000). Diagnostic and statistical manual of mental disorders
(revised 4th ed.). Washington, DC: Author.
Andersson U. 2010. Skill development in different components of arithmetic and basic cognitive
functions: findings from a 3-year longitudinal study of children with different types of learning
difficulties. J Educ Psychol. 102:115-134.
Berch DB. 2008. Working memory and mathematical cognitive development: limitations of
limited-capacity resource models. Dev Neuropsychol. 33:427-446.
Bergman Nutley S, Soderqvist S, Bryde S, Humphreys K, Klingberg T. 2010. Measuring working
23
Brett M, Valabregue R, Poline J-B. 2002. Region of interest analysis using an SPM toolbox [abstract].
8th International Conference on Functional Mapping of the Human Brain, June 2-6 2002, Sendai,
Japan.
Bull R, Espy KA, Wiebe SA. 2008. Short-term memory, working memory, and executive functioning in
preschoolers: longitudinal predictors of mathematical achievement at age 7 years. Dev
Neuropsychol. 33:205-228.
Burr DC, Ross J, Binda P, Morrone MC. 2010. Saccades compress space, time and number. Trends
Cogn Sci 14:528-533.
Butterworth B. 2005. The development of arithmetical abilities. J Child Psychol Psyc. 46:3-18.
Butterworth B. 2010. Foundational numerical capacities and the origins of dyscalculia. Trends Cogn
Sci. 14:534-541.
Cohen Kadosh R, Lammertyn J, Izard V. 2008. Are numbers special? An overview of chronometric,
neuroimaging, developmental and comparative studies of magnitude representation. Progr
Neurobiol. 84:132-147.
Crone EA, Wendelken C, Donohue S, Van LL, Bunge SA. 2006. Neurocognitive development of the
ability to manipulate information in working memory. Proc Natl Acad Sci USA. 103:9315-9320.
Dehaene S, Bossini S, Giraux P. 1993. The mental representation of parity and number magnitude. J
Exp Psychol Gen. 122:371-396.
Dehaene S, Piazza M, Pinel P, Cohen L. 2003. Three parietal circuits for number processing. Cogn.
Neuropsychol. 20:487-506.
Dehaene S, Molko N, Cohen L, Wilson AJ. 2004. Arithmetic and the brain. Curr Opin Neurobiol.
24
Eger E, Sterzer P, Russ MO, Giraud A-L, Kleinschmidt A. 2003. A supramodal number representation
in human intraparietal cortex. Neuron, 37:719-725.
Funahashi S, Bruce CJ, Goldman-Rakic PS. 1989. Mnemonic coding of visual space in the monkey’s
dorsolateral prefrontal cortex. J Neurophysiol. 6:331-349.
Gabrieli JDE. 2009. Dyslexia : a new synergy between. Science. 325:280-283.
Gathercole SE, Brown L, Pickering SJ. 2003. Working memory assessments at school entry as
longitudinal predictors of National Curriculum attainment levels. Educ Child Psychol. 20:109-122.
Geary DC, Bailey DH, Hoard MK. 2009. Predicting mathematical achievement and mathematical
learning disability with a simple screening tool: The number sets test. J Psychoeduc Assess.
27:265-279.
Gersten R, Jordan NC, Flojo JR. 2005. Early identification and interventions for students with
mathematics difficulties. J Learn Disabil. 38:293-304.
Gillham B, Hesse K. 2001. Basic Number Screening Test. London: Hodder and Stoughton
International.
Gross J. 2009. The long term costs of numeracy difficulties. Every Child Chance Trust, (KPMG).
Guttorm TK, Leppänen PHT, Hämäläinen JA, Eklund KM, Lyytinen HJ. 2010. Newborn event-related
potentials predict poorer pre-reading skills in children at risk for dyslexia. J Learn Disabil. 43:391-401.
Henry LA, MacLean M. 2003. Relationships between working memory , expressive vocabulary and
arithmetical reasoning in children with and without intellectual disabilities. Educ Child Psychol.
20:51-64.
25
Holmes J, Gathercole SE, Dunning DL. 2009. Adaptive training leads to sustained enhancement of
poor working memory in children. Dev Sci. 12:F9-15.
Isaacs EB, Edmonds CJ, Lucas A, Gadian DG. 2001. Calculation difficulties in children of very low
birthweight: A neural correlate. Brain 124:1701-1707.
Jarvis HL, Gathercole SE. 2003. Verbal and non-verbal working memory and achievements on
National Curriculum tests at 11 and 14 years of age. Educ Child Psychol. 20:123-140.
Kaufmann L, Vogel SE, Starke M, Kremser C, Schocke M, Wood, G. 2009. Developmental dyscalculia:
Compensatory mechanisms in left intraparietal regions in response to nonsymbolic magnitudes.
Behav Brain Funct. 5:35.
Klingberg T, Forssberg H, Westerberg H. 2002a. Increased brain activity in frontal and parietal cortex
underlies the development of visuospatial working memory capacity during childhood. J Cogn
Neurosci. 14:1-10.
Klingberg T, Forssberg H, Westerberg H. 2002b. Training of working memory in children with ADHD.
Journal of clinical and experimental neuropsychology : official journal of the International
Neuropsychological Society 24:781-791.
Klingberg T, Fernell E, Olesen PJ, Johnson M, Gustafsson P, Dahlström K, Gillberg CG, Forssberg H,
Westerberg H. 2005. Computerized training of working memory in children with ADHD--a
randomized, controlled trial. J Am Acad Child Psy. 44:177-186.
Klingberg T. 2010. Training and plasticity of working memory. Trends Cogn Sci. 14:317-324.
Konen CS, Kastner S. 2008. Representation of eye movements and stimulus motion in topographically
organized areas of human posterior parietal cortex. J Neurosci. 28:8361-8375.
Kovas Y, Haworth CMA, Dale PS, Plomin R. 2007. The genetic and environmental origins of learning
26
Kucian K, Loenneker T, Dietrich T, Dosch M, Martin E, von Aster M. 2006. Impaired neural networks
for approximate calculation in dyscalculic children: a functional MRI study. Behav Brain Funct 2:31.
Kyttälä M, Aunio P, Lehto JE, Luit JV. 2003. Visuospatial working memory and early numeracy. Educ
Child Psychol. 20:65-76.
Linden DEJ. 2007. The working memory networks of the human brain. Neuroscientist. 13:257-267.
Lourenco SF, Longo MR. 2010. General magnitude representation in human infants. Psychol Sci.
21:873-881.
Martin M, Mullis S, Chrostowski S (Eds). 2004. TIMSS 2003 Technical Report. Chestnut Hill, MA:
TIMSS & PIRLS International Study Centre, Boston College.
Maurer U, Bucher K, Brem S, Benz R, Kranz F, Schulz E, Mark S van der, Steinhausen H-C, Brandeis D.
2009. Neurophysiology in preschool improves behavioral prediction of reading ability throughout
primary school. Biol Psychiat. 66:341-348.
Maybery MT, Do N. 2003. Relationships between facets of working memory and performance on a
curriculum-based mathematics test in children. Educ Child Psychol. 20:77-92.
Meyer ML, Salimpoor VN, Wu SS, Geary DC, Menon V. 2010. Differential contribution of specific
working memory components to mathematics achievement in 2nd and 3rd graders. Learn Individ
Differ. 20:101-109.
Meyer-Lindenberg A, Weinberger DR. 2006. Intermediate phenotypes and genetic mechanisms of
psychiatric disorders. Nat Rev Neurosci. 7:818-827.
Mussolin C, De Volder A, Grandin C, Schlögel X, Nassogne M-C, Noël M-P. 2010. Neural correlates of
27
Naccache L, Dehaene S. 2001. The priming method: imaging unconscious repetition priming reveals
an abstract representation of number in the parietal lobes. Cerebral Cortex. 11:966-74.
Nicholls MER, Loftus a M, Gevers W. 2008. Look, no hands: a perceptual task shows that number
magnitude induces shifts of attention. Psychon Bull Rev. 15:413-418.
Parsons S, Bynner J. 2005. Does numeracy matter more? London: National Research and
Development Centre for Adult Literacy and Numeracy, Institute of Education.
Passolunghi M, Vercelloni B, Schadee H. 2007. The precursors of mathematics learning: working
memory, phonological ability and numerical competence. Cogn Dev. 22:165-184.
Price GR, Holloway I, Räsänen P, Vesterinen M, Ansari D. 2007. Impaired parietal magnitude
processing in developmental dyscalculia. Curr Biol.17:R1042-3.
Primi R, Ferrão ME, Almeida LS. 2010. Fluid intelligence as a predictor of learning: a longitudinal
multilevel approach applied to math. Learn Individ Differ. 20:446-451.
Raghubar KP, Barnes MA, Hecht SA. 2010. Working memory and mathematics: a review of
developmental, individual difference, and cognitive approaches. Learn Individ Diff. 20:110-122.
Ramani GB, Siegler RS. 2008. Promoting broad and stable improvements in low-income childrenʼs
numerical knowledge through playing number board games. Child Dev. 79:375-394.
Rasmussen C, Bisanz J. 2005. Representation and working memory in early arithmetic. J Exp Child
Psychol. 91:137-157.
Raven JC. 1998. Manual for Raven’s Progressive Matrices. Oxford: Oxford Psychologists Press.
Rotzer S, Kucian K, Martin E, von Aster M, Klaver P, Loenneker, T. 2008. Optimized voxel-based
28
Rotzer S, Loenneker T, Kucian K, Martin E, Klaver P, von Aster M. 2009. Dysfunctional neural network
of spatial working memory contributes to developmental dyscalculia. Neuropsychologia
47:2859-2865.
Rubinsten O, Henik A. 2009. Developmental dyscalculia: heterogeneity might not mean different
mechanisms. Trends Cogn Sci. 13:92-99.
Rykhlevskaia E, Uddin LQ, Kondos L, Menon V. 2009. Neuroanatomical correlates of developmental
dyscalculia: Combined evidence from morphometry and tractography. Front Hum Neurosci. 3:51.
Räsänen P, Salminen J, Wilson AJ, Aunio P, Dehaene S. 2009. Computer-assisted intervention for
children with low numeracy skills. Cogn Dev. 24:450-472.
Silver MA, Kastner S. 2009. Topographic maps in human frontal and parietal cortex. Trends Cogn Sci.
13:488-495.
Söderqvist S, McNab F, Peyrard-Janvid M, Matsson H, Humphreys K, Kere J, Klingberg T. 2010. The
SNAP25 gene is linked to working memory capacity and maturation of the posterior cingulate cortex
during childhood. Biol Psychiat. 68:1120-1125.
Todd JJ, Marois R. 2005. Posterior parietal cortex activity predicts individual differences in visual
short-term memory capacity. Cogn Affec Behav Neurosci. 5:144-155.
Van Essen DC, Drury HA, Dickson J, Harwell J, Hanlon D, Anderson CH. 2001. An integrated software
suite for surface-based analyses of cerebral cortex. J Am Med Inform Assn. 8:443-459.
Van Essen DC. 2005. A Population-Average, Landmark- and Surface-based (PALS) atlas of human
cerebral cortex. Neuroimage. 28:635-662.
Walsh V. 2003. A theory of magnitude: common cortical metrics of time, space and quantity. Trends
29
Zago L, Tzourio-Mazoyer N. 2002. Distinguishing visuospatial working memory and complex mental
calculation areas within the parietal lobes. Neuroscience Letters 331:45-49.
Zago L, Petit L, Turbelin M-R, Andersson F, Vigneau M, Tzourio-Mazoyer N. 2008. How verbal and
spatial manipulation networks contribute to calculation: an fMRI study. Neuropsychologia.
46:2403-2414.
30
Funding
This work was supported by Knut and Alice Wallenberg Foundation (KAW 2005.0179 and 2010.0105),
The Swedish Research Council (K2010-61X-21441-01-3) and a Swedish Royal Bank Tercentennial
Foundation grant in the program “Learning and Memory in Children and Young Adults”
(PDOKJ028/2006:12) to TK.
Acknowledgements
We would like to thank Jens Gisselgård, Ylva Samuelsson, Douglas Sjöwall and Sissela Bergman
Nutley for help with study administration, Kerstin Eriksson and Tomas Jonsson for scanning, and Ylva
Samuelsson and Fiona McNab for preliminary analysis work. Data from round 1 of testing was
31
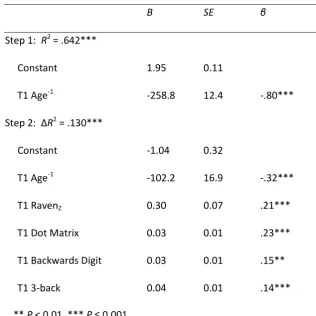
[image:32.595.137.454.201.518.2]Tables
Table 1: Multiple regression predicting arithmetical performance at T2 using age, reasoning (RavenZ)
and working memory measures (Dot Matrix, Backwards Digit, 3-back) in the behavioural sample (N =
246).
B SE β
Step 1: R2 = .642***
Constant 1.95 0.11
T1 Age-1 -258.8 12.4 -.80***
Step 2: ΔR2 = .130***
Constant -1.04 0.32
T1 Age-1 -102.2 16.9 -.32***
T1 RavenZ 0.30 0.07 .21***
T1 Dot Matrix 0.03 0.01 .23***
T1 Backwards Digit 0.03 0.01 .15**
T1 3-back 0.04 0.01 .14***
32
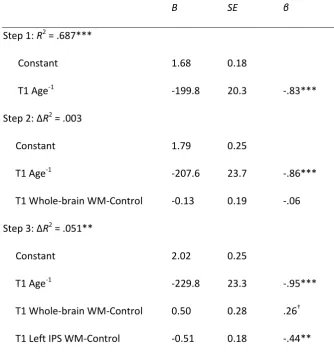
Table 2: Multiple regression predicting arithmetical performance at T2 using age, whole-brain and
left IPS WM – Control ROIs mean activation in the fMRI sample (N = 46).
B SE β
Step 1: R2 = .687***
Constant 1.68 0.18
T1 Age-1 -199.8 20.3 -.83***
Step 2: ΔR2 = .003
Constant 1.79 0.25
T1 Age-1 -207.6 23.7 -.86***
T1 Whole-brain WM-Control -0.13 0.19 -.06
Step 3: ΔR2 = .051**
Constant 2.02 0.25
T1 Age-1 -229.8 23.3 -.95***
T1 Whole-brain WM-Control 0.50 0.28 .26†
T1 Left IPS WM-Control -0.51 0.18 -.44**
†
33
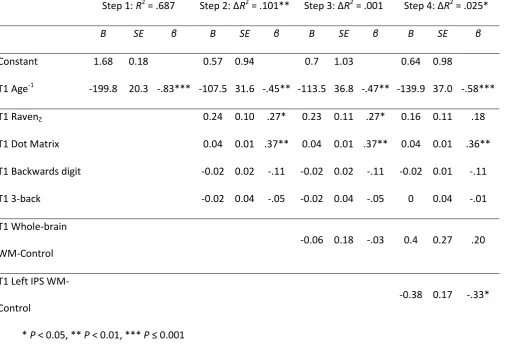
Table 3: Multiple regression predicting arithmetical performance at T2 using age, reasoning and WM
behavioural measures, and whole-brain and left IPS WM – Control ROIs mean activation in the fMRI
sample (N = 46).
Step 1: R2 = .687 Step 2: ΔR2 = .101** Step 3: ΔR2 = .001 Step 4: ΔR2 = .025*
B SE β B SE β B SE β B SE β
Constant 1.68 0.18 0.57 0.94 0.7 1.03 0.64 0.98
T1 Age-1 -199.8 20.3 -.83*** -107.5 31.6 -.45** -113.5 36.8 -.47** -139.9 37.0 -.58***
T1 RavenZ 0.24 0.10 .27* 0.23 0.11 .27* 0.16 0.11 .18
T1 Dot Matrix 0.04 0.01 .37** 0.04 0.01 .37** 0.04 0.01 .36**
T1 Backwards digit -0.02 0.02 -.11 -0.02 0.02 -.11 -0.02 0.01 -.11
T1 3-back -0.02 0.04 -.05 -0.02 0.04 -.05 0 0.04 -.01
T1 Whole-brain
WM-Control
-0.06 0.18 -.03 0.4 0.27 .20
T1 Left IPS
WM-Control
-0.38 0.17 -.33*
34
Captions
Figure 1: Scatterplot of arithmetical performance of T2 as a function of age at T1. The line represents
a fit of the data as a function of age-1, which was found to be a better fit of the development of
arithmetical performance than functions of age or ln(age).
Figure 2: Representation of the ROIs used in the fMRI analyses. (A) Coronal and transverse slices: the
whole-brain contrast of the WM – Control conditions is represented in yellow and was performed
using FDR correction (P < 0.05); the IPS ROIs are represented in blue and were 8 mm radius spheres
centered on coordinates obtained by Cohen-Kadosh et al. (Cohen Kadosh et al. 2008) in a
meta-analysis of fMRI studies of numerical representation (left IPS: -31 -54 46; right IPS: 37 -50 43). (B)
Render of the whole-brain main effect and IPS ROIs on a surface-based human atlas (see Materials
35
Figure 1
[image:36.595.69.510.147.643.2]