3737
INTEGRATING QUALITY FEATURES INTO TECHNOLOGY
ACCEPTANCE MODEL FOR EXAMINING THE
ACCEPTANCE OF MOBILE BANKING
1MALEK ZAKARYA ALKSASBEH, 2BASSAM A. Y. ALQARALLEH
1&2Faculty of Information Technology, Al-Hussein Bin Talal University, Ma’an, Jordan
E-mail: 1[email protected], 2[email protected]
ABSTRACT
Although the banking sector in Jordan is a regional leader in Mobile banking (MB), but it is still working hard to achieve full utilization of MB services to add value to users in order to enhance customer relationships and to achieve some cost advantages. Advancements and innovations in mobile technologies are leading the banking sector to new and innovative banking services. New MB system technologies and services enable some new capabilities that allow customers to be active. When MB system with new technologies and services is presented, it needs to be accepted by its users. The acceptance of MB system can be influenced by different factors. The aim of this study is to examine the effect of three key quality features (system quality, information quality, and service quality) on customers’ beliefs which may significantly influence the user’s acceptance of MB. The model of this study is mainly based on extending technology acceptance model (TAM). The questionnaires were distributed to 354 customers selected based on the systematic sampling method. 253 usable questionnaires were returned and used to conduct the hypothesis test. The usable response rate was 71 %. Our study highlights the importance of the system quality, information quality, and service quality as the primary antecedents of MB acceptance. The research results revealed that these three variables had positive effects on customers’ perception with regard to their beliefs (i.e., perceived usefulness and perceived ease of use); and as a result, this positive effect can lead to enhance customers’ behavioral intention to use MB application.
Keywords: Mobile banking acceptance, TAM model, System quality, Information quality, Service quality
1. INTRODUCTION
Globally, the Internet has impacted and changed the way we live by creating new ways for social communications, congregations and, information sharing between citizens. Therefore, a new technology, which is known as mobile banking (MB), has emerged as a result of this important development in information technology (IT), MB refers to using mobile devices to provide financial information, communications and transactions to customers such as checking account balances and transferring funds from anywhere, at any time [1]. In Jordan, many banks seek for new technology that facilitates online information sharing and transactions. Linking banking business to customers through mobile devices such as smart phones or PDAs is one of these competitive strategies [2-4]. However, a low acceptance rate of MB services by banking customers is an important concern of banking institutions worldwide. Similarly, Jordanian banks customers tend to be not fully motivated to accept MB services [5]. A recent study [6] mentioned that the acceptance of MB
3738 Q1) Do the three key quality features (system quality, information quality, and service quality) have positive effects on MB acceptance in Jordan? Q2) Which quality features are the most relevant for developing MB applications?
The rest of the paper is organized as follows: theoretical background is presented in Section 2. Our proposed research model and hypotheses are described in Section 3, research methodology is presented in Section 4, data analysis and research results are presented in section 5. Finally, conclusion and future works are presented in Section 6.
2. THEORETICAL BACKGROUND
MB has access to banking services such as manage account, transfer money, pay bills, etc. It helps banks to improve their service quality and to reduce service costs [7]. In previous research, many researchers studied in-depth many issues of MB such as framework, platform, features, usefulness application, evaluating and etc. [8-11]. However, consumers almost still unwilling to use MB applications and participate in this mode [6]. Therefore, success in this task depends on the customer acceptance of these technologies which forms one of the top challenges in Information System (IS) research, particularly in Jordan [12]. In order to provide theoretical foundation for investigating the acceptance of MB services, the prevalent study is derived based on common theory in the field of IS acceptance which is the Technology Acceptance Model (TAM) [13-17]. Taking this point further, according to the previous studies, there are important factors that might be integrated with the TAM and which would
influence users’ acceptance of MB [18-20]. Pavlou and El Sawy [18] recommended the acceptance success factors for mobile commerce which exist in the theory of Information Systems Success by DeLone and McLean [21]. This theory focuses on three primary success factors that are required for any IS, namely: information quality, system quality, and service quality. Moreover, these factors significantly influence the consumer acceptance [20, 22, 23]. The current research is designed to integrate the system quality, information quality, and service quality factors with TAM in order to present a more comprehensive model of MB acceptance in Jordan.
2.1 Technology Acceptance Model (TAM)
TAM was proposed by Davis [24] to explain the potential user’s behavioral intentions when using a technological innovation. TAM explains why end-user accepts or rejects system or new technology by adapting the Theory of Reasoned Action (TRA) [15]. In other words, it explains the causal links between beliefs (the usefulness of a system and ease of use of a system) and users’ attitudes, behavioral intentions, and the actual usage of the system. Perceived ease of use (PEOU) refer to the degree to which the end-user believes that using a particular system would be free of effort, perceived usefulness (PU) indicates the degree to which the end-user believes that using a particular system will enhance the performance, and the dependent variable behavioral intention (BI) point out the degree to which the end-user has formulated conscious plans to perform or not perform some specified future behavior [24]. The principal TAM concepts are portrayed in Figure 1. [image:2.612.90.531.534.723.2]
3739 Over time, TAM has been easily subjected to extension or integration through a rigorous development process, due to its vast flexibility [14]. Nowadays, TAM has become the most frequently applied model in IS research because of its understandability and simplicity [25-28]. Since TAM has demonstrated adaptability, it can be used as a base model for investigating user acceptance of MB [29].
2.2 System Quality
System quality (SQ) refers to the ability of the IS to conduct transaction, which includes software and data components. The measurement of SQ typically focuses on estimating the performance characteristics of the system under study. Some researchers focused on reliability, response time, resource utilization, investment, aggregation of details, human factors, and system trust and accuracy. In our work, we have selected the following system quality elements: reliability, usability, adaptability, trust, and, finally, maintainability [30-37].
2.3 Information Quality
Information quality(IQ) refers to the quality of outputs that the information system produces [21], which can be in the form of reports or online screens which are important concerns for financial institutions. This information can enhance the understanding of some key issues relevant to the design and implementation of banking systems in
Jordan. In line with, many studies have interpreted and classified IQ criteria conform to its context. In the context of this research, the selected measures of information quality elements are: completeness, understandability, security, availability, and accuracy [38-42].
2.4 Service Quality
Service quality (SEQ) in the context of offline and online services has considerable attention within the literature [43]. Generally, SEQ has been identified as the degree of difference of service performance between what customers expect and what they receive [29]. In the context of online services, e-service has been identified as the electronic provision of interactive web-based service that is delivered through the Internet [44-46]. E-service quality can be described as the overall customer evaluation and judgment of both the excellence and the quality of e-service delivery in the virtual marketplace [35, 47]. In this study, the selected measures of SEQ elements are: availability, reliability, integrity, functionality, and efficiency [48-52].
3. RESEARCH MODEL AND HYPOTHESES
[image:3.612.100.528.459.717.2]
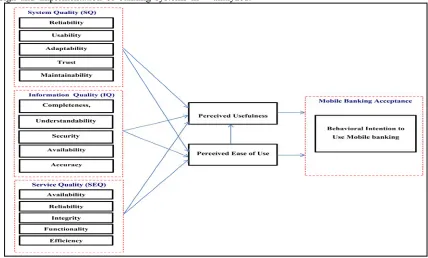
In accordance with the previously stated objectives and consistent with related literature a theoretical model was developed. Figure 2 shows a theoretically interesting model to be tested and analyzed.
3740 This study tested the following hypotheses:
H1: System quality factors have a significant positive effect on Perceived ease of use.
H2: Information quality factors have a significant positive effect on Perceived ease of use.
H3: Service quality factors have a significant positive effect on Perceived ease of use.
H4: System quality factors have a significant positive effect on Perceived usefulness.
H5: Information quality factors have a significant positive effect on Perceived usefulness.
H6: Service quality factors have a significant positive effect on Perceived usefulness.
H7: Perceived ease of use has a significant positive effect on Perceived usefulness.
H8: Perceived usefulness has a significant positive effect on MB acceptance.
H9: Perceived ease of use has a significant positive effect on MB acceptance.
4. RESEARCH METHODOLOGY
4.1 Questionnaire Design
In this research, we have developed our questionnaire by adapting questionnaires which have been used in previous studies. The closed questionnaire used in the survey was organized in two parts: the first part had demographic questions, the second part dealt with system quality, information quality, service quality, perceived Usefulness, perceived ease of use and mobile banking acceptance.
The questions were designed to be simple and short. The questionnaire was translated into Arabic language because the respondents are native Arabic language speakers using back translation technique[53]. The questionnaire was sent to two bilingual experts (English/Arabic) in order to ensure successful translation in terms of equivalency between the two versions. The questionnaires were distributed personally to the group of participating respondents via the research team. In this way, our team was able to clarify and answer any question immediately in order to eliminate ambiguity while the respondents filling in the questionnaire. On the other hand, the research team had good opportunity to introduce the research topic and encourage the respondents to give full and accurate answers [54].
4.2 Sample Frame
A random sample was selected of new elite banks customers in the society such as the owners
of small and medium enterprises, retailers/wholesalers, importers/exporters, servants in banks and other financial institutions. These groups of elite banks customers were selected because they represent the ideal busy men/women who already have bank accounts either personal or business and have used some kind of traditional banking and/or electronic banking services. Our sample members have the necessary attributes to provide useful information needed for this survey. The sample was also selected from both private sector business owners and public sector financial managers in order to have balanced responses to alleviate any biases from one sector.
.
4.3 Sample Selection Procedure and Data
Collection
In order to identify private enterprise owners who have bank accounts, a list of bank accounts of small- and medium-sized businesses (SMEs) and their contact information were collected from the Ministry of Industry and Trade. In conjunction, similar lists of the senior public sector officers and senior financial institution officers were obtained from the Social Security Corporation (SSC). Overall, a total of 4632 names were used for the selection of samples.
A systematic sampling design was employed to
select respondents based the ratio of the number of customers/enterprises in each category group to the total number of the population. As a result, our sampling technique selected 49 customers from the public sector, 14 from the manufacturing sector, 223 from the retail/wholesale sector, 37 from the importer/exporter category, 13 from the non-bank financial institution sector, and 18 from the banking sector.
Self-administered questionnaire was used to collect the data from the target respondents. Out of total 354 distributed questionnaires 276 were retuned giving a high and acceptable response rate of 78 per cent. 23 responses were excluded because the returned questionnaires have been found incomplete. Finally, a total number of 253 responses were accepted for final analysis (usable response rate 71 per cent).
5. DATA ANALYSIS AND RESEARCH
RESULTS
3741 years and formed the largest age group 41.9 per cent. Also, more than half of the respondents 50.6 per cent had more than ten years of Internet
experience. However, majority of respondents 78.3 per cent did not use MB applications.
Demographic N %
Gender
Male 188 74.3
Female 65 25.7
Age
20-29 33 13
30-39 106 41.9
40-49 94 37.2
50-59 18 7.1
60 and above 2 0.8
Internet Experience
>5 years 22 8.7
6 -10 years 103 40.7
>10 years 128 50.6
Using mobile banking
User 55 21.7
[image:5.612.91.521.126.321.2]Not a User 198 78.3
Table 1: Demographic Profile of Respondents
5.1 Data Reliability and Validity
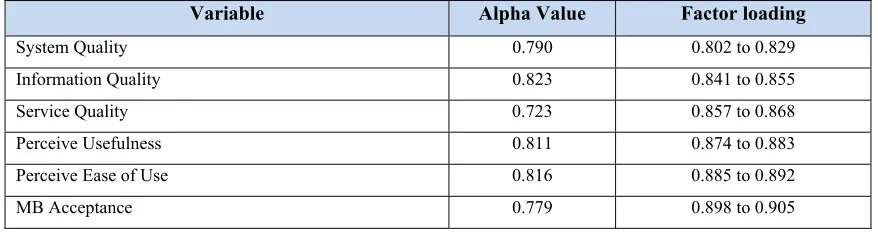
To ensure the reliability and validity of the instrument, the internal consistency reliability of data is measured with Cronbach’s alpha. The inter-item consistency is measured with Cronbach’s alpha for all variables which exceeds the minimum threshold (0.70) as suggested by hair et al. [55]. As shown in Table 2, Cronbach’s alpha was greater than 0.7, ranging from 0.723 to 0.845. These results show good level of internal consistency and indicate satisfactory reliability for all variables. In term of validity, convergent validity test measures whether scores under individual test items
are correlated; it can be evidenced by relatively high correlations between items under the same variable [56]. Convergent validity can be evaluated based on the investigation of factor loadings that should be greater than (0.7) as recommended by Campbell and Fiske [57]. The principal components analysis with Varimax rotation was conducted in order to determine the underlying structure for each variable [58]. As presented in Table 2, the results indicated that the factor loadings were above (0.7) thus confirming convergent validity.
Variable Alpha Value Factor loading
System Quality 0.790 0.802 to 0.829
Information Quality 0.823 0.841 to 0.855
Service Quality 0.723 0.857 to 0.868
Perceive Usefulness 0.811 0.874 to 0.883
Perceive Ease of Use 0.816 0.885 to 0.892
MB Acceptance 0.779 0.898 to 0.905
Table 2: Reliability and Convergent Validity tests
Discriminant validity or divergent validity test determines the degree of correlation between the different variables. If the degree of correlation is weak, this means that the measured variables are unrelated. In other words, each variable is unique and measures different dimension [57]. Discriminant validity was conducted using the
[image:5.612.87.526.497.613.2]3742
Variables SQ IQ SEQ PU PEOU BI
SQ 1
IQ 0.482 1
SEQ 0.472 0.443 1
PU 0. 593 0. 454 0. 659 1
PEOU 0. 534 0. 524 0. 458 0.713 1
[image:6.612.91.525.70.244.2]BI (MB Acceptance) 0.468 0.429 0.293 0. 773 0. 629 1
Table 3: Discriminant validity tests
Therefore, the results support the reliability and validity of the variables in the research model that may contribute to the customers' acceptance of MB applications in Jordan .
5.2 Result of Corelation Analysis
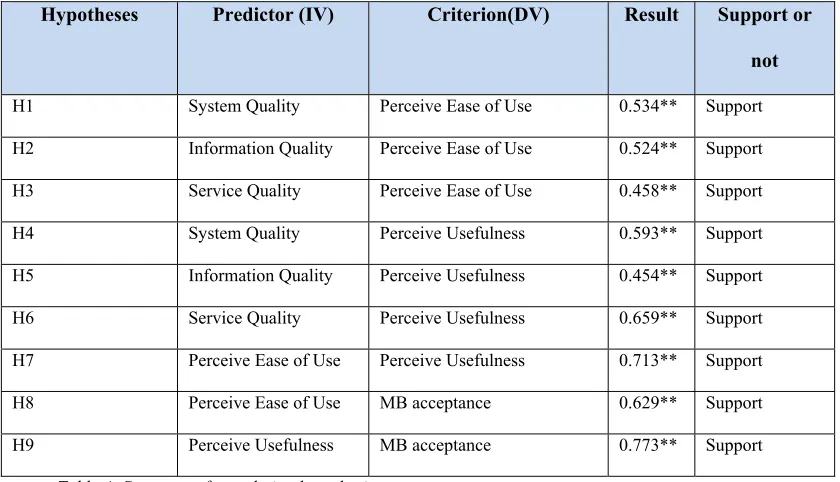
The study proposed nine hypotheses to test the relationships between the variables in the research model. The mean values of variables within the
variables were calculated and correlation analysis was conducted on these values. All hypotheses test indicate a positive relationship between variables; thus a positive correlation different from zero and meeting the minimum criterion stated earlier supports the hypothesis and the relationships. The correlations between the independents variables (IVs) on the dependent variables (DVs) in the research model are presented in Table 4.
Hypotheses Predictor (IV) Criterion(DV) Result Support or
not
H1 System Quality Perceive Ease of Use 0.534** Support
H2 Information Quality Perceive Ease of Use 0.524** Support
H3 Service Quality Perceive Ease of Use 0.458** Support
H4 System Quality Perceive Usefulness 0.593** Support
H5 Information Quality Perceive Usefulness 0.454** Support
H6 Service Quality Perceive Usefulness 0.659** Support
H7 Perceive Ease of Use Perceive Usefulness 0.713** Support
H8 Perceive Ease of Use MB acceptance 0.629** Support
H9 Perceive Usefulness MB acceptance 0.773** Support
Table 4: Summary of correlation hypothesis test
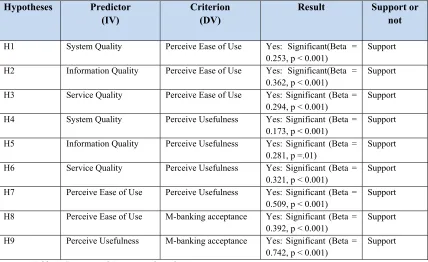
5.3 Results of Regression Analysis
In this study, 9 hypotheses were proposed to test the influences of quality features on the perceived usefulness and perceived ease of use that can affect the customers’ behavioral intention to use of MB applications. Based on that, there are three DVs in this study. Thus, the proposed hypotheses are tested by multiple regression analysis.
[image:6.612.97.517.381.622.2]3743 0.362, p > 0.001), and service quality (H2, β = 0.294, p > 0.001). Furthermore, the value of R2 for
the perceived ease of use as a DV is 0.894; this means that system quality, information quality, and service quality within the proposed model are capable of explaining 88.6% of the variance in the perceived ease of use of MB application. Also, the first regression model supports the following hypotheses:
H1: System quality factors have a significant positive effect on Perceived ease of use.
H2: Information quality factors have a significant positive effect on Perceived ease of use.
H3: Service quality factors have a significant positive effect on Perceived ease of use.
The second regression model was tested by multiple regression analysis between perceived usefulness as a DV with system quality, information quality, and service quality. The results in Table 5 showed that the perceived usefulness was significantly influenced by system quality (H4,
β = 0.173, p > 0.001), information quality (H5, β = 0.281, p > 0.01), service quality (H6, β = 0.321, p > 0.001), and perceived ease of use (H7, β = 0.509, p
> 0.001). In addition, the value of R2 for the
perceived usefulness as a DV is 0.894; this means that system quality, information quality, and service quality with perceived ease of use in the proposed model are capable of explaining 89.4% of the variance in the perceived usefulness of MB
applications. Also, the second regression model supports the following hypotheses:
H4: System quality factors have a significant positive effect on Perceived usefulness.
H5: Information quality factors have a significant
positive effect on Perceived usefulness.
H6: Service quality factors have a significant positive effect on Perceived usefulness.
H7: Perceived ease of use has a significant positive effect on Perceived usefulness.
In the third regression model, the customers’ behavioral intention to accept and use MB applications was significantly affected by two determinants including perceived ease of use (H8, β
= 0.392, p > 0.001) and perceived usefulness (H9, β
= 0.742, p > 0.001) as depicted in Table 5. In addition, the value of R2 for the dependent variable
behavioral intention to use is 0.775; this means that the perceived ease of use and perceived usefulness are capable of explaining 77.5 % of the variance in the behavioral intention to use MB. Thus, the third regression model supports the following hypotheses:
H8: Perceived usefulness has a significant positive effect on MB acceptance.
H9: Perceived ease of use has a significant positive effect on MB acceptance.
The summary of regression hypothesis tests is presented in Table 5.
Hypotheses Predictor
(IV)
Criterion (DV)
Result Support or
not
H1 System Quality Perceive Ease of Use Yes: Significant(Beta =
0.253, p < 0.001)
Support
H2 Information Quality Perceive Ease of Use Yes: Significant(Beta = 0.362, p < 0.001)
Support
H3 Service Quality Perceive Ease of Use Yes: Significant (Beta = 0.294, p < 0.001)
Support
H4 System Quality Perceive Usefulness Yes: Significant (Beta = 0.173, p < 0.001)
Support
H5 Information Quality Perceive Usefulness Yes: Significant (Beta = 0.281, p =.01)
Support
H6 Service Quality Perceive Usefulness Yes: Significant (Beta = 0.321, p < 0.001)
Support
H7 Perceive Ease of Use Perceive Usefulness Yes: Significant (Beta = 0.509, p < 0.001)
Support
H8 Perceive Ease of Use M-banking acceptance Yes: Significant (Beta = 0.392, p < 0.001)
Support
H9 Perceive Usefulness M-banking acceptance Yes: Significant (Beta = 0.742, p < 0.001)
[image:7.612.93.521.452.714.2]Support
3744
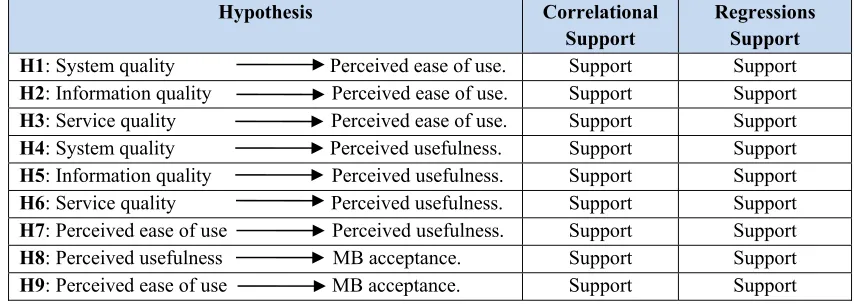
5.4 Hypotheses Conclusions
The results of hypothesis testing are depicted in Table 5. All the zero-order correlation tests of the hypotheses are significant and thus support the hypotheses at this level. System quality,
information quality, service quality, perceived usefulness, and perceived ease of use are found to have a positive effect on MB acceptance. Moreover, all regressions tests are supported.
Hypothesis Correlational
Support
Regressions Support H1: System quality Perceived ease of use. Support Support
H2: Information quality Perceived ease of use. Support Support
H3: Service quality Perceived ease of use. Support Support
H4: System quality Perceived usefulness. Support Support
H5: Information quality Perceived usefulness. Support Support
H6: Service quality Perceived usefulness. Support Support
H7: Perceived ease of use Perceived usefulness. Support Support
H8: Perceived usefulness MB acceptance. Support Support
[image:8.612.91.518.177.329.2]H9: Perceived ease of use MB acceptance. Support Support
Table 5: Summary of hypothesis tests
The results of this study indicate that customers’ beliefs with regard to their perceived ease of use and perceived usefulness are the main determinants of acceptance and both of them affect customers’ behavioral intention to use MB applications positively. In view of this fact, it can be concluded that system quality, information quality, and service quality which are the antecedents of MB acceptance have positive effects on customer beliefs, and as a result, it affects positively the customers’ behavioral intention to use MB applications through perceived ease of use and perceived usefulness. In fact, quality features have been mentioned as the main antecedents of IS acceptance in most past studies. The effects of these quality features on MB acceptance have been rarely evaluated. In this study, the results and implications for quality features on customer beliefs have been discussed below.
In this study, the analysis revealed that system quality has a significant positive direct effect on perceived ease of use and perceived usefulness, which supports the prior studies in the area of e-banking services [60-63]. The results of this study indicate that when the customer perceives that the system is complete, sufficient and provides various banking functions they will feel that MB applications are more useful and easy to use. In this study, information quality is found to have a strong effect on perceived ease of use and perceived usefulness, which confirms the results of the previous research studies [62, 63]. These results indicates that when a customer perceives that the
information are complete, understandable, secure, available, and accurate they will feel that MB applications are more useful and easy to use. Also, this study showed that service quality has significant effects on perceived ease of use and perceived usefulness, that is in line with the prior studies of [62, 64],which found that service quality has a significant effect on perceived ease of use and perceived usefulness of e-banking system. The results indicate that if the customer perceives that services provided by MB applications are available, reliable, and efficient and also ensure both integrity and functionality that will affect positively the customers’ acceptance of MB applications.
In addition, this study indicates that TAM variables such as perceived usefulness and perceived ease of use have a strong effect on MB acceptance. As a result, both of them can be considered as important determinants of MB acceptance [62, 63, 65-69].
6. CONCLUSION AND FUTURE WORK
3745 some elite banks customers’ in Jordan. In regard to the part of quality features as the antecedents of customers’ beliefs, this study revealed that system quality, information quality, and service quality have positive relations and significant effects on perceived usefulness and perceived ease of use of MB. This study investigated the relationships between customers’ beliefs with regard to their perceptions based on perceived usefulness, perceived ease of use, and behavioral intention to use. The results indicate that perceived usefulness and perceived ease of use have significant effects on behavioral intention to use MB applications. Also, the results indicate that perceived ease of use indirectly affects the behavioral intention to use MB applications through perceived usefulness. This study can help the vendors of MB applications to enhance the customers' acceptance of the new technologies in the future. This research provides crucial information about the influence of the key quality features which can reinforce customers’ perceptions with regard to their beliefs (PU and PEOU) in order to enhance customers’ behavioral intention to use MB applications. Moreover, this study confirmed the strength of the technology acceptance model (TAM) in predicting the acceptance of MB.
It’s important to mention that the selection of our sample of this study was limited to new elite banks customers’ in Jordan. Therefore, we are planning to expand our sample to cover more Jordanian banks customers based on different demographic characteristics, such as different age groups, educational level, and income level in order to improve the generalizability of the research results.
REFRENCES
[1] B. Ensor, T. Montez, and P. Wannemacher, “The state of mobile banking 2012,” Forrester Research Inc., Cambridge, 2012.
[2] A. Alalwan, Y. Dwivedi, N. Rana, B. Lal, and M. Williams, “Consumer adoption of Internet banking in Jordan: Examining the role of hedonic motivation, habit, self-efficacy and trust,” Journal of Financial Services Marketing, vol. 20, no. 2, pp. 145-157, 2015. [3] Y. K. A.-A. Migdadi, “The developing
economies’ banks branches operational strategy in the era of e-banking: the case of Jordan,” Journal of Emerging Technologies in Web Intelligence, vol. 4, no. 2, pp. 189-197, 2012.
[4] L. Wessels, and J. Drennan, “An investigation of consumer acceptance of M-banking,”
International Journal of bank marketing, vol. 28, no. 7, pp. 547-568, 2010.
[5] M. S. Awwad, and M. Y. Ghadi, “Investigation of factors influencing the intention to adopt mobile banking services in Jordan,” Dirasat: Administrative Sciences,
vol. 37, no. 2, pp. 545-556, 2010.
[6] M. Gharaibeh, and M. Arshad, “Current Status of Mobile Banking Services in Jordan,” World Applied Sciences Journal, vol. 34, no. 7, pp. 931-935, 2016.
[7] T. Zhou, Y. Lu, and B. Wang, “Integrating TTF and UTAUT to explain mobile banking user adoption,” Computers in Human Behavior vol. 26, no. 4, pp. 760-767, 2010. [8] H. J. Kim, I. Kim, and H. Lee, “Third-party
mobile app developers’ continued participation in platform-centric ecosystems: An empirical investigation of two different mechanisms,” International Journal of Information Management, vol. 36, no. 1, pp. 44-59, 2016.
[9] B. Ferris, J. Stahle, and I. Baggili, “Quantifying the Danger of Mobile Banking Applications on the Android Platform,” in 9th Annual Symposium on Information Assurance (ASIA’14), 2014, pp. 65-75.
[10] A. A. Shaikh, H. Karjaluoto, and N. B. Chinje, “Continuous mobile banking usage and relationship commitment–A multi-country assessment,” Journal of Financial Services Marketing, vol. 20, no. 3, pp. 208-219, 2015. [11] A. A. Shaikh, and H. Karjaluoto, “Mobile
banking adoption: A literature review,”
Telematics and Informatics, vol. 32, no. 1, pp. 129-142, 2015.
[12] S. O. Al-Shbiel, and M. A. Ahmad, “A Theoretical Discussion of Electronic Banking in Jordan by Integrating Technology Acceptance Model and Theory of Planned Behavior,” International Journal of Academic Research in Accounting, Finance and Management Sciences, vol. 6, no. 3, pp. 272-284, 2016.
3746 [14] M. Alksasbeh, “Integrating mobile technology
service quality, trust and cultural factors into technology acceptance of mobile learning,”
SCIENCE, INNOVATION NEW Technology,
vol. 1, no. 6, pp. 11-17, 2013.
[15] F. D. Davis, R. P. Bagozzi, and P. R. Warshaw, “User acceptance of computer technology: a comparison of two theoretical models,” Management science, vol. 35, no. 8, pp. 982-1003, 1989.
[16] M. Khasawneh, “A mobile banking adoption model in the Jordanian market: an integration of TAM with perceived risks and perceived benefits,” The Journal of Internet Banking and Commerce, vol. 2015, no. 3, pp. 1-35, 2015. [17] S. Yaseen, and S. Zayed, “Exploring critical
determinants in deploying mobile commerce technology,” American Journal of Applied Sciences, vol. 7, no. 1, pp. 120-132, 2010. [18] P. A. Pavlou, and O. A. El Sawy, “the ‘third
hand’: IT-enabled competitive advantage in turbulence through improvisational capabilities,” Information System Research, 21(3), pp. 443-71, vol. 21, no. 3, pp. 443-471, 2010.
[19] M. Al-Husein, and M. Sadi, “Preference on the Perception of Mobile Banking: A Saudi Arabian Perspective,” European Online Journal of Natural and Social Sciences, vol. 4, no. 1, pp. 161, 2015.
[20] S. Alturaigi, and A. Altameem, “CRITICAL SUCCESS FACTORS FOR MCommerce IN SAUDI ARABIA’S PRIVATE SECTOR: AMultiple CASE STUDY ANALYSIS,”
International Journal of Information Technology Convergence and Services IJITCS, vol. 5, no. 6, pp. 01-10, 2015.
[21] W. Delone, and E. McLean, “The DeLone and McLean model of information systems success: a ten-year update,” Journal of management information systems, vol. 19, no. 4, pp. 9-30, 2003.
[22] K. J. Trainor, A. Rapp, L. S. Beitelspacher, and N. Schillewaert, “Integrating information technology and marketing: An examination of the drivers and outcomes of e-Marketing capability,” Industrial Marketing Management, vol. 40, no. 1, pp. 162-174, 2011.
[23] V. Shankar, A. Venkatesh, C. Hofacker, and P. Naik, “Mobile marketing in the retailing environment: current insights and future research avenues,” Journal of interactive marketing, vol. 24, no. 2, pp. 111-120, 2010.
[24] F. D. Davis, “Perceived usefulness, perceived ease of use, and user acceptance of information technology,” MIS quarterly, pp. 319-340, 1989.
[25] S. Chauhan, “Acceptance of mobile money by poor citizens of India: integrating trust into the technology acceptance model,” info, vol. 17, no. 3, pp. 58-68, 2015.
[26] W. R. King, and J. He, “A meta-analysis of the technology acceptance model,”
Information & management, vol. 43, no. 6, pp. 740-755, 2006.
[27] B. Šumak, M. Heričko, Z. Budimac, and M. Pušnik, “Investigation of moderator factors in e-business adoption: A quantitative meta-analysis of moderating effects on the drivers of intention and behavior,” Computer Science and Information Systems, no. 00, pp. 33-33, 2016.
[28] B. Zogheib, A. Rabaa'I, B. Zogheib, and A. E. Saheli, “University students' acceptance of technology in math classes: does gender matter?,” Journal of Emerging Trends in Engineering and Applied Sciences, vol. 6, no. 4, pp. 273-287, 2015.
[29] M. J. Alsamydai, “Adaptation of the technology acceptance model (TAM) to the use of mobile banking services,” International Review of Management and Business Research, vol. 3, no. 4, pp. 2039, 2014.
[30] G. J. Udo, K. K. Bagchi, and P. J. Kirs, “An assessment of customers’e-service quality perception, satisfaction and intention,”
International Journal of Information Management, vol. 30, no. 6, pp. 481-492, 2010.
[31] C. Flavián, M. Guinalíu, and R. Gurrea, “The role played by perceived usability, satisfaction and consumer trust on website loyalty,”
Information & Management, vol. 43, no. 1, pp. 1-14, 2006.
[32] C. Liao, J.-L. Chen, and D. C. Yen, “Theory of planning behavior (TPB) and customer satisfaction in the continued use of e-service: An integrated model,” Computers in human behavior, vol. 23, no. 6, pp. 2804-2822, 2007. [33] C. Sohn, and S. K. Tadisina, “Development of
e-service quality measure for internet-based financial institutions,” Total Quality Management, vol. 19, no. 9, pp. 903-918, 2008.
3747
European Journal of Operational Research,
vol. 187, no. 3, pp. 1346-1357, 2008.
[35] J. Santos, “E-service quality: a model of virtual service quality dimensions,” Managing Service Quality: An International Journal,
vol. 13, no. 3, pp. 233-246, 2003.
[36] M. Fassnacht, and I. Koese, “Quality of electronic services conceptualizing and testing a hierarchical model,” Journal of service research, vol. 9, no. 1, pp. 19-37, 2006.
[37] S. Gounaris, S. Dimitriadis, and V. Stathakopoulos, “Antecedents of perceived quality in the context of Internet retail stores,”
Journal of Marketing Management, vol. 21, no. 7-8, pp. 669-700, 2005.
[38] C. Jang, “Measuring Electronic Government Procurement Success and Testing for the Moderating Effect of Computer Self-efficacy,” JDCTA, vol. 4, no. 3, pp. 224-232, 2010.
[39] Y. Wang, and Y. Liao, “Assessing eGovernment systems success: A validation of the DeLone and McLean model of information systems success,” Government Information Quarterly, vol. 25, no. 4, pp. 717-733, 2008.
[40] M. J. Eppler, and P. Muenzenmayer, “Measuring Information Quality in the Web Context: A Survey of State-of-the-Art Instruments and an Application Methodology,” Proceedings of 7th International Conference on Information Quality, pp. 187-196, 2002.
[41] S. Knight, and J. M. Burn, “Developing a framework for assessing information quality on the World Wide Web,” Informing Science: International Journal of an Emerging Transdiscipline, vol. 8, no. 5, pp. 159-172, 2005.
[42] S. I. Swaid, and R. T. Wigand, “Key dimensions of e-commerce service quality and its relationships to satisfaction and loyalty,”
20th Bled eConference eMergence: Merging and Emerging Technologies, Processes, and Institutions, pp. 414-428, 2007.
[43] M. J. Alsamydai, R. O. Yousif, and M. H. Al Khasawneh, “The Factors Influencing Consumers’ Satisfaction and Continuity to Deal with E-Banking Services in Jordan,”
Global Journal of Management And Business Research, vol. 12, no. 14, 2012.
[44] S. Ghosh, H. Surjadjaja, and J. Antony, “Optimisation of the determinants of e-service operations,” Business Process Management Journal, vol. 10, no. 6, pp. 616-635, 2004.
[45] Y. A. Saanen, A. Verbraeck, and H. G. Sol, “Snapshot of e-commerce's opportunities and threats,” Electronic Markets, vol. 9, no. 3, pp. 181-189, 1999.
[46] J. Reynolds, and R. Mofazali, The complete e-commerce book: design, build, and maintain a successful web-based business, New York: Cmp Books, 2000.
[47] J. Rowley, “An analysis of the e-service literature: towards a research agenda,”
Internet research, vol. 16, no. 3, pp. 339-359, 2006.
[48] A. H. Zaied, and F. Al-Khairalla, “Risk assessment for implementing e-services in some ministries in the State of Kuwait,” Arab Gulf Journal of Scientific Research, vol. 25, no. 3, pp. 138, 2007.
[49] J. E. Collier, and C. C. Bienstock, “Measuring service quality in e-retailing,” Journal of service research, vol. 8, no. 3, pp. 260-275, 2006.
[50] R. Connolly, and F. Bannister, “eTax Filing & Service Quality: The case of the revenue online service,” Proceedings of World Academy of Science, Engineering and Technology, vol. 28, pp. 313-317, 2008.
[51] S. Croom, and R. Johnston, “E-service: enhancing internal customer service through e-procurement,” International Journal of Service Industry Management, vol. 14, no. 5, pp. 539-555, 2003.
[52] Z. Yang, and X. Fang, “Online service quality dimensions and their relationships with satisfaction: A content analysis of customer reviews of securities brokerage services,”
International Journal of Service Industry Management, vol. 15, no. 3, pp. 302-326, 2004.
[53] R. W. Brislin, “Back-translation for cross-cultural research,” Journal of cross-cultural psychology, vol. 1, no. 3, pp. 185-216, 1970. [54] R. Y. Cavana, B. L. Delahaye, and U.
Sekaran, Applied business research: Qualitative and quantitative methods: John Wiley & Sons Australia, 2001.
[55] J. F. Hair, W. C. Black, B. J. Babin, R. E. Anderson, and R. L. Tatham, “Multivariate data analysis 6th Edition,” Pearson Prentice Hall. New Jersey. humans: Critique and reformulation. Journal of Abnormal Psychology, vol. 87, pp. 49-74, 2006.
3748 [57] D. Campbell, and D. Fiske, “Convergent and
discriminant validation by the multitrait-multimethods matrix,” Personality, vol. 56, pp. 162, 1998.
[58] A. Field, Discovering statistics using IBM SPSS statistics: Thousand Oaks: Sage Publications, 2013.
[59] N. Bontis, “Intellectual capital: an exploratory study that develops measures and models,”
Management decision, vol. 36, no. 2, pp. 63-76, 1998.
[60] A. E. Asmah, “Factors that Affect Banks’ Acceptance of Electronic Cheque Clearing System: Evidence from Ghana,” University of Ghana, 2015.
[61] M. K. Ozlen, and I. Djedovic, “Online banking acceptance: The influence of perceived system security on perceived system quality,” Journal of Accounting and Management Information Systems, vol. 16, no. 1, pp. 164-178, 2017.
[62] F. H. Chandio, “Evaluating User Acceptance of Online Banking Information Systems: An Empirical Case of Pakistan,” Brunel University West London, 2011.
[63] J. LIN, S. XIAO, Y. CAO, and Y. Yang, “Predicting and explaining the adoption of mobile banking,” in Proceedings of the Annual Conference of China Institute of Communications, 2010, pp. 421-424.
[64] A. Khurshid, M. Rizwan, and E. Tasneem, “Factors contributing towards adoption of E-banking in Pakistan,” International Journal of Accounting and Financial Reporting, vol. 4, no. 2, pp. 437, 2014.
[65] N. Jayasiri, K. D. Gunawardana, and P. Dharmadasa, “Adoption of Internet Banking in Sri Lanka: An Extension to Technology Acceptance Model,” in First Asia Pacific Conference on Contemporary Research, 2015, pp. 167-177.
[66] V. S. Lai, and H. Li, “Technology acceptance model for internet banking: an invariance analysis,” Information & management, vol. 42, no. 2, pp. 373-386, 2005.
[67] S. K. Chitungo, and S. Munongo, “Extending the technology acceptance model to mobile banking adoption in rural Zimbabwe,” Journal of Business Administration and Education,
vol. 3, no. 1, pp. 51, 2013.
[68] M. Aboelmaged, and T. R. Gebba, “Mobile banking adoption: an examination of technology acceptance model and theory of planned behavior,” International Journal of
Business Research and Development (IJBRD),
vol. 2, no. 1, 2013.
![Figure 1: Original Technology Acceptance Model [24]](https://thumb-us.123doks.com/thumbv2/123dok_us/8906268.956982/2.612.90.531.534.723/figure-original-technology-acceptance-model.webp)