7272
INTEGRATING REAL-TIME DATA WITH WEB DATA
FOR EFFICIENT ENERGY HARVESTING SYSTEMS
1YOUNGKYOUNG KOO, 2SANGSOO PARK
1, 2 Dept. of Computer Science & Engineering, Ewha Womans University, Seoul 03760, South Korea
E-mail: 1[email protected], 2[email protected]
ABSTRACT
Since eco-friendly green energy is currently being emphasized, multi-source energy harvesting technology attracts great attention not only to industry but also academia. In this paper, we propose a novel approach for integrating real-time and web data for efficient energy harvesting systems. The real-time and web data integration occurs on an intelligent cloud system to minimize the load on the harvesting device. The real-time data are extracted and corrected in case of errors; specifically, error correction is performed by identifying outliers based on the average slope of data. Furthermore, the erroneous data are smoothed through the modified moving average filter. Additionally, web data are acquired from official centers and trimmed based on the location and time of measurement. After the processing, all of these data are integrated using a weighted average. The validity of the data integration is evaluated by comparing correlation coefficients for the original and integrated sets of data. In addition, an advanced design of efficient energy harvesting prototype is introduced and implemented. We expect that integrating data reflects the overall trend of ambient circumstances for efficient energy harvesting systems.
Keywords: Energy Harvesting, Data Integration
1. INTRODUCTION
Energy harvesting, which utilizes naturally-occurring energy from the ambient environment, is emerging as one of the most promising green energy suppliers to alleviate the limitation of energy usage of embedded devices [1]. Because the technique absorbs surrounding energy, it has become popular for overcoming the traditional constraints of a battery-powered system, i.e. limited battery capacity. Thus, using harvested energy ultimately prolongs battery lifetime of an energy harvesting embedded system.
However, the amount of producible energy can situationally differ owing to the sensitivity of the harvesting system [2]. Despite its unpredictability, continuous monitoring of surrounding environment can achieve maintaining high energy efficiency of the system. In other words, examining the neighboring changes possibly identifies the
environmental conditions. Thus, adjacent
information about unexpected circumstances and trends can be extracted. However, the measurement of real-time data might contain errors due to hardware sensing or data transfer limitations. On the other hand, since web data, which is mathematically calculated with scientific evidence, are reliable and available. The only weakness of the
data is that they are too ideal to be used in real situations.
This paper proposes a new approach for integrating real-time data with web data for efficient energy harvesting systems. To combine both forms of data, each data requires several steps. As real-time data are extracted from the neighboring environment, inevitable errors should be corrected. In contrast, web data are collected in the intelligent cloud system. Before storing, data trimming should be conducted simultaneously. After proper processing of each data, data integration occurs using both prepared data. The entire data integration process happens outside of the system in order to increase efficiency considering power constrained situations. Finally, the integrated data will be utilized to design optimized performance of efficient energy harvesting systems.
7273 The remainder of the paper is organized as follows. In Section 2, several related works are introduced with plausible references. The general flow of data integration process and advanced design of energy harvesting prototype is described in Sections 3 and 4, respectively. A motivating experiment to verify data integration and actual implementation of a preliminary prototype are shown in Section 5. Finally, Section 6 presents last conclusions.
2. RELATED WORKS
2.1 Integration of Big Diverse Data
It is important to handle massive and diverse data; particularly, dealing with the Internet of things (IoT) and real-time sensor data is very demanding owing to both the amount and diversity of data. It is one of the key challenges that people face when treating data. Even though enough data exist, they can be meaningless without processing or analyzing. That is why proper initial interpretation or further integration is significant [3].
Integration is not a simple summation of total data; it is a process of excavating new features by combining multiple sets of data. Thus, for relevant data integration, a structured model for combining data should be declared. In the case of a power system, integrating data includes acquiring, extracting, consolidating, and analyzing [4]. Furthermore, numerous studies have been conducted for efficient data integration on a system level. In the process of open-sourced IoT ecosystem development, data should be integrated for layering modules [5]. Especially, integrated sensor data and geographic information from various sources have recently been utilized for emergency situations [6].
2.2 Influence of Ambient Data
Since the universal importance of data and data integration are cited previously, a specific influence of real-time data from energy harvesting system is introduced. Harvesting energy from surroundings cannot help depending on surrounding area, obviously. Therefore, examining nearby data is one of the best solutions for improving the productivity of energy extraction. For the whole investigation,
various information should be essentially
considered, then, listed below:
Ambient temperature data of the system heavily influence not only efficiency but output product. Therefore, various constraint conditions which
affect yield potential of harvesting systems should be taken into consideration. One of the most typical constraints is the temperature coefficient. It refers to a measurable rate of underperforming by the increase of surrounding temperature. Most photovoltaic power harvesters have a coefficient of temperature between -0.2% / °C to -0.5%/°C, and each has the different rate. Measured close to zero, the part performs better as the temperature rises. Moreover, as the temperature itself of harvester increases, the amount of producible power decreases. The reason why it becomes is that the temperature of producing section affects directly to harvesting efficiency [7].
Ambient energy cannot be fully extracted from the environment owing to several interferences around the harvesting system. In case of photovoltaic energy, harvesting the whole energy from the sun may be intervened by scientific phenomena, such as reflection and absorption. The quantity of water vapor is one of the main factors which makes those situations, therefore, it can be measured as a form of humidity data. Regarding some works, an increase of humidity results in a decrease of voltage and current from a harvester [8]. It inferred that the overall harvesting efficiency can be reduced.
If the energy harvesting system is situated in a specific position without location change, the intensity of illuminance is obviously significant. Especially, it should be tracked in contradistinction to a radical change of nearby environment. Besides, longitude and latitude of the system or bearings of harvesters are indispensably concerned.
Because energy harvesting system is highly
dependent on neighboring circumstances,
harvesting efficiency is under the control of ambient data. Consequently, a novel efficient approach regarding the influence of real-time data should be demanded.
2.3 Intelligence of Energy Harvesting System
7274 First of all, ‘Intelligence on embedded device’ refers to an embedded device that considers measurement and usage of energy. This type of intelligence requires only one microprocessor for the entire system. Which means the complexity and the cost of the system can be extremely reduced. However, the embedded device needs to not only control the system but also manage all energy resources itself.
Next, energy can be maintained by small energy harvesters, also known as power units. In ‘Intelligence on power units’, every power unit is separate from the embedded device, so communication should be established between them. The interfacing complexity is reduced compared to the interface between an embedded device and energy hardware. The main strength of this intelligence is that the microprocessor can focus on computation without considering energy hardware or harvesters.
The last and most advanced type of -intelligence is ‘Intelligence on energy devices’. Power conditioning circuitry is owned by each energy device, and a separate microcontroller only monitors the situation. It allows any model to be applied to the energy device regardless of the complexity of the model.
In this paper, a different standard of energy harvesting is proposed: ‘Intelligence on cloud’. Like the most developed type of intelligence, it requires an extra component: a cloud computing system. As the name implies, an external cloud system supports estimating and examining energy status like an energy device, but on the cloud. It separates the power-consuming section to be outside of the system for minimum energy usage.
3. REAL-TIME AND WEB DATA
INTEGRATION
The unstable and insufficient amount of energy extracted by the energy harvesting system has been considered as the main constraint of the system. Thus, it is almost impossible to measure in advance how much and when the electrical energy can be generated. In this situation, scientifically forecasted or analyzed online data (e.g., meteorological information and geographical data) are believed to positively resolve the ambiguity of the system. The only limitation of the ideal data is that they cannot perfectly identify the local environmental situation for a particular period of a moment. Hence, it is impracticable for the data to be applied alone. Meanwhile, practically obtained real-time data are
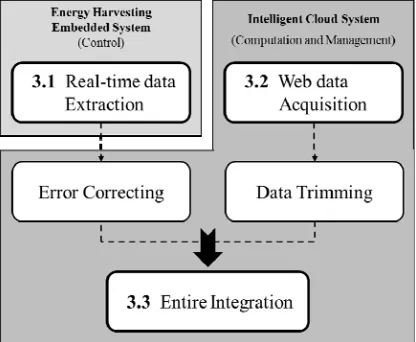
[image:3.612.314.522.232.403.2]dependent on the specific location and the entire flow of the adjacent environment. Consequently, integrating both types of data makes it possible to predict the relatively complete circumstance of a specific energy harvesting system. The overall flow of the real-time and web data integration is shown Figure 1. As the figure implies, only real-time data extraction stage occurred on energy harvesting embedded device. All other stages place at intelligent cloud system.
Figure 1: General Flow of Entire Data Integration
3.1 Real-time Data Extraction
As previously mentioned, continuous monitoring of the adjacent environment is essential for the higher efficiency of an energy harvesting system. The principal control system was constructed from a compatible board of Arduino UNO. It is one of the most popular microcontroller based on an open-source software and hardware platform. Among the Arduino family, UNO is widely used because of its stability and great performance [10]. Besides, its
main advantages, such as convenience,
extendibility, and reasonable cost, make it applicable to many electronics projects, particularly sensor-based systems. In this paper, a target energy harvesting system was equipped with OrangeBoard Wifi, which combines compatibility with UNO and capability of Wifi. From the system, composite temperature and humidity sensor and CDS photoresistor measure the surrounding environment and extract environmental data with an acceptable level of error.
7275
3.2 Web Data Acquisition
There are innumerable web data on the internet. In this paper, meteorological weather information and geographical location data are utilized for integration. Several requests are performed for data acquisition and received data are stored on the intelligent cloud system.
To obtain suitable data, accessing to reliable websites, such as national or official weather centers or private sources, is necessary. Especially, as geographic data can include some locally sensitive data, the securement should be made from authorized web pages such as a national
geographical information institution:
http://www.ngii.go.kr/. Because weather data can be collected unrestrictedly, on the other hand, they were acquired from national organization: http://weather.go.kr or international forecasting page: http://openweathermap.org. For the simplest preprocessing, the preferred result format is JavaScript Object Notation (JSON). Those available data should be adopted regarding each specific structure of the data. Above all, web data should be acquired in the same period as real-time data for further integration.
3.3 Entire Data Integration
The intelligent cloud system supports the computation of each data. It is established using an Apache HTTP server along with a MySQL database. Therefore, both real-time and web data can be respectively received and stored in the cloud server. After those processes of data collection, several modifications should be conducted regarding the characteristics of the data.
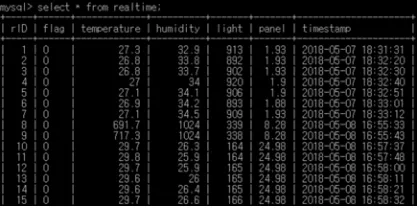
[image:4.612.90.300.514.621.2]Figure 2: An Example of Measured Raw Data Real-time data indicate surrounding changes
owing to constantly measured nearby
circumstances. For example, as shown in Figure 2, the raw ID (rID) 8 and 9 unexpectedly appeared
during consecutive measuring environment.
Therefore, hardware limitations may cause several errors, that are sometimes physically impossible values such as 691.7 °C in temperature or 1024% in
humidity. Therefore, the stage of error correction must be performed to eliminate unexpected flawed values.
First, the errorless range and defective range of the dataset should be defined. Considering the instability of real-time data, it can be assumed that persistent data are stable and comparably reliable. Hence, the errorless range of the data should be continued without any interruption. Continuity of data is identified based on the slope between two points. In the following, several definitions and statements are given for helping more deep understanding to distinguish the defective range from the errorless range.
There is a given real-time dataset D = {d1,d2,…,
dn}, where n = |D|. Let L be the set of errorless
range of data, such that |L| < n and L⊆D.
Additionally, let E be the set of defective range of
data, such that |E| < n and E ⊆ D.
A definition of mi is given in equation (1), which
infers the slope of two data points di and di+1. Then,
the average of slopes a is calculated by equation (2).
mi = ∆(di ,di+1) = di -di+1
(1 ≤ i < i+1 ≤ n) (1)
a = 𝑛 11 ∑𝑛 1𝑖 1 𝑚𝑖 (2)
With the defined terms above, an errorless point and a defective point can be identified below: One data point dx is errorless where mx-1 < a, on
the other hand, the other data point dy is defective,
i.e. an error, when my-1 ≥ a.
There is an errorless range L = {di∪…∪ dj | data points between di and dj are errorless, di-1 and dj+1 are defective, 1 < i-1 < i ≤ j < j+1 < n}. Also
defective range is determined as; E = {di∪…∪ dj |
data points di and dj are defective, 1 < i ≤ j < n}. On the defective error range, additional technique is used for overall error correction.
7276 the length is long enough to be the defective range, MMAF is lightly applied. In contrast, MMAF has a strong effect when the length of the erroneous data is small. It can be simply summarized as following Figure 3. In addition, constant C is a criterion for MMAF application.
Function MMAF(Defective set:E, data point:di)
1 BEGIN
2 If di in E
3 BEGIN
4 Then Return MAF(e-C, di);
5 Else Return di;
6 END
7 END
Figure 3: Algorithm of Modified Moving Average Filter Because web data is fully calculated by prediction of previous data, they are reliable enough to not be corrected. However, the scope of the web data should be constrained to the specific location or time-this is called data trimming for web data. Spatial and temporal restriction can be set depending on the place and time where the real-time measurement occurred.
Finally, entire integration between corrected real-time data and trimmed web data should be performed. A simple equation for combination with weight coefficients α and β is used in equation (3).
xi=(αdi+βwi)/(α+β)=
α α βdi +
β
α βwi (3)
4. DESIGN AND IMPLEMENTATION OF
EFFICIENT ENERGY HARVESTING
SYSTEM
The initial design of efficient energy harvesting framework was suggested in our prior study: “Multi-Source Energy Harvesting Framework Design with Integrated Data Analysis” [12]. The system consisted of an embedded energy harvesting embedded system, which controls all the hardware, and an intelligent cloud system for computation and management. Previously mentioned, therefore, the intelligence of the system is on the cloud computing system; most data processing is performed externally.
Adopting the proposed real-time and web data integration on an energy harvesting system is the solution for improving the harvesting efficiency. The entire data integration enables the intelligent system to predict the method to produce more energy from harvesters. Therefore, regular sensing
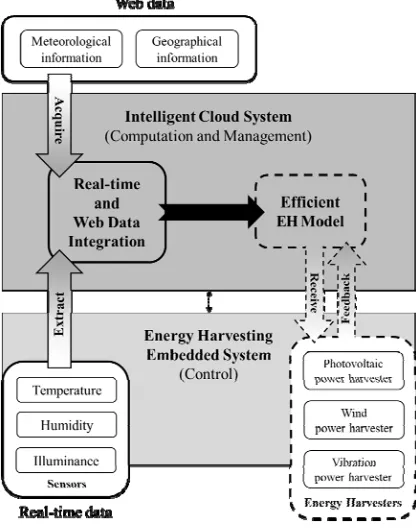
[image:5.612.313.521.319.583.2]affords enough data to the cloud system for the efficient harvesting model on the specific period of time. An efficient energy model is derived after data integration process, inferred as the predicted method to operate system most efficiently. It is regularly calculated to reflect the local circumstance of the location and to evaluate the harvesting efficiency of the system. Then, the model is sent from the cloud system and received by the controlling embedded system. The system transmits several signals to each energy harvesters for effective performance. Thus, the harvesting efficiency of the whole entire energy harvesting system can increase dynamically. Figure 4 depicts the proposed design of the energy harvesting embedded system, the intelligent cloud system, and lastly sensing and harvesting sections in detail.
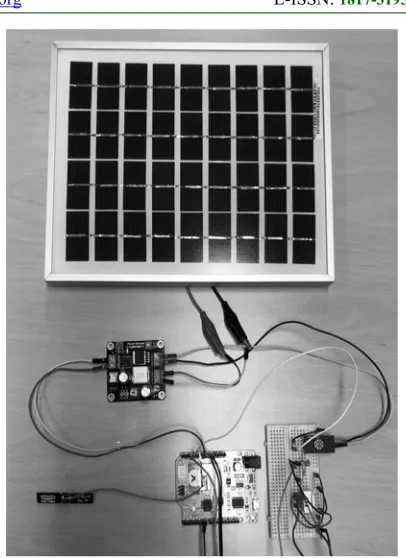
Figure 4: Efficient Energy Harvesting System Design Based on the design, for experiments, a preliminary prototype of efficient energy harvesting system is implemented. The basic schematic of the prototype is described in Figure 5 and the real implementation is in Figure 6 below.
7277 results from the fact that it produces the largest amount of energy compared to other harvesters.
Figure 5: Schematic of Energy Harvesting Prototype Since the fame of Arduino UNO was mentioned above, the prototype is constructed by compatible
OrangeBoard Wifi. ATmega328P is the
microcontroller of the device, same as UNO, and it operates on the input voltage of 7 to 12V. One of the most distinguishable properties of the device is WiFi capability. Embedding in WizFi250 module for wireless communication, it enables the device to be connected to the web environment [13].
For energy extraction, proper specification of photovoltaic panel is required. The amount of harvestable energy from harvester is enough to operate a single harvesting system. Maximum power output is 5W with maximum power voltage 18V and maximum power current 0.277A [14]. There are two sensors in sensing section. One is a temperature and humidity sensor named DHT22, also known as AM2303. It assures its reliability and stability with a high accuracy of temperature and
humidity ±0.5 °C and ±2% RH, respectively [15].
The other sensor is a CDS photoresistor, light-dependent resistor. The resistance of the sensor decreases as the intensity of light increases. Therefore, the lower illuminance of environment represents the higher measured data [16].
Figure 6: Real Implementation of Prototype
5. EXPERIMENT AND EVALUATION
5.1 Experiment and Evaluation for Data Integration Verification
This section introduces experimental results and evaluation of the motivating example. This experimental system is a pre-constructed version of the prototype to test the data integration. For that reason, it only contains the main embedded system of Arduino UNO, the intelligent cloud system, and real-time data extracting and web data acquiring sections. The essential task of the system is verification of data integration. It is conducted with the same flow mentioned in Figure 1. Both sets of data were gathered every 10 seconds from 4 PM to 6 PM on December 6th, 2017.
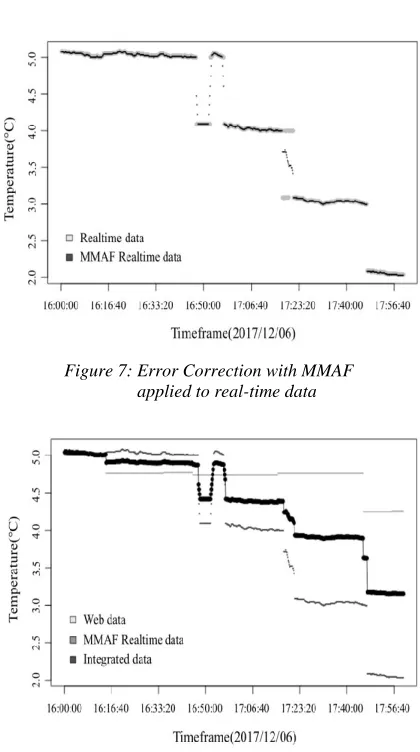
[image:6.612.90.301.110.396.2]7278 Figure 7: Error Correction with MMAF
applied to real-time data
Figure 8: Entire Integration of Web and Real-time Data
For MMAF usage, criterion C should be fixed. In this motivating experiment, it was set to the number of data that were believed to be trustworthy. As a result, some regions were determined to be defective, and MMAF was singly applied to each range of the dataset. For example, the first error range, occurring around 4:50 PM, is quite longer than the other ranges. Thus, only a portion of the range was reassigned. In contrast, there was a sparse defective range around 5:20 PM; therefore, comparatively numerous data were affected. Many real-time data at that time were replaced with new values near 3.5°C.
With the modified real-time data, data integration was performed. As shown in Figure 8, the web data are too high compared to the real-time data because they were calculated from previous web data. Despite their idealities, data integration is essential; thus, final data combination should proceed. Similarly, coefficients α and β should be decided for the entire data integration. Although it
is obvious that the web data is not accurate, both α and β were set to 1, which means equal weighting was applied. Therefore, the integrated data are the average of both datasets.
To prove the validity of the integrated data, the correlation coefficients of the two variables, i.e., timeframe and temperature, were analyzed. The Pearson correlation coefficient is universally utilized for statistical analysis to identify the correlation, i.e. the relationship between two variables. Similarly, the Spearman correlation is an analytical method for investigating the hidden relationship between variables as well. The singularity of Spearman is that the correlation coefficient is computed using the order of the data, not a value. Hence, the results of both methods, i.e. correlation coefficients, are values between -1.00 and 1.00. In addition, the magnitude of the correlation coefficient depends on the strength of the correlation. Moreover, a positive coefficient
indicates that the two variables grow
simultaneously, whereas a negative coefficient implies that one variable increases when the other decreases, and vice versa.
[image:7.612.316.521.556.697.2]Figure 9 shows the Pearson and Spearman correlation coefficients based on the final data integration. The correlation coefficients of web data are distinguishably weaker than the other data. In contrast, the raw real-time data are very dependent on the relationship between time frame and temperature. Furthermore, employing MMAF increases the magnitude of both coefficients. Most of all, the magnitudes of the correlation coefficients for the integrated data are the highest for each correlation method. Consequently, the Pearson and Spearman correlation coefficients confirm the relevance of integrating real-time data with web data.
7279
5.2 Experiment and Evaluation on Prototype
With the specifications mentioned in Section 4, the energy harvesting prototype is established. Above all, the effect of illuminance on energy harvesting system should be examined. Which means as light is one of the most powerful constraints of harvesting efficiency, a preliminary experiment about light intensity on the proposed prototype should take place for deep understanding. Therefore, the relationship between normalized
illuminance and the harvested voltage
experimented. One CDS photoresistor measured the light intensity and two voltage sensors were used to estimate the voltage of panel and system, respectively. The additional regulator was used to adjusting the amount of light from 200V 200W incandescent bulb.
The results are shown in Figure 10. As time went on, the illuminance gradually increased to the
[image:8.612.101.516.326.492.2]middle of the experiment and then decreased. At the same time, the harvested output estimated as voltage similarly rose and dropped. Though the increases and decreases were not symmetrically presented, variation range was assumed to be affordable. Therefore, two graphs of illuminance and panel voltage were vertically mirrored, as shown above. By the way, the voltage of system kept its value to 5V even though the voltage of panel was much higher. It resulted from the step-down converter or DC-DC converter, that converts the voltage to be low [17]. The hardware was equipped with the prototype owing to the stable management of the system. Consequently, the operation of energy harvesting prototype was guaranteed by the illuminance under 768 or 804 according to the experimental result.
Figure 10: Relationship between Normalized Illuminance and Harvested Voltage (Laboratory environment)
[image:8.612.98.519.522.697.2]7280 The previous experiment was conducted in the laboratory environment, which was too ideal for real application. Therefore, an identification of actual circumstances was needed. For testing, the proposed energy harvesting prototype was located in 37° 33’ 59’’ N, 126° 56’ 53’’ E, toward 241° Southwest, and 80m elevated from the ground. A Measurement period of the experimentation was from 2 PM to 6 PM on May 9th, 2018.
The ideal experiment assumed that incoming harvested output fully contributes to operating the system. So, if the voltage of panel is over 5V, it can result in the steady input voltage to the system. Although there were numerous experimental attempts to measure the precise voltage, however, the real panel voltage under 25V brought the entire energy harvesting prototype being frozen. As shown in Figure 11, the system stopped working and the WiFi connection was lost.
To resolve this situation, several erroneous situations were inspected. One of the most possible reasons was guessed that the power consumption of WiFi connection might be high, so cause outrageous loss of power. Or sustained harvesting incurred the rise of panel temperature, the system was unexpectedly terminated. If system voltage of the experiment was supposed as above, the system could not help operating after a specific moment. Revealing the original cause of the situation should be processed in future works.
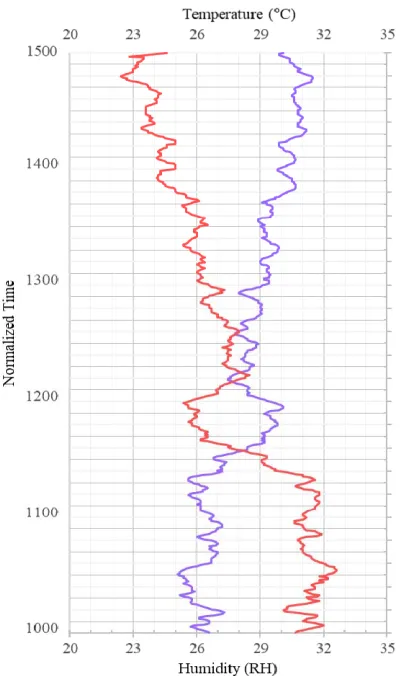
Further, relative humidity data will be considered to build the availability of energy harvesting prototype as well. They depend on temperature data that also affects solar panel efficiency [18]. As shown in Figure 12, as the rise of relative humidity is affected by the drop of temperature, that is in inverse proportion.
6. CONCLUSION
[image:9.612.319.519.94.432.2]In this paper, a novel approach for integrating real-time and web data for efficient energy harvesting was proposed. Regarding real-time data, extraction every specific period is the main consideration. Additionally, web data acquisition is performed on the same period of time. These data were ultimately integrated inside of the intelligent cloud system, after proper processing. Error correction is for real-time data and arrangement or trimming data for web data. Since the data integration is the initial stage of the entire efficient harvesting system, it is expected to be a great help in optimizing the energy efficiency.
Figure 12: An Example of Real-time Humidity Measurement Data Compared with Scaled Temperature
In addition, a preliminary energy harvesting prototype is explained and finally implemented. A photovoltaic harvester is the main source of harvesting, and various additional sensors and hardware are utilized for effective help. In the prototype, the intelligent cloud system performs calculations and analysis to minimize demand and optimize the efficiency of the harvesting embedded system. In conclusion, a final efficient energy harvesting models resulting from the process of data integration will be employed in multiple energy harvesting systems. In addition, various analysis of real-time data should be conducted. There existed unexpected situations during the experimentation, verification and resolution of the cause are the major musts in the next future work.
ACKNOWLEDGMENTS:
7281 Energy Harvesting Framework Design with Integrated Data Analysis”, International Workshop
on Convergence Information Technology
(IWCIT’17), Busan, 2017, pp.69-72.
This work was supported by the National Research Foundation of Korea funded by the Korean
Government (NRF-2017R1D1A1B03030393).
Sangsoo Park is the corresponding author.
REFRENCES:
[1]A. M. Siddiqui, L. Musavian, and Q. Ni, “Energy
efficiency optimization with energy harvesting
using harvest-use approach”, Proceedings of the
International Conference on Communication
Workshop (ICCW), IEEE (United Kingdom),
June 8-12, 2015, pp. 1982-1987.
[2] R. Jia, J. Zhang, P. Liu, X. Gan, and X. Wang, “Data Backlog Analysis in Energy Harvesting
Communication Systems”, The IEEE Access
Journal, Vol.5, 2017, pp. 5702-5712.
[3] M. K. Patra, “An Architecture Model for Smart
City Using Cognitive Internet of
Things(CIoT)”, Proceedings of the
International Conference on Electrical, Computer and Communication Technologies
(ICECCT),IEEE (India), February 22-24, 2017,
pp. 1-6.
[4] D. Liu. L. Ma, X. Liu, H. Yu, H. Tan, X. Zhao, Y. Zhao, and G. Lv, “Research on key issues of data integration technology in electric power
system in big data environment”, Proceedings
of the International Conference on Communication Software and Networks
(ICCSN), IEEE (China), May 6-8, 2017, pp.
1368-1372.
[5] A.-L. Kor, M. Yanovsky, C. Pattinson, and V. Kharchenko, “SMART-ITEM: IoT-enabled
smart living”, Proceedings of the Future
Technologies Conference (FTC), IEEE (USA),
Decenber 6-7, 2016, pp. 739-749.
[6] D. Fontes, C. Fonte, and A. Cardoso, “Integration of VGI and sensor data in a Web GISbased platform to support emergency
response”, Proceedings of the Experiment@
International Conference, IEEE (Portugal),
June 6-8, 2017, pp. 214-219.
[7] SOLAR CALCULATOR, The effect of
temperature on solar panel performance,
https://solarcalculator.com.au/solar-panel-temperature/, 10/05/2018.
[8] M.K. Panjwani, G.B. Narejo, “Effect of humidity on the efficiency of solar cell (photovoltaic)”,
Proceedings of the International Journal of
Engineering Research and General Science,
2014, pp. 499-503.
[9] A. S. Weddell, M. Magno, G. V. Merrett, D. Brunelli, B. M. Al-Hashimi, and L. Benini, “A survey of multi-source energy harvesting
systems”, Proceedings of the Conference on
Design, Automation and Test in Europe (DATE),
IEEE (France), March 18-22, 2013, pp. 905-908. [10] T. Kaur, J. Gambhir and S. Kumar, “Arduino
based solar powered battery charging system for
rural SHS”, Proceedings of the India
International Conference on Power Electronics
(IICPE), IEEE (Patiala), December 5-7, 2016,
pp. 1-5.
[11] Gaussianwaves.com, Moving Average Filter
(MA filter),
https://www.gaussianwaves.com/2010/11/movi ng-average-filter-ma-filter-2/, 10/05/2018. [12] Y. Koo, S. Park, “Multi-Source Energy
Harvesting Framework Design with Integrated
Data Analysis”, Proceedings of the
International Workshop on Convergence
Information Technology (IWCIT), Korea,
December 21-23, 2017, pp. 69-72.
[13] KOKOAFAB, Products of Kokoafab:
OrangeBoard WiFi,
https://kocoafab.cc/product/orangewifi, 10/05/2018.
[14] ECO-WORTHY, Polycrystalline Solar Panel,
http://eco-worthy.com/download/productspecification/pol ysolarpanel.pdf, 10/05/2018.
[15] AKIZUKI DENSHI TSUSHO CO.,
Temperature and humidity module: AM2302
Product Manual,
https://akizukidenshi.com/download/ds/aosong/ AM2302.pdf, 10/05/2018.
[16] ADAFURIT, Photo cell (CdS photoresistor),
https://www.adafruit.com/product/161, 10/05/2018.
[17] DFROBOT, DC-DC Power Module 25W,
https://www.dfrobot.com/product-752.html, 10/05/2018.
[18] A. Dajuma, S. Yahaya, S. Touré, A. Diedhiou, R. Adamou, A. Konaré, M. Sido, and M. Golba, “Sensitivity of Solar Photovoltaic Panel Efficiency to Weather and Dust over West Africa: Comparative Experimental Study between Niamey (Niger) and Abidjan (Côte
d’Ivoire)”, The Computational Water, Energy,
and Environmental Engineering, Vol.5, No.4,