http://dx.doi.org/10.4236/ajac.2014.59065
Forward-Light-Scattering Characterization
of Pre-Crystalline Aggregates in
Crystallizing Lysozyme Solutions
Takashi Wakamatsu
Department of Electrical and Electronic System Engineering, Ibaraki National College of Technology, Ibaraki, Japan
Email: [email protected]
Received 25 April 2014; revised 28 May 2014; accepted 15 June 2014
Copyright © 2014 by author and Scientific Research Publishing Inc.
This work is licensed under the Creative Commons Attribution International License (CC BY). http://creativecommons.org/licenses/by/4.0/
Abstract
We present a method to characterize lysozyme pre-crystalline aggregates using a forward-light- scattering technique, which is highly sensitive to protein aggregates. The static light scattering properties at small angles of crystallizing lysozyme aggregates are discussed, and related to the crystallization conditions based on the concentration of added precipitant NaCl. Lysozyme solu-tions that started to crystallize because of precipitant exhibited profiles of forward light scattering that could be fitted by non-integer power laws, which indicated fractal aggregations of lysozyme had formed. Pre-crystalline solutions, in which lysozyme crystals later grew, had dense structural fractal clusters with fractal dimensions of D > 1.5. In contrast, solutions with aggregates in which crystals did not grow, had forward-light-scattering profiles that deviated from a power law or had lower power values.
Keywords
Protein Crystallization, Lysozyme, Light Scattering, Fractal Aggregation, Power Law
1. Introduction
from the liquid-liquid phase separation have been observed, and lysozyme crystals have grown in these solutions [4]. However, an occurrence mechanism of the metastable liquid-liquid phase separation for protein crystalliza-tion is not well understood in detail. There are few methods for evaluating crystallizing protein solucrystalliza-tions, and as such, details of the protein crystallization process remain unknown.
Formation of protein clusters 100 nm - 1 μm in size that remain in solution is an important pre-crystalline process [6] [7]. Light scattering techniques, particularly dynamic light scattering (DLS), has frequently been used to characterize protein aggregates [7]-[12]. DLS and static light scattering (SLS) studies demonstrated by Georgalis et al. have revealed that lysozymes form fractal cluster aggregates before crystallizing [13] [14]. Sim-ilar aggregations of lysozymes have been studied by Tanaka et al., using DLS techniques [7] [15]. However, the relationship between the protein crystallization and the fractal aggregation has been overlooked. Establishing a protein crystallization screening method requires distinguishing formations of aggregates (clusters) that have the potential to grow into crystal nuclei from those that do not.
SLS patterns for fractal aggregates exhibit a power law of the scattering wave vector q: where the scattering intensity, Is
( )
q ∝q–α(
α
>0)
[16]-[19]. The q is given by 2k n0 sin(
θ 2)
, where n is the refractive index of the sample solvent, and θ is the original scattering angle of the sample solution. The power value α from the eq-uation is equal to the fractal dimension D of the scattering aggregates, which gives an interior parameter of the fractal aggregates [16]. This means that a structure factor S(q) of the aggregates can also be expressed as the power law [16] [17] of S q( )
∝q–D. Observation can be made of the power-law SLS patterns in the range of 1 RG q 1 a, where RG is the average gyration radius of aggregates and a is the size of the minimum scat-tering unit, such as a monomer or an oligomer [16] [17]. From the power-law formula Is( )
q ∝q–α, small qvalues offer larger scattering intensities in the SLS measurements, such that SLS sensitivity to protein aggrega-tion increases at small scattering angles.
Previous work [20] [21] has shown that forward static light scattering (F-SLS) at small angles (typically θs < 8˚) is highly sensitive to protein aggregates in crystallizing solutions. Small-angle F-LS measurements can cha-racterize protein aggregation directly. In this work, we evaluate lysozyme aggregation in pre-crystalline solu-tions using a fitting analysis of F-SLS profiles, and discuss the relasolu-tionship between the fractal aggregation and the crystallization conditions based on the concentration of an added precipitant, NaCl.
2. Experimental
2.1. Sample Preparations and Sample Cells for Measurements
Hen egg-white lysozyme (HEWL; Seikagaku, six times recrystallized) was used also for this study without fur-ther purification [20] [21]. Solutions of HEWL [90 mg/ml (6.3 mM)] and NaCl [15% (w/v) (2.56 M)] in a so-dium acetate buffer (50 mM, pH = 4.6 ± 0.1), and the buffer were prepared separately as stock solutions. The solutions were passed through a filter with 0.2-μm pore. Just before FLS measurements, these solutions were mixed at the appropriate rate in a micro test tube (1.5 ml) at 20 ± 0.5˚C. A sample (~18 μl) for the FLS mea-surements was taken immediately from the test tube and injected into the sample cell.
The sample cell was composed of two microscope cover glass plates (BK-7, 18 mm × 32 mm, and 0.15 mm thick) and a silicon rubber sheet (~1.0 mm thick). These components were cleaned with a supersonic wave sy-ringe using a neutral detergent and ethyl alcohol, respectively. The rubber sheet had a circular hole with a di-ameter of about 6 mm, and was sandwiched between the two cover glass plates. The mixed lysozyme solution was dropped into the circular space between the glass plates. This parallel plate cell allows for precise measure-ments of the forward light scattering at small angles from the sample solutions.
2.2. Forward Static Light Scattering (F-SLS) Measurements
[image:3.595.169.458.91.317.2]
(a) (b)
Figure 1. Schematic of the experimental setup for measuring the forward light scattering (F-LS) of crystallizing protein solutions. Photographs of the forward light scattering projected onto a screen far from the sample solution cell.
The apparatus for F-SLS measurements was constructed in house [20] [21]. The sample cell was mounted on the θ rotation stage of a θ - 2θ coupling stage with a common axis, which was controlled with a personal com-puter through a controller. A narrow laser beam (~0.7 mm in diameter, spread angle < 1.2 × 10⁻³ rad) from a di-ode-pumped solid state laser (λ = 473 nm, 25 mW) was directed onto the sample cell perpendicularly (at a fixed incident angle of θ = 0). The incident light was split with a half-mirror and the intensity was monitored using a photo-diode detector, as a reference light for estimation of the relative light scattering intensity. Light scattered from the sample solution was detected using a small solid photomultiplier detector mounted on the 2θ rotation stage. To measure the scattered light precisely at the scattering angle θs, a pair of slits (~2 mm in diameter) was positioned on the 2θ rotation stage at an appropriate distance in front of the detector. The detected scattered light at each angle was recorded on the computer through an analog-digital interface converter.
Light scattering of the buffer solutions was extremely weak and a constant for scattering angles except for in very small angular range (<2˚), so that the background scattering of the sample solutions was negligible. Fur-thermore, scattering pattern of lysozyme small aggregates <0.2 μm, which were passed through the 0.2-μm filter in the solution preparation, was similar to that of the buffer solutions and the scattering at the small angles can be involved in the background scattering. Thus we estimated the scattering light intensity Is as the ratio of moni-tored incident light intensity, and obtained the SLS patterns for the sample solutions from measurements of scattering light intensities by scanning the 2θ rotation stage at a step angle of 0.1˚. The measured Is
( )
θs was corrected for the measurement angle by multiplying by a factor of 1 cosθs , to obtain the accurate scattering an-gle distribution. In the light scattering measurements for lysozyme solutions before crystallization, the influence of multiple light scatterings can be ignored, because the transmitted light in the sample solutions is strong be-cause of the lack of an absorption at the energy of the probe light (λ = 473 nm), while the scattering light inten-sity is weak, as shown in the photograph (a) of Figure 1. We obtained the scattering distribution in q space, Is (q) from the SLS measurements. It is worth noting that the scattering measurements allow the estimation of(
)
0
2 sin s 2
q= k θ , without considering the index of solvent, because the scattering light from the sample solu-tion is refracted in the cell structure of solusolu-tion (scatters)/glass plate/air and is measured on the air side through the plane glass cell. The scattering angle range of 2˚ < θs < 15˚ corresponds to the scattering wave vector of 0.46 μm−1 < q < 3.47 μm−1.
HEWL solutions induces aggregation because the electrolyte ions decrease the electrostatic potential screening (Debye-Hűckel screening [16]), which results in weakening the repulsive forces between colloidal proteins. Since initial aggregation of lysozyme just after the addition of precipitant is quite drastic [13] [14], the SLS for the HEWL solutions was measured about 30 min after mixing when they had reached a relatively stable state.
3. Results and Discussion
3.1. Crystallization Conditions of Lysozyme
The crystallization conditions for lysozyme are summarized in Table 1. Two days after the HEWL solutions had been mixed with the precipitant NaCl, we judged whether lysozyme crystals had grown using a microscope (×40). Table 1 corresponds to a phase diagram that describes the relationship between concentrations of crystal-lizing protein and precipitant at a constant temperature and at a constant pH. The results in Table 1 indicate a dissolving area with no crystal growth of protein, a metastable area with crystal growth, and the boundary region. The boundary in lysozyme crystallization is observed, for example, at around 3.5% (w/v) NaCl in 20 mg/ml HEWL (denoted by a pair of plus and minus in Table 1). Figure 2 shows photographs of 30 mg/ml (2.1 mM) HEWL solutions in micro test tubes two days after the addition of 3.0% (w/v) or 3.5% (w/v) NaCl. No crystal growth is observed in the 3.0% (w/v) NaCl solution, while in the 3.5% (w/v) NaCl solution, many lysozyme crystals have grown (N > 100 in 180 μl), which are tetragonal or orthorhombic crystals < 0.2 mm3 in volume.
Many experiments on protein crystallization indicate that a metastable state between precipitant and disso-luble regions is advantageous for obtaining good quality protein crystals [1] [2]. It is very important in protein crystallization to discern the difference between protein aggregations in the dissolving and the metastable areas from pre-crystalline solutions. The crystallization boundary for the measured lysozyme solutions (Table 1) nearly corresponds to a solubility curve in the phase diagram, for example, as presented in [4]. It is worth noting that the crystallizing lysozyme solutions around the boundary are not situated on the liquid-liquid phase-separa- tion area. Information on the boundary of protein crystallization in the metastable region is useful for crystalli-zation screening.
[image:4.595.155.495.454.701.2]3.2. Forward Static Light Scattering (F-SLS) Characteristics
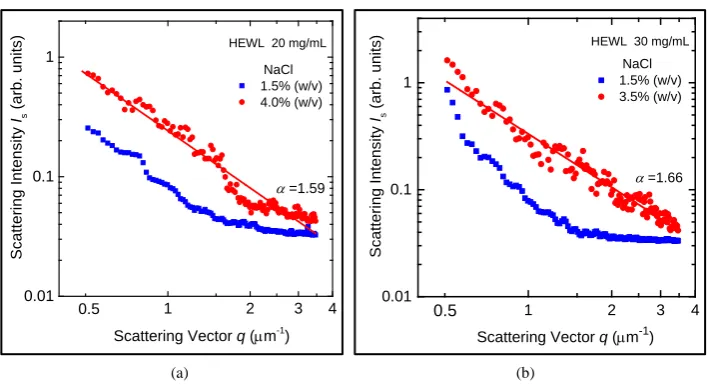
Figure 3 shows the log-log plots of Is vs. q from the SLS profiles at small angles for (a) 20 mg/ml HEWL solu-
Table 1. Crystallization conditions for lysozyme with NaCl at 20˚C.
Concentration of Lysozyme (mg/ml)
Concentration of NaCl (% w/v)
0 1.0 2.0 3.0 3.5 4.0 4.5 5.0 6.0 7.0
30 −a − − − + + + + + +
20 − − − − +− + + + + +
10 − − − − − − +− +− + +
a. Symbols: +, Crystallization; −, No Crystallization; +−, Crystallization or not.
(a) (b)
[image:4.595.87.540.457.556.2](a) (b)
Figure 3. Log-log plots of scattering light intensity Is as a function of scattering wave vector q for (a) 20 mg/ml lysozyme solution with 1.5% (w/v) and 4.0% (w/v) NaCl and for (b) 30 mg/ml lysozyme solution with 1.5% (w/v) and 3.5% (w/v) NaCl.
tions with 1.5% and 4.0% (w/v) NaCl and for (b) 30 mg/ml HEWL solutions with 1.5% and 3.5% (w/v) NaCl. The solution samples evaluated by F-SLS were in a state where microcrystal growth of lysozyme was unob-servable using a microscope just after the F-SLS measurements. The addition of higher NaCl to the solutions at the same HEWL concentration exhibits a considerable increase in the F-SLS intensity. The enhanced F-SLS curve indicates formation of larger aggregates (clusters) of lysozyme, caused by the additional NaCl. The fluc-tuations in the SLS are not a noise signal, which are attributed to dynamics of lysozyme aggregates. The SLS log-log profiles of the higher NaCl addition can be fitted by a linear function with a negative slope giving a power law of Is
( )
q ∝q–α. The power value α is 1.59 ± 0.06 for the 20 mg/ml solution with 4.0% (w/v) NaCl. The determination coefficient R2 is 0.950, as obtained from least-square fitting. For the 30 mg/ml solution with 3.5% (w/v) NaCl, α = 1.66 ± 0.05 and R2 is 0.955. The R2 gives a measure of how well the data are fitted by a curve (0 ≤ R2≤ 1).The power-law SLS pattern indicates a fractal aggregation of lysozyme in the pre-crystalline solutions. As this is well fitted by a linear function, the power value α gives a fractal dimension D for the lysozyme fractal clusters, which gives information on the interior fractal structure [16]. In contrast with the higher NaCl solutions, the 1.5% (w/v) NaCl solutions exhibit no power law in the SLS curve. This indicates that the lysozyme aggregates form in the 1.5% (w/v) NaCl solutions are not fractal clusters. No crystals of lysozyme were grown in the 1.5% (w/v) NaCl solutions after several weeks, while in the higher NaCl solutions the growth of lysozyme crystals were confirmed after two days, as shown in Table 1.
3.3. Relationship between Aggregation in Pre-Crystalline Solutions and the
Crystallization Conditions
Although we could not interpret the power law for the SLS patterns of the 1.5% (w/v) NaCl solutions in Figure 3, the accuracy of the linear fit of the SLS data can act as a defacto metric. To this end, we estimated the power value α for the measured SLS data of the pre-crystalline solutions and evaluate the fit with R2 values. Typical results are shown in Figure 4. At NaCl concentrations lower than 3% (w/v) in the 20 and 30 mg/ml HEWL solu-tions, the SLS curves could not be fitted to a linear function (R2 < 0.9, the broken line in Figure 4(b)). Thus we can confirm the formed aggregates are not fractal clusters in these conditions. Through this region, the α value increases and R2 rises as the NaCl concentration increases. This behavior indicates that the added NaCl leads to lysozyme aggregation and the formation of fractal clusters.
In contrast, in the higher NaCl concentration region of >4% (w/v), the SLS patterns can be fitted to a power law (R2 > 0.9, as shown in Figure 4(b)), which means the aggregates are fractal clusters. As is shown in Table 1, the crystallization boundary exists between 3% and 4% (w/v) NaCl in 20 and 30 mg/ml HEWL solutions. Com-paring the data in Figure 4with the crystallization conditions, reveals that on the higher NaCl concentration side
1 2 3 4
0.01 0.1 1 NaCl 1.5% (w/v) 4.0% (w/v) S c atter ing Intens ity Is ( ar b. uni ts )
Scattering Vector q (µm-1 ) HEWL 20 mg/mL
0.5
α =1.59
1 2 3 4
0.01 0.1 1 NaCl 1.5% (w/v) 3.5% (w/v) S c at teri ng I nt ens it y Is (ar b. uni ts )
Scattering Vector q (µm-1) HEWL 30 mg/mL
0.5
(a) (b)
Figure 4. (a) Dependence of the power value α on the NaCl concentration when added to 20 and 30 mg/ml HEWL solutions, as estimated from the SLS profiles using least-square fitting. (b) Change in determination coefficient R2 with the added NaCl concentrations.
of the crystallization boundary, the fractal dimensions D (in this case, equal to α) of the lysozyme clusters are larger than those of the lower concentration area and exceed a value of 1.5 (the broken line in Figure 4(a)). The comparison proves that the pre-crystalline solutions where lysozyme crystals grow exhibit the formation of fractal clusters with fractal dimensions over 1.5.
The fractal dimension D is strongly related to the mass density of the fractal aggregate structure and the frac-tal aggregates can be characterized by the power-law dependence of an average local density
( )
0
r
ρ at dis-tance r from a given point [16] [17]:
( )
0
D d
r r
ρ ∝ − , where d is a spatial dimension. The structure factor
( )
S q obtained from static light scattering measurements of Is
( )
q is directly connected to( )
0r
ρ , and is given by the Fourier transform of
( )
0
r
ρ [16]. Since the average local density
( )
0r
ρ expresses a spatial correlation between two arbitrary scattering sites in the clusters, the larger the correlation in the distances be-tween scattering elements, such as particles forming fractal structures, the larger the D, which means that the structure of fractal clusters is denser.
The D of fractal clusters formed in the crystallizing lysozyme solutions is of the range of 1.5 ~ 1.8, as seen in Figure 4(a). The estimated D values are not significantly different from those reported by Georgalis et al. [13] [14] or Tanaka et al.[7] [15]. For typical fractal aggregates like colloidal silica, gold and polystyrene particles, two types of fractal models are as well known: diffusion-limited cluster aggregation (DLCA) with D ~ 1.8 and reaction-limited cluster aggregation (RLCA) with D ~ 2.1 [16]-[19]. The fractal dimensions of the lysozyme clusters formed in the pre-crystalline solutions progressing to crystallizations are closer to the value of DLCA than RLCA. The lysozyme clusters are well hydrated and contain a considerable amount of H2O, unlike fractal clusters of colloidal metals, silica, and polystyrene particles. Water-soluble protein crystals like lysozyme are typically made up of over 60% water [1]. Therefore, the pre-crystalline protein clusters probably have a low mass density as compared with colloidal particles, meaning the D of the lysozyme clusters will be smaller. d/2 <
D < d describes the range of D known to undergo colloidal aggregation, as determined from simulations and experiments [16]. In the formation of the aggregates d = 3, meaning the fractal dimension must be in the range, 1.5 < D < 3. This agrees with the boundary value of D = 1.5 found here for lysozyme fractal aggregates that lead to the formation of crystalline nuclei. These results indicate that high density fractal clusters of lysozyme with
D > 1.5 are formed in solutions which will progress to crystallization.
4. Conclusion
We have characterized lysozyme aggregates in pre-crystalline solutions using a highly sensitive FLS technique. The SLS profiles have been analyzed using a least-square fitting method and the fitting determination coefficient
R2, and this has been related to the conditions in which the lysozyme crystallizes because of added NaCl. When the SLS patterns for the aggregates deviate from the power law or show low power values, the lysozyme solu-tions do not progress to crystallization. Pre-crystalline lysozyme solusolu-tions which do progress to crystallization
1 2 3 4 5 6
0.6 0.8 1.0 1.2 1.4 1.6 1.8 2.0 HEWL 20 mg/mL 30 mg/mL P ower V al ue α
Concentration of NaCl [% (w/v)] α = 1.5
1 2 3 4 5 6
0.5 0.6 0.7 0.8 0.9 1.0 HEWL 20 mg/mL 30 mg/mL Deter m inati on Coeffi c ient R 2
generate dense fractal clusters with fractal dimensions of D > 1.5. The forward-light-scattering method is a very powerful technique for screening protein crystal growth conditions.
Acknowledgements
The author thanks Prof. H. Koibuchi (Ibaraki National College of Technology) for useful discussions on fractals. This research was supported by the Salt Science Research Foundation and partly by JSPS KAKENHI.
References
[1] McPherson, A. (1982) Preparation and Analysis of Protein Crystals. Wiley, New York.
[2] Chayen, N.E. and Saridakis, E. (2008) Protein Crystallization: From Purified Protein to Diffraction-Quality Crystal.
Nature Methods, 5, 147-153. http://dx.doi.org/10.1038/nmeth.f.203
[3] Muschol, M. and Rosenberger, F. (1997) Liquid-Liquid Phase Separation in Supersaturated Lysozyme Solutions and Associated Precipitate Formation/Crystallization. The Journal of Chemical Physics, 107, 1953-1962.
http://dx.doi.org/10.1063/1.474547
[4] Tanaka, S., Yamamoto, M., Ito, K., Hayakawa, R. and Ataka, M. (1997) Relation between the Phase Separation and the Crystallization in Protein Solutions. Physical Review E, 56, R67-R69. http://dx.doi.org/10.1103/PhysRevE.56.R67 [5] Tanaka, S., Ataka, M. and Ito, K. (2002) Pattern Formation and Coarsening during Metastable Phase Separation in
Lysozyme Solutions. Physical Review E, 65, 51804-1-6. http://dx.doi.org/10.1103/PhysRevE.65.051804
[6] Price, W.S., Tsuchiya, F. and Arata, Y. (1999) Lysozyme Aggregation and Solution Properties Studied Using PGSE NMR Diffusion Measuerments. Journal of the American Chemical Society. 121, 11503-11512.
http://dx.doi.org/10.1021/ja992265n
[7] Tanaka, S., Ito, K., Hayakawa, R. and Ataka, M. (1999) Size and Number Density of Precrystalline Aggregates in Ly-sozyme Crystallization Process. The Journal of Chemical Physics, 111, 10330-10337.
http://dx.doi.org/10.1063/1.480381
[8] Skouri, M., Lorber, B., Giegé, R., Munch, J. -P. and Candau, J. S. (1995) Effect of Macromolecular Impurities on Ly-sozyme Solubility and Crystallizability: Dynamic Light Scattering, Phase Diagram, and Crystal Growth Studies.
Jour-nal of Crystal Growth, 152, 209-220. http://dx.doi.org/10.1016/0022-0248(95)00051-8
[9] Muschol, M. and Rosenberger, F. (1995) Interactions in Undersaturated and Supersaturated Lysozyme Solutions: Static and Dynamic Light Scattering Results. The Journal of Chemical Physics, 103, 10424-10432.
http://dx.doi.org/10.1063/1.469891
[10] Sazaki, G., Ooshima, H., Kato, J. Harano, Y. and Hirokawa, N. (1993) Mechanism of Crystallization of Enzyme Pro-tein Thermolysin. Journal of Crystal Growth, 130, 357-367. http://dx.doi.org/10.1016/0022-0248(93)90521-W
[11] Eberstein, W., Georgalis, Y. and Saenger, W. (1994) Molecular Interactions in Crystallizing Lysozyme Solutions Stu-died by Photon Correlation Spectroscopy. Journal of Crystal Growth, 143, 71-78.
http://dx.doi.org/10.1016/0022-0248(94)90369-7
[12] Tanaka, S. and Ataka, M. (2002) Protein Crystallization Induced by Polyethylene Glycol: A Model Study Using Apo-ferritin. The Journal of Chemical Physics, 117, 3504-3510. http://dx.doi.org/10.1063/1.1477456
[13] Georgalis, Y., Zouni, A., Eberstein, W. and Saenger, W. (1993) Formation Dynamics of Protein Precrystallization Fractal Clusters. Journal of Crystal Growth, 126, 245-260. http://dx.doi.org/10.1016/0022-0248(93)90031-Q
[14] Georgalis, Y., Umbach, P., Saenger, W., Ihmels, B. and Soumpasis, D.M. (1999) Ordering of Fractal Clusters in Crys-tallizing Lysozyme Solutions. Journal of the American Chemical Society, 121, 1627-1635.
http://dx.doi.org/10.1021/ja982407y
[15] Tanaka, S., Yamamoto, M., Kawashima, K., Ito, K., Hayakawa, R. and Ataka, M. (1996) Kinetic Study on the Early Stage of the Crystallization Process of Two Forms of Lysozyme Crystals by Photon Correlation Spectroscopy. Journal
of Crystal Growth, 168, 44-49. http://dx.doi.org/10.1016/0022-0248(96)00361-2
[16] Witten, T.A. and Pincus, P.A. (2004) Structured Fluids: Polymers, Colloids, Surfactants. Oxford, New York.
[17] Schaefer, D.W., Martin, J. E., Wiltzius, P. and Cannell, D.S. (1984) Fractal Geometry of Colloidal Aggregates.
Physi-cal Review Letters, 52, 2371-2374. http://dx.doi.org/10.1103/PhysRevLett.52.2371
[18] Weitz, D. A., Huang, J. S., Lin, M. Y. and Sung, J. (1985) Limits of the Fractal Dimension for Irreversible Kinetic Ag-gregation of Gold Colloids. Physical Review Letters, 54, 1416-1419. http://dx.doi.org/10.1103/PhysRevLett.54.1416
[19] Lin, M. Y., Lindsay, H.M., Weitz, D.A., Ball, R.C., Klein, R. and Meakin, P. (1989) Universality in Colloid Aggrega-tion. Nature, 339, 360-362. http://dx.doi.org/10.1038/339360a0
Solutions. Applied Physics Letters, 98, 263701-1-3. http://dx.doi.org/10.1063/1.3603932
[21] Wakamatsu,T., Toyoshima, S. and Shimizu, H. (2011) Observation of Electric-Field Induced Aggregation in Crystal-lizing Protein Solutions by Forward Light Scattering. Applied Physics Letters, 99, 153701-1-3.