Improvement of the Equivalent Circuit Method for Analysis of
Frequency Selective Surfaces Using Genetic Algorithms
and Rational Algebraic Models
Gilmara Linhares R. Ara´ujo1,
Antonio Luiz P. S. Campos2, *, and Allan de Medeiros Martins3
Abstract—In this paper, we propose an enhancement of the Equivalent Circuit Method (ECM) for analysis of frequency selective surfaces (FSS) with square loop geometry of the unit cell. For this, genetic algorithms and rational algebraic models are used to obtain a more accurate value of the effective electrical permittivity (εeff). We use simulated data obtained with a commercial software to adjust some
parameters. So, genetic algorithm is used to obtain a better value of an exponent that calculates εeff
minimizing the rational algebraic models. In this paper, this is done for the square loop geometry, but the methodology can be extended to any geometry. Finally, prototypes are built and the technique is validated.
1. INTRODUCTION
Nowadays a number of theoretical researchers have developed a growing interest in the use of the FSS as bi-dimensional periodic arrays and its applications in several electronic devices. Among the several techniques to approach the problem, the Method of Moments (MoM) [1], Finite Differences on Time Domain (FDTD) [2], Hybrid methods [3], and artificial intelligence techniques [4] can be cited as the most used numerical techniques that perform full wave analysis.
Because of their frequency selective properties, FSS are incorporated in a wide variety of applications, and the frequency behavior of each FSS depends on different variables, such as the geometry of metal patches, periodicity of the array, as well as the thickness and dielectric characteristics of the substrate, in which we can use optimization procedures to design a structure with a specific performance. Usually, in the FSS problems, the goal is to find physical parameters with optimized performance of the FSS: the relevant parameter selection is a process that could depend on the trial-error method. In this sense, some nature inspired population based methods such as Genetic Algorithm (GA), Differential Evolution Strategy (DES), and Particle Swarm Optimization (PSO) can be applied for this purpose.
Several authors have applied these techniques for FSS design. For example, in [5, 6] the authors used particle swarm optimization to design FSS. In [7] a very efficient optimization population-based search algorithm combined with a multi-layer perceptron neural network was employed to the optimization of FSS with fractal geometries. A genetic algorithm was used to design frequency selective surfaces in [8]. A bioinspired hybrid optimization algorithm was proposed in [9] for designing broadband frequency selective surfaces.
In almost all of these papers, the authors used a limited set of variables’ values usually provided by commercial software applications where several simulations must be done. Also, these simulations demand huge computational effort, and the design possibilities are limited by this set. Using an
Received 8 June 2015, Accepted 31 July 2015, Scheduled 21 August 2015
* Corresponding author: Antonio Luiz Pereira Siqueira Campos ([email protected]).
analytical method, one can limit the possibilities to fit with the dimensions that can be used to manufacturing the FSS, where the ECM rises as an appropriate method to perform such task.
The equivalent circuit for modeling of FSS requires very limited computing resources compared to methods of full-wave analysis, and therefore is useful for fast predicting of structure performances. The modeling also provides a useful physical insight into how the FSS functions when their parameters are changed, and it can be executed recursively, many times as necessary.
Several authors presented, in literature, modeling for different geometries, involving the ECM [10– 16]. In all of these papers, some limitations of the technique can be noted. This is due to the fact that the equivalent impedance of a printed frequency selective surface on a dielectric substrate is modified proportionally to the dielectric constant and thickness of the dielectric that supports the structure. An increase in thickness of the substrate while maintaining the relative permittivity fixed causes a gradual reduction in the resonant frequency of the FSS.
In fact, the resonant frequency of an FSS, in the presence of a thick dielectric substrate is reduced by a factor proportional to(εr+ 1)/2 [17]. This simplified approach is also acceptable in quasi-static regime (p λ, where p is the periodicity of the array and λthe wavelength), since in this frequency range, the impedance value of the FSS is high and purely capacitive, and the multiplication by effective permittivity almost did not disturb the transmission coefficient. This approach is not suitable if the periodic structure cannot be regarded as homogeneous.
The presence of thin dielectric substrates involves a relevant number of Floquet modes. Given the complexity of the problem, a closed formula based on Green function cannot be obtained. In [18], the authors proposed the derivation of a simple interpolation formula, which corresponds exactly to the variation of the effective permittivity as a function of the thickness of the dielectric.
Such simplified approach is useful for understanding the physics of the problem, as it is also a good way to reach a preliminary estimate of the response of an FSS printed on a substrate. The expression of interpolation that best fits the behavior of effective electrical permittivity as a function of the thickness of the dielectric was obtained in [18] by manipulation of a graphical function which satisfies the limitations mentioned, i.e., the exponential function. The effective electrical permittivity is given by:
εeff =εr+ (εr−1)
−1 eNx
(1)
where x = 10h/p, N is an exponential factor, which takes into account the slope of the curve. This parameter varies with the geometry used in the unit cell of the FSS, as a function of the fill factor, or occupation factor (OF) of the unit cell and ofh that is the thickness of the dielectric [18].
In order to have a good approximation of the value ofεeff, an appropriate choice for the value ofN
(a real number) is an important point. Typically, the authors use an average value for N. This is not always easy and may lead to less accurate results. Extensive studies may have to be made to obtain an appropriate value ofN because different thicknesses of dielectric substrates need different values ofN. Thus, in this work we propose a technique for determining the value ofN given a very broad range of possibilities using square loop FSS projects as the unit cell geometry. The method is based on genetic algorithms and differential geometry to obtain rational algebraic models to determine a value of N as accurate as possible, facilitating new designs of FSS with this geometry.
2. ACQUISITION OF DATA
To obtain data, numerous simulations were conducted for FSS. The simulations of the structures were performed with a commercial software, which used a full-wave analysis technique (method of moments as analysis) to obtain accurate results, but with a high computational effort. It was considered a single substrate, the flame retardant four (FR-4), due to its low cost and ease of supply. In addition, the value of εr does not affect the value of N. For the simulations obtained with this software we applied the ECM to adjust the parameter N in order to converge the resonance frequencies obtained with a commercial software to those generated with ECM.
Figure 1. Periodic array used in the analysis.
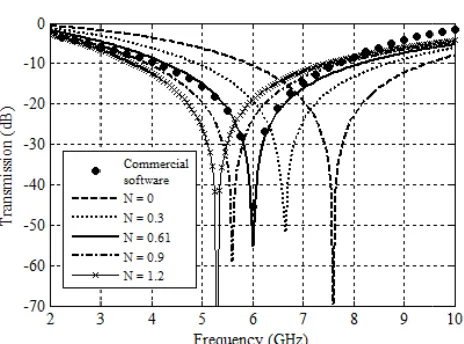
Figure 2. Convergence of the curve obtained with a commercial software with adjustment of theN parameter applying the ECM, ford/p= 0.7 and OF = 8.04%.
Figure 3. Convergence of the curve obtained with a commercial software with adjustment of the N parameter applying the ECM, ford/p= 0.9 and OF = 45%.
In all simulations, the thickness of the dielectric ranged from very thin dimensions to thicker dimensions, in the following way: 0.02 mm, 0.04 mm, 0.08 mm, 0.16 mm, 0.2 mm, 0.4 mm, 0.8 mm and 1.6 mm. This variation covers almost all the most common commercial substrates found in the market. The dimensions used in simulations were chosen focusing on the application of the FSS at high frequencies (at the beginning of millimeter waves) to the beginning of the frequency range of microwaves. Thus, these dimensions generating OF ranging from approximately 5% to 60%. These values generated periodicity range of 5 to 20 mm. Different fractions of d/pwere used to evaluate the effect of this ratio on the value of N. These ratios ranged from 0.7 to 0.9.
Obtaining the exact values of the parameter N for the convergence of the resonant frequencies of the FSS took from simulations with a commercial software. We applied the equivalent circuit method in order to converge the resulting resonance frequency with that obtained with a commercial software. The value ofN was varied until convergence occured. Figures 2 and 3 show the frequency convergence curves generated using a commercial software and the equivalent circuit method, by adjusting the parameter N.
The FSS shown in Figure 2 has physical dimensions: p = 5 mm, d = 3.5 mm, w = 0.2 mm and h = 0.02 mm. These physical dimensions give an OF of 8.04%. For this case, the convergence of the resonant frequency occurred forN = 4.2.
compared with the previous case. For this case, the convergence of the resonant frequency occurred for N = 0.61.
3. GROUPING OF DATA
The converging results obtained forN were grouped according tod/p, wheredis the length of the loop and p the periodicity of the periodic array. These results were plotted as a function of the occupation factor and depending on the thickness of the dielectric. In Figure 4, we can see curves ofN as a function of OF for various thicknesses of dielectric and a ratio of d/p of 0.9 (p = 20 mm, d= 18 mm), and the dimension ofw was varied in order to obtain different values of OF. It can be seen that the curves are converging as the dielectric thickness increases, which behave as quadratic functions.
In Figure 5, the results ofN depending on the thickness of the dielectric (h) for different values of OF and a d/p ratio equal to 0.75 were plotted. It can be observed that the curves are practically the same, with no differences between them and a negative exponential behavior.
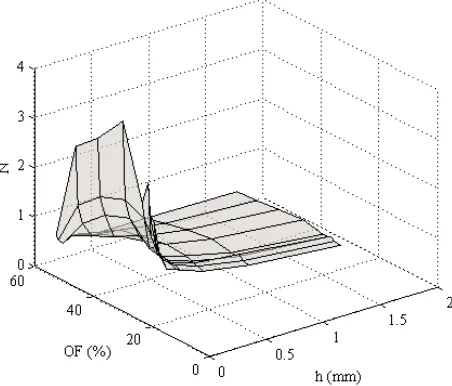
After that, the 3D curves ofN as a function of OF and the dielectric thickness (h) were plotted for the different ratios of d/p. The 3D curves forN are plotted so that one can, from these curves, analyze
Figure 4. Curves of N as a function of OF, for different values of h and d/p= 0.90.
Figure 5. Curves of N as a function of h, for different values of OF and d/p= 0.75.
the behavior of the same, to obtain a mathematical model that generalizes the obtaining of N from physical parameters of the structures for each d/p. Figure 6 illustrates the behavior ofN as a function of OF andh, for a ratio d/pequals to 0.866 (p= 15 mm, d= 13 mm).
4. MODELING USING RATIONAL ALGEBRAIC EQUATIONS
Based on the format and shape of the measured curves, we propose a rational algebraic model that contains 10 parameters (a1,b1,. . .,f1,a2,b2,. . .,f2). The model is of second degree and given by [19]:
H(x, y) = a1x
2+f
1x y+b1x+d1y2+e1y+c1
a2x2+f2x y+b2x+d2y2+e2y+c2
(2)
In the model,HisN, and the variablesxandyare the OF and dielectric thickness (h), respectively. From [17], we know that measurements ofHdepend on OF andh. However, we note thatHalso depends on d/p. Hence, we model different measurements scenarios.
The motivation behind the rational algebraic model was driven by results in differential geometry [19] in the study of second degree approximations of manifolds. In this context, H(x, y) is a function from2 → , thus we can approximate by a rational algebraic expression, whereis the set of real numbers.
With the model at hand, we must fit the measured points to it. In order to do that, we define the mean square error of the fitted model and the measured points as [19]:
e(a1, b1, . . . , f1, a2, b2, . . . , f2) =
1 N
N
i=1
ˆ
H(xi, yi;a1, b1, . . . , f1, a2, b2, . . . , f2)−Hi 2
(3)
where the notation ˆH(xi, yi;a1, b1, . . . , f1, a2, b2, . . . , f2) means that we evaluate (2) with parameters
(a1,b1,. . .,f1,a2,b2,. . .,f2), andHi is the measured value ofH at the pointsxi and yi.
The aim is to minimize functional (3) with respect to each parameter. This procedure will fit model (2) to the measured data, thus allowing to make predictions for different values ofxi and yi. In this work, we use genetic algorithms to perform the fit of the parameters (minimizing (3)). In the next sections we will give details about the genetic algorithm parameters and methodology.
To minimize (3) we use genetic algorithms and obtained values of the unknown coefficients (a1,
b1, . . ., f1, a2,b2, . . ., f2). Thus, 5 rational algebraic models were obtained for each of the ratios d/p
encompassing various physical dimensions for FSS projects over a wide frequency range. To obtain
Figure 7. Curve of N as a function of OF and h, ford/p= 0.7.
every rational algebraic model genetic algorithms have been shot with a population of 2000 individuals and 100.000 generations.
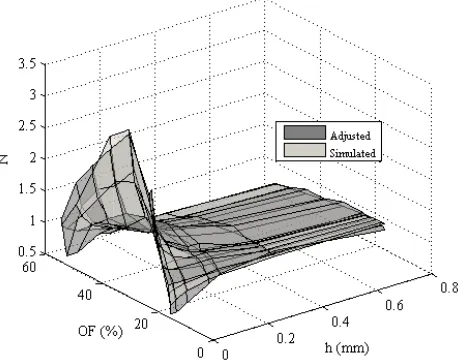
Figures 7 and 8 illustrate comparisons of the measured curve with the adjusted curve ford/p= 0.7 (p = 5 mm,d= 3.5 mm) andd/p= 0.9 (p= 20 mm, d= 18 mm), respectively. It is noticed that there is a good agreement between the curves, which demonstrates the effectiveness of the methodology.
5. MODEL VALIDATION
To validate our modeling, three projects were proposed. These designs involve different dimensions and different ratios of d/p that are outside of the curves used in modeling, representing an extrapolation method.
FSS are stop-band filters with resonance frequencies equals to: 3.5 GHz, 6.5 GHz and 9.5 GHz. Designs were simulated with a commercial software and with the modeling method that we obtained the value of N for each case. With these values of N, the ECM was used, and the results of the transmission coefficient were obtained.
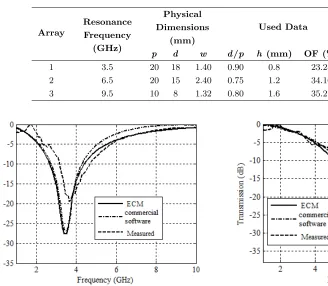
Table 1 shows the dimensions obtained in the projects and data used in the proposed algorithm. To validate the analysis, three arrays were built and experimental results were obtained for each of the arrays.
In Figure 9 we show a comparison between the simulation results with the commercial software and ECM and experimental results, to Array 1. We can observe that there is a good agreement between the results. In fact, the results of the ECM must agree with that of the commercial software since the modeling was performed on the basis of the results obtained with this software. Differences between measurements and simulations can be attributed to the manufacturing process and low-quality dielectrics (inaccurate in height and in the εr value).
Table 1. Physical dimensions of designers and data used in the proposed algorithm.
Array
Resonance Frequency
(GHz)
Physical Dimensions
(mm)
Used Data
ObtainedN
p d w d/p h (mm) OF (%)
1 3.5 20 18 1.40 0.90 0.8 23.24 0.8832
2 6.5 20 15 2.40 0.75 1.2 34.16 1.0172
3 9.5 10 8 1.32 0.80 1.6 35.27 0.8078
Figure 9. Comparison between measurements and simulations for Array 1 of Table 1.
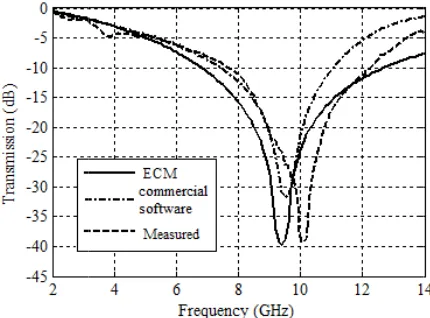
Figure 11. Comparison between measurements and simulations for Array 3 of Table 1.
In Figure 10 we show a comparison between the simulation results with commercial software and ECM, to Array 2. Again, the results of ECM agree with the that of the commercial software, and there is a little difference between simulated and measured results.
Finally, in Figure 11 we show a comparison between the simulation results with commercial software and ECM, to Array 3. Again, the results of ECM agree with that of the commercial software and, again a little difference between simulated and measured results, comparing it with the last simulation.
These differences are not only related to manufacturing problems and dielectrics, but the simulation parameters settings in the commercial software. Still, ECM showed better agreement with experimental results with respect to bandwidth than the results obtained with the commercial software.
6. CONCLUSIONS
In this paper, we present a proposal to improve the equivalent circuit method by using a combination of commercial software with rational algebraic models and genetic algorithms. The technique optimizes obtaining an appropriate value for N (Eq. (1)), allowing a better convergence of simulations and measurements. This technique can be extended to all geometries having the equivalent circuit model determined by simply following the same methodology. In our work, the validation of the proposed technique was initially verified through simulations in a commercial software and then with measurements. The good agreement between simulated and measured results suggests that our model can be successfully used to improve the analysis of FSS devices in several configurations. Once the results presented here depend on the spatial arrangement of the device, we can extend the use of this technique to all geometries having the equivalent circuit model determined by simply following the same methodology.
REFERENCES
1. Wu, T. K., Frequency Selective Surface and Grid Array, John Wiley & Sons, New York, US, 1995. 2. Harms, P., R. Mittra, and W. Ko, “Implementation of the periodic boundary condition in the finite-difference time-domain algorithm for FSS structures,”IEEE Transactions on Antennas and Propagation, Vol. 42, No. 9, 1317–1324, 1994.
3. Weile, D. S., E. Michielssen, and K. Gallivan, “Reduced order modeling of multiscreen frequency selective surfaces using Krylov-based rational interpolation,” IEEE Transactions on Antennas and Propagation, Vol. 49, No. 5, 801–813, 2001.
5. Yilmaz, A. E. and M. Kuzuoglu, “Design of the square loop frequency selective surfaces with particle swarm optimization via the equivalent circuit model,” Radioengineering, Vol. 18, No. 2, 95–102, 2009.
6. Genovesi, S., R. Mittra, A. Monorchio, and G. Manara, “Particle swarm optimization for the design of frequency selective surfaces,” IEEE Antennas and Wireless Propagation Letters, Vol. 5, No. 1, 277–279, 2006.
7. Silva, M. R., C. L. N´obrega, P. H. F. Silva, and A. G. d’Assun¸c˜ao, “Optimization of FSS with Sierpinski island fractal elements using population-based search algorithms and MLP neural network,” Microwave and Optical Technology Letters, Vol. 56, No. 4, 827–831, 2014.
8. Campos, A. L. P. S., A. M. Martins, and V. A. Almeida Filho, “Synthesis of frequency selective surfaces using genetic algorithm combined with the equivalent circuit method,” Microwave and Optical Technology Letters, Vol. 54, No. 8, 1893–1897, 2012.
9. Ara´ujo, W. C., H. W. C. Lins, A. G. d’Assun¸c˜ao, and J. L. G. Medeiros, “A bioinspired hybrid optimization algorithm for designing broadband frequency selective surfaces,” Microwave and Optical Technology Letters, Vol. 56, No. 2, 329–333, 2014.
10. Marcuvitz, N.,Waveguide Handbook, McGraw-Hill, New York, 1951.
11. Langley, R. J. and E. A. Parker, “Equivalent circuit model for arrays of square loops,” Electronics Letters, Vol. 18, No. 7, 294–296, 1982.
12. Lee, C. K. and R. J. Langley, “Equivalent circuit models for frequency selective surfaces at oblique angles of incidence,”IEE Proceedings, Vol. 132, No. 6, 395–399, 1985.
13. Wang, Z. L., K. Hashimoto, N. Shinohara, and H. Matsumoto, “Frequency-selective surface for microwave power transmission,”IEEE Transactions on Microwave Theory and Techniques, Vol. 47, No. 10, 2039–2042, 1999.
14. Langley, R. J. and E. A. Parker, “Double-square frequency selective surfaces and their equivalent circuit,” Electronics Letters, Vol. 19, No. 17, 675–677, 1983.
15. Leonard, T. W. and J. W. Cofer, “A new equivalent circuit representation for the Jerusalem cross,” IEE Conference Publ., No. 169, 65–69, 1978.
16. Langley, R. J. and A. J. Drinkwater, “Improved empirical model for the Jerusalem cross,” IEE Proceedings, Vol. 129, No. 1, 1–6, 1982.
17. Costa, F., A. Monorchio, and G. Manara, “Efficient analysis of frequency-selective surfaces by a simple equivalent-circuit model,”IEEE Antennas and Propagation Magazine, Vol. 54, No. 4, 36–48, 2012.
18. Yatsenko, V. V., S. A. Tretyakov, S. I. Maslovski, and A. A. Sochava, “Higher order impedance boundary conditions for sparse wire grids,” IEEE Transactions on Antennas and Propagation, Vol. 48, No. 5, 720–727, 2000.