1
Infrastructure Planning
Yang Li
Centre for Geo-Information Studies University of Eat London
University Way London E16 2RD UK
E-mail: [email protected]
Key words: Inequality, Accessibility, Data, Spatial Analysis, Planning
Abstract: Equitable access can be taken as an indicator of good social infrastructure planning. Due to the inevitable spatial separation between demand and supply, inequality in accessibility has an inherently spatial dimension. An innovative approach has been developed and tested in this study. The proposed approach is less computationally intensive and overcomes some of the disadvantages of conventional approaches. It is based on the average distance of residents to the nearest service / facility by small area geography. It will support rapid assessments of inequalities and ‘what-if’ analyses in a planning context.
1. Introduction
Social infrastructure in the UK generally includes: healthcare, education, community facilities, emergency and other essential services. In order to ensure that social services are delivered effectively and comprehensively, social infrastructure should be well planned for new developments, regeneration and in rationalising the efficient use of available resources. In social infrastructure planning, there is always a challenge to match the service supplies and the local demands. In recent years, increasing difficulties are raised from both supply-side and demand-side because of rapid demographic changes in many areas of UK. Considerable effort has been made to improve social infrastructure planning.
nearness (distance) or ease of travel. In this study, carried out in the context of social infrastructure planning in the UK, equitable access to services / facilities across a region shows a consistent match between supply and demand and can be taken as an indicator of good planning (Rosero-Bixby 2004, HUDU 2007). Due to the inevitable spatial separation between demand and supply, inequality in accessibility has an inherently spatial dimension. Spatial accessibility therefore plays an important role in equal access to social services, together with service availability, demographic variety and other social-economic factors.
Measures of spatial accessibility are an effective means of analysing inequalities within the organisation of social services (Rouse & Serban 2014). Spatial accessibility analyses are normally associated with large amount of data, a range of variables, intensive computation and arbitrate assumptions. To efficiently capture accessibility by small area geography as an input to analyses of inequalities and to inform social infrastructure planning, a novel approach has been developed and tested which is less computationally intensive and overcomes some of the disadvantages of conventional approaches.
2. Spatial Accessibility to Social Infrastructure Facilities
2.1 Supply-side view and the demand-side view of spatial
accessibility
There are two broad aspects (or stages) of social infrastructure planning: demand and supply. As summarised in Figure 1, demand includes needy population, demographical structure and prevalence whilst supply includes models, estates and workforce. In term of planning and management, spatial accessibility is seen as the mediation (or bridge) of supply and demand for social services. Inequality in accessibility is normally suggested as a practical or operable indicator of inequality in social services (Waters 2000).
Figure 1. Demand and supply of social infrastructure
From the spatial accessibility perspective, there are two groups of approaches based on the supply-side view and the demand-side view respectively. Conventional approaches to accessibility normally include concentric buffers and polygons of network drive/walk times around individual or groups of facilities. This puts the point of origin for any accessibility at the facility being accessed and is therefore a supply-side view. One problem with such approaches is transforming the zones thus produced into a variable that can be attached to administrative units for further analysis. A demand-side view starts with where people live and estimates the distance required to access their nearest facilities. Substantial effort have been made on travel cost calculation in order to achieve accurate and comprehensive measures, which at the same time lead to more complex and less compatible approaches.
2.2 Techniques of spatial accessibility measurement
Approaches based on supply-side and the demand-side views can be seen in various techniques of spatial accessibility measurement (Guagliardo 2004, Liu & Zhu 2004). This paper broadly classifies spatial accessibility measures in social infrastructure planning into 3 categories: catchment profile, travel impedance and gravity model.
Travel impedance is often referred as travel cost, which can be Euclidean distance (straight-line distance), road network distance, or travel time or travel cost in general. The distances can be the nearest distances from origins to destinations, and can be summed or averaged in different ways. Travel costs can be calculated by car driving, walk or bus. Travel impedance sometimes also refers as opportunity-based measures or opportunity models, as it looks at opportunities (or destinations) available within a certain distance from an origin. Travel impedance is mostly demand-side view based.
Over decades, details of travel cost have been thoroughly studied to take into account as many factors as possible. Diverse travel modes (rail, underground or ambulance), variable congestion levels (peak and off-peak speeds, road conditions, weather), and schedules/time budgets could be further taken into account (O’Sullivan, 2000; Ford et al., 2015; Ertugay & Duzgun, 2015). The difference between distance measures (e.g. Euclidean, network and travel time) has been discussed, for example the noteworthy impact from network type, network design and transit facility (Gutierrez & Garcia-Palomares, 2008). The strong correlation of different distance measures has also been initially explored by LSOA in the context of accessibility to UK hospital outpatient departments (Dusheiko et al., 2009). Distance or derived variables of distance are accepted as important criteria to support decision-making in term of spatial accessibility to social facilities (Ohta et al., 2009, Munoz & Kallestal, 2012).
Gravity model attempts to reflect the spatial interaction between supply and demand by travel impedance. It suggests that the attractiveness of supply and demand is related to their sizes and the travel impedance between them. Gravity model sometimes also refers as potential model, as it is related to demand potential, such as needy population or prevalence.
2.2 Challenges
Spatial accessibility measurement has been improved significantly with increasing complex methods and growing amount of detailed information. On the other hand, there are more restriction and limitation associated with these advance measures because of sensitivity and assumption introduced.
The design of catchment may be sensitive to geographic scale, boundary system and uneven population distribution. It brings difficulties to achieve accurate measurement of spatial accessibility. The use of transport networks requires assumptions to be made not only of appropriate travel speeds, but of the mode of travel as the available network will differ. Some inappropriate assumptions might result in a poor understanding of local accessibility. For example, a study of accessibility to health services in Liverpool was based on the public transport network, but a survey showed that only 19% respondents took public transport to visit a GP.
Demographic data could be quickly outdated due to (i)migration, regeneration, dramatic financial situations and new government policies. Furthermore, there is often professional data involved in many advance measures of spatial accessibility, such as road network, transport and remote sensing. Many of these data may not be available in public domain while detailed data preparation may be outside the skill set of planers of social infrastructure. Associated with large volume of data and complex method, there is also a heavy computational burden in measuring local spatial accessibility. Finally, the complexity of such advance measures may not provide an intuitive result that can be readily understood, interpreted and further analysed alongside other variables such as deprivation. These drawbacks are likely to constrain the use of accessibility measurement and the advantages that it offers to local social infrastructure planning.
Challenges remain to establish robust and flexible approaches for various applications. Issues of sensitivity and assumption deserve more attentions, because these issues may have knock-on effect on the quality of accessibility measurement. Problems of data availability and computation load need to be deal with in order to increase practical feasibility. Straightforward and rapid ‘what-if’ analyses are also expected for local planning.
3. The Approach of Average Weighted Distance
complexity of accessibility measurement, major factors will be identified rather than exhausting every detail. The proposed approach therefore leads to higher compatibility and less computational burden than complex / comprehensive methods whilst correlates well with them. Meanwhile, by using updated time series data available in public domain, local organisations are able to monitor and analyse spatial accessibility locally in a timely manner.
The proposed approach is based an innovative variable, called average weighted distance (AWD), which was initially deigned in our previous study. AWD is derived from the average distance of residents to a nearest facility by small area geography and further weighted by population distribution. No assumption is made for this variable in term of travel cost.
OA (Output Area – the standard geography in UK census statistics) is chosen as the basic geographic unit, because it is a very small area geography and can be associated with many demographic and socio-economic variables. It could then support in-depth analysis of inequality for social infrastructure planning. Moreover, the proposed approach can be applied on different geographic scales (such as LSOA and MSOA in UK census statistics, or Ward in UK administrative boundaries).
3.1 Distributed population
Population distribution can exert significant influence on spatial accessibility measurement (Langford et al. 2008). However there is a lack of up-to-date inter-census information about population distribution by small area geography. There are some alternative data which have been used in relevant research (Eicher & Brewer, 2001; Landford, 2004), such as aerial image or cartographic maps. However local organisations are not likely to have expertise on image processing / interoperation or map query / operation. These data may also have large data volume and expensive cost. More importantly, both aerial images and cartographic maps don’t have information about how many people residing in these buildings.
0.86 for Uttlesford, 0.67 for Haringey, 0.89 for Milton Keynes, 0.78 for Wellingborough. However, for districts with dense population and diverse community in metropolitan area, the situation could be complicated by variation of household composition across space and over time. It might lead to weak correlation between delivery and population (Brimicombe et al., 2009). In such case, multiple regression models could be developed by domestic delivery along with other variables, such as household size, empty households and multiple occupied households.
3.2 Correlated distances
As mentioned early, this study proposes an approach to measure the relative inequalities in spatial accessibility based on distant. The distance is therefore calculated for comparing the ease of travel rather than the exact travel cost. In order to achieve general applicability and lighter computation, a straightforward distance measure is expected in the proposed approach. The correlation of different distance measures has then been explored in various UK districts. This study will prefer the distance measure with less computation load if it is well correlated with complex distance measures.
In geographical information systems (GIS) there are three measures of distance that are readily computable: Euclidean, Manhattan and network distance. The network distance can be taken as is (network geometry), or further refined to reflect impedances such as speed limit, congestion level, one-way systems and restricted access (attributed network). Euclidean distance is the simplest to calculate, attributed network the most complex.
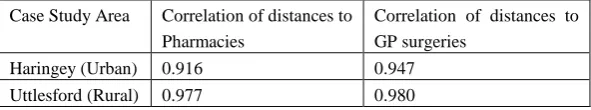
The correlation between Euclidean and road network distance is initially investigated in the case study areas of London Borough Haringey (with 2500m buffer zone) and Uttlesford district (with 5000m buffer zone) as typical urban district and comparable rural district respectively. Road network data is extracted from ITN (Integrated Transport Network) layer of OS Master Map.
Table 1. Correlation between Euclidean distance and road network distance Case Study Area Correlation of distances to
Pharmacies
Correlation of distances to GP surgeries
Haringey (Urban) 0.916 0.947
Uttlesford (Rural) 0.977 0.980
3.3 The average weighted distance
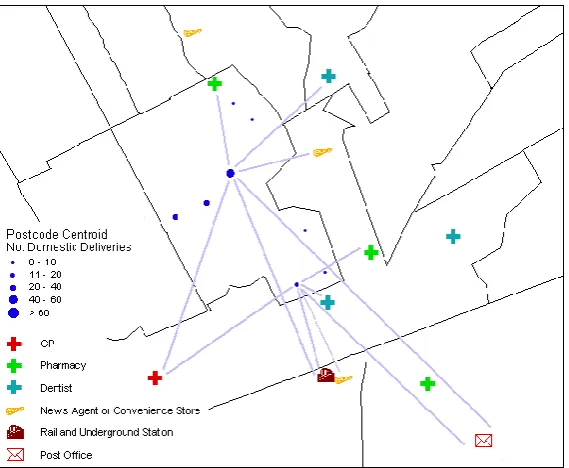
In order to overcome the methodological issues mentioned early in this paper, an innovative variable (i.e. Average Weighted Distance - AWD) is devised to calculate an overall accessibility for small area geography (OA or LSOA) based on the distance from each residential home to the nearest facility. The distance is calculated from each CodePoint delivery centroid to the nearest facility, weighted by the number of domestic deliveries and averaged for the OA or LSOA. This makes no assumption about details of travel cost. Such accessibility measurement is relative and therefore comparable across a study area. To avoid boundary problems, it is recommended that the study area could be buffered.
Euclidean distance is often the preferred distance measure in Average Weighted Distance while other distance measures are not excluded. As mentioned early, the principle is that the preferred distance measure will have less computation load and be well correlated with complex distance measures.
The general principle for AWD is expressed in equation (1). Figure 2 illustrates
how AWD is derived within an OA.
OA ddp P F P ddp F N D WOA
(1)
where:
= OA average weighted distance to a facility
= Euclidean distance from postcode centroid to nearest facility = weight equal to the number of domestic deliveries within each postcode unit
= total number of domestic delivery points for the OA
Figure 2. Deriving AWD for an OA (boundaries and postcodes Crown Copyright)
4. Case Studies
A series of case studies have been excised to test the feasibility and pragmatics of the proposed approach. Average weighted Distances (AWD) are computed and mapped for various UK districts by OA. Investigation is particularly carried out for the correlations and patterns of spatial accessibilities based on different distance measures. Local inequality could then be assessed in term of the chosen spatial accessibility.
Distance measures examined in the following case studies include Euclidean distance, network distance and attributed network distance (or travel cost). Attributed network distance here is calculated as travel time which takes into account speed limit, congestion level and other impedances. The input data are mainly from NHS (i.e. GP data and pharmacy data), Ordnance Survey (i.e. CodePoint) and ONS (i.e. MYE population). Network geometry is available from OS ITN data and further attributes from NAVTEQ routing.
only small to medium sized towns. Milton Keynes is a district with nearly half rural area and half urban area. Wellingborough is a rural district with a large town. All case study areas will be buffered to overcome boundary effect. In the other word, residents could cross administrative boundary to reach nearer social services/facilities. A 2.5km buffer zone is created for Haringey and a 5km buffer zone is created for Uttlesford. A 10km buffer zone is created for both Milton Keynes and Wellingborough, as these two districts are adjacent to each other. The size of buffer zone is mainly based on the consideration of population density and geometric shape.
4.1 Case study for AWD to local pharmacies in Haringey and
Uttlesford
Two case study areas are selected: London borough of Haringey and Uttlesford district. Pharmacy is selected as the social facility for modelling accessibility. There are 4738 postcode units in Haringey and 185 pharmacies within 2.5km buffered boundary while 2631 postcode units in Uttlesford and 26 pharmacies within 5km buffered boundary.
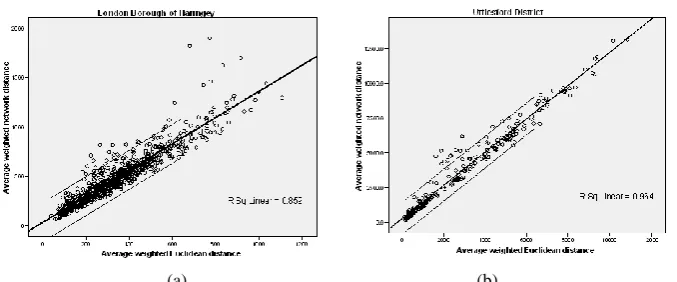
As illustrated in Figure 3, Euclidean distances can be rapidly calculated using GIS whilst network distances need more editing and higher computational loads. It takes approximate 8 hours for Haringey and 2 hours for Uttlesford to calculated network distance from each CodePoint delivery centroid to the nearest pharmacy. AWDs are then computed based on Euclidean and network distances by OA. The exact lengths are of course different for Euclidean-based AWD and network-based AWD. The median percentage difference is 28% (130m) for Haringey and 21% (670m) for Uttlesford. However, there are strong correlations between these two types of distance measures where coefficient is 0.936 for Haringey and 0.981 for Uttlesford (see Fig 4 for regression models). Such strong correlation supports the concept that AWD based on Euclidean distance can provide an acceptable relative measure, which aims to develop a straightforward approach for rapid assessments.
Although correlations and regressions are generally strong (consist with the earlier test). In the up-right part of Fig.4 (a), there are 4 dots noticeably beyond the 95% confident line. They correspond to 4 OAs in south-east of Haringey, which are marked by yellow colour in Fig.5 (a). The zoom-in map of Fig.5 (b) shows that these 4 OAs is a relatively isolated community with only one way-out road to the nearest pharmacy according to OS ITN data.
Euclidean-based AWD and network based-AWD result in very similar spatial patterns in both Haringey and Uttlesford. Such similar patterns will make no difference on decision-making in social infrastructure planning.
Thus if a local GP consortium wishes to evaluate filling the gaps in accessibility to commercial pharmacies, with Euclidean-based AWD, it can rapidly ‘what-if’ model additional pharmacies attached to existing surgeries.
(a) (b)
[image:11.595.56.398.166.458.2](c) (d)
(a) (b) Figure 3. Regression between Euclidean-based AWD and network-based AWD (a) London Borough of Haringey, (b) Uttlesford District.
(a) (b)
Figure 4. (a) Haringey by OA, (b) the 4 OAs corresponding to 4 outliers in regression
[image:12.595.65.387.248.386.2](c) (d) Figure 5. Spatial accessibility to local pharmacies
(a) Euclidean-based AWD for Haringey, (b) network-based AWD for Haringey, (c) Euclidean-based AWD for Uttlesford, (d) network-based AWD for Uttlesford. (boundaries Crown Copyright)
4.2 Case study for AWD to local GP surgeries in Haringey,
Milton Keynes and Wellingborough
Here are three case study areas which are London borough of Haringey, Milton Keynes district and Wellingborough district. GP surgery represents the social facility in accessibility modelling. Haringey has 4738 postcode units with 92 GP surgeries within 2.5km buffered boundary, Milton Keynes and Wellingborough have 8893 postcode units with 130 GP surgeries within 10km buffered boundary.
For each OA, AWDs are computed by Euclidean distance, network distance, driving time by car and driving time by ambulance. All distances are calculated from each CodePoint delivery centroid to the nearest GP surgery in three case study areas. Correlation and spatial pattern are then studied between AWD based on Euclidean distance and AWDs based on other types of travel cost.
Table 2 shows very strong correlations between Euclidean and network distances, Euclidean distance and driving time by car, Euclidean distance and driving time by ambulance. Furthermore, Table 3 confirms very strong correlations between Euclidean-based and network-based AWDs, Euclidean-based and car-based AWDs, Euclidean-based and ambulance-basded AWDs. Again, slight stronger correlation can be seen in rural area. These results are consistent with the case study in 4.1.
all 3 districts, similar spatial patterns can be found for Euclidean-based AWD, network-based AWD, car-based AWD and ambulance-based AWD. Having considered more complex travel cost (i.e. driving time by car and ambulance), Euclidean-based AWD is still the preferred spatial accessibility measure for this case study.
Table 2. Correlation between Euclidean distance and other distances Study Area Euclidean &
network distances
Euclidean distance & driving time by car
Euclidean distance & driving time by ambulance
Haringey 0.905 0.870 0.875
Milton Keynes 0.943 0.921 0.919
[image:14.595.55.407.233.568.2]Wellingborough 0.962 0.924 0.908
Table 3. Correlation between Euclidean-based AWD and other AWDs Study Area Euclidean & network
based AWDs
Euclidean & car based AWDs
Euclidean & ambulance based AWDs
Haringey 0.924 0.902 0.903
Milton Keynes 0.951 0.945 0.935
Wellingborough 0.967 0.924 0.904
(a) (b)
(c) (d) Figure 6. Spatial accessibility to local GP surgeries in Haringey (a) Euclidean-based AWD, (b) network-based AWD,
(a) (b)
[image:15.595.83.373.74.323.2]
(c) (d)
Figure 7. Spatial accessibility to local GP surgeries in Milton Keynes and Wellingborough (a) Euclidean-based AWD, (b) network-based AWD,
(c) car-based driving AWD, (d) ambulance-based driving AWD. (boundaries Crown Copyright)
5. Conclusion
6. REFERENCES
Brimicombe, A.J. and Y. Li, 2009, “Evidencing population change for sustainable community”, Urban Design and Planning, 162, p. 159-167.
Dusheiko, M., P.J. Halls and W. Richards, 2009, “The effect of travel distance on patient non-attendance at hospital outpatient appointment: a comparison of straight line and road distance measures”, in: GISRUK2009, Durham University, p. 1 – 5.
Ertugay, K. and S.H. Duzgun, 2015, “Understanding Accessibility: Accessibility Modelling with Geographic Information Syatems (GIS). Using Decision Support Systems for Transportation Planning Efficiency”, in: Ocalir-Akunal (eds.) Engineering Science Reference, p. 223-257
Ford, A.C., L.S. Barr, R.J. Dawson and P. James, 2015, “Transport Accessibility Analysis Using GIS: Assessing Sustainable Transport in London”, in: Etingoff (eds.) Urban Development for the 21st Century: Managing Resources and Creating Infrastructure, APA, CRC, p. 201-235.
Guagliardo, M.F., 2004, “Spatial accessibility of primary care: concepts, methods and challenges”, International Journal of Health Geographics, 3(1), p. 1-13.
Guagliardo, M.F., C.R. Ronzio, I. Cheung, E. Chacko and J.G. Joseph, 2004, “Physician accessibility: an urban case study of paediatric primary care”, Health and Place, 10(3), p. 273-83.
Gutierrez, J. and J.C. Garcia-Palomares, 2008, “Distance-measure impacts on the calculation of transport services using GIS”, Environment and Planning B: Planning and Design, 35, p. 480-503.
Heywood, I., S. Cornelius and S. Carver, 2011, An Introduction to Geographical Information Systems, Prentice-Hall.
HUDU, 2007, Health and Urban Planning Toolkit, NHS Healthy Urban Development Unit, London.
Liu, S. and X. Zhu, 2004, “Accessibility Analyst: an integrated GIS tool for accessibility analysis in urban transportation planning”, Environment and Planning B: Planning and Design, 31, p. 105-124.
McGrail, M.R., 2012, “Spatial accessibility of primary health care utilising the two step floating catchment area method: an assessment of recent improvements”, International Journal of Health Geographics, p. 11: 50.
Munoz, U.H. and C. Kallestal, 2012, “Geographical accessibility and spatial coverage modeling of the primary health care network in the Western Province of Rwanda”,
International Journal of Health Geographics, p. 11-40.
Ohta, K., G. Kobashi, S. Takano, S. Kagaya, H. Yamada, H. Minakami and E. Yamamura, 2007, “Analysis of the geographical accessibility of neurosurgical emergency hospitals in Sapporo city using GIS and AHP”, International Journal of Geographical Information Science, 21(6), p. 687-698.
O’Sullivan, D., A. Morrison and J. Shearer, 2000, “Using desktop GIS for the investigation of accessibility by public transport: an isochrone approach”, International Journal of Geographical Information Science, 14(1), p. 85-104.
Rouse, W.B. and N. Serban, 2014, Understanding and Managing the Complexity of Healthcare, The MIT Press.
Schuurman, N., M. Berube and V.A. Crooks, 2010, “Measuring potential spatial access to primary health care physicians using a modified gravity model”, The Canadian Geographer, 54(1), p. 29–45.