Citation:
Gonzalez, JT and Frampton, J and Deighton, K (2016) Postprandial suppression of appetite is more reproducible at a group than an individual-level: implications for assessing inter-individual variability. Appetite, 108. pp. 375-382. ISSN 0195-6663 DOI: https://doi.org/10.1016/j.appet.2016.10.032 Link to Leeds Beckett Repository record:
http://eprints.leedsbeckett.ac.uk/3200/
Document Version: Article
The aim of the Leeds Beckett Repository is to provide open access to our research, as required by funder policies and permitted by publishers and copyright law.
The Leeds Beckett repository holds a wide range of publications, each of which has been checked for copyright and the relevant embargo period has been applied by the Research Services team.
We operate on a standard take-down policy. If you are the author or publisher of an output and you would like it removed from the repository, please contact us and we will investigate on a case-by-case basis.
Postprandial suppression of appetite is more reproducible at a group 1
than an individual-level: implications for assessing inter-individual 2
variability 3
4
Javier T. Gonzalez1, James Frampton1 and Kevin Deighton2. 5
6
1Department for Health, University of Bath, Bath, United Kingdom. 7
2Institute for Sport, Physical Activity & Leisure, Leeds Beckett University, 8
Leeds, United Kingdom. 9
10
Running head: Variability in appetite measurement 11
12
Corresponding author 13
Javier T. Gonzalez 14
Department for Health, University of Bath, Bath, BA2 7AY, United Kingdom. 15
E-mail: [email protected] 16
17
Acknowledgements 18
All authors contributed to the conception and design of the study, collection, 19
analysis and interpretation of data. J.T.G drafted the manuscript and all 20
authors approved the final version of the manuscript. This research did not 21
receive any specific grant from funding agencies in the public, commercial or 22
not-for-profit sectors. Data collection at Leeds Beckett University was 23
supported internally by the Carnegie Research Fund. The authors declare no 24
26
Abstract 27
Individual differences in appetite are increasingly appreciated. However, the 28
individual day-to-day reliability of appetite measurement is currently 29
uncharacterised. This study aimed to assess the reliability of appetite following 30
ingestion of mixed-macronutrient liquid meals at a group- and individual-level. 31
Two experiments were conducted with identical protocols other than meal 32
energy content. During each experiment, 10 non-obese males completed four 33
experimental trials constituting high- and low-energy trials, each performed 34
twice. Experiment one employed 579 kJ (138 kcal) and 1776 kJ (424 kcal) liquid 35
meals. Experiment two employed 828 (198 kcal) and 4188 kJ (1001 kcal) liquid 36
meals. Visual analogue scales were administered to assess appetite for 60 min 37
post-ingestion. The typical error (standard error of measurement) of appetite 38
area under the curve was 6.2 mm60 min-1 (95%CI 4.3 to 11.3 mm60 min-1), 6.5
39
mm (95%CI 4.5 to 11.9 mm60 min-1), 7.1 mm60 min-1 (95%CI 4.9 to 12.9 mm60
40
min-1) and 6.5 mm60 min-1 (95%CI 4.5 to 11.8 mm60 min-1) with the 579, 828,
41
1776 and 4188 kJ meals, respectively. A systematic bias between first and 42
second exposure was detected for all but the 4188 kJ meal. The change in 43
appetite with high- vs. low-energy meals did not differ at a group level between 44
first and second exposure (mean difference: -0.97 mm60 min-1; 95%CI -6.48 to
45
4.53 mm60 min-1), however, ~50% of individuals differed in their response with
46
first vs second exposure by more than the typical error. Appetite responses are 47
more reliable when liquid meals contain a higher- vs lower-energy content. 48
group- but not individual-level, suggesting that multiple exposures to an 50
intervention are required to understand true individual differences in appetite. 51
Introduction 53
Understanding the regulation of appetite in humans can assist in the 54
development of strategies to prevent and/or treat disorders of energy balance 55
such as obesity. Subjective sensations of appetite are commonly captured 56
using visual analogue scales (VAS), typically comprised of questions 57
attempting to assess perceptions of hunger, fullness, satisfaction and 58
prospective food consumption [1]. The methodology of administering these 59
scales before, and at regular intervals after the consumption of 60
meals/beverages, is supported as a standard and accepted tool to substantiate 61
claims relating to the effects of foods on feeling states and motivations to eat 62
[1]. In addition to assessing the effects of meal composition on appetite [2-6], 63
these methods have also been applied more widely, to assess the effects of 64
other interventions (such as acute [7-10] or chronic exercise [11], food 65
restriction [7, 9] and environmental conditions [12]) on the subjective appetite 66
response to a standard food or beverage. 67
68
Quantifying the day-to-day variability of a measure provides greater confidence 69
on whether an intervention is the cause of an observed effect, as opposed to 70
random (biological or behavioural) variability, measurement error or systematic 71
bias [13, 14]. The day-to-day reliability of appetite perceptions in response to a 72
meal - expressed as a coefficient of variation - has previously been reported to 73
be in the range of 7 to 28%, in healthy, lean men [15-17]. The typical error 74
(standard error of measurement) has been reported to be in the range of 8 to 75
13 mm120 min-1 [17].
76
Mixed-macronutrient liquid meals are commonly used in appetite research as 78
“preloads” prior to ad libitum test meals, and covert manipulation of their energy 79
content is used to assess the “sensitivity” of appetite regulation [18]. Moreover, 80
liquid meals may produce more reliable appetite responses than semi-81
solid/solid meals [15-17]. Therefore, understanding the reliability of liquid meals 82
with differing energy content is required in order to prescribe an appropriate 83
preload energy content to detect subtle differences in appetite perceptions. 84
However, it cannot necessarily be assumed that a measure shown to be reliable 85
under one condition results in a reliable change in response to an intervention. 86
For example, the measurement of appetite could be reproducible in response 87
to a meal with a given energy content, but this does not provide insight into the 88
reliability of the suppression of appetite with high- vs low-energy preloads. 89
90
With the growth of personalised approaches to nutrition and medicine [19], an 91
increasing number of studies in the area of energy balance and appetite have 92
attempted to understand the inter-individual differences in response to an 93
intervention [20-25]. Whilst there is an increasing acknowledgement that 94
measurement error needs to be considered in the interpretation of individual 95
responses, there is still a common assumption that these individual responses 96
are replicable. For example, an individual described as a “low responder” upon 97
the first exposure to an intervention will remain a “low responder” upon repeated 98
exposure to an intervention. It has therefore been suggested that to directly 99
assess within-subject variability in response to an intervention, repeated 100
exposure with an adequate washout is required [26]. Indeed, this appears to be 101
of exercise is not consistent enough to classify “compensators” and “non-103
compensators” [27]. The reliability of individual appetite responses to preloads 104
(inducing appetite suppression by nutrition) has never been documented. 105
106
The present study aimed to investigate the day-to-day reliability of appetite 107
perceptions in response to mixed-macronutrient liquid meals differing in energy 108
content. In addition, by capitalising on repeated exposure to high and low-109
energy containing meals, it was also possible to assess both inter-individual 110
variability and within-subject variability in appetite suppression with high-energy 111
meals. 112
113
Methods 114
Study design 115
The data reported in this investigation are taken from two experiments 116
previously described [28], which were both conducted according to the 117
guidelines in the Declaration of Helsinki. 118
119
Both experiments involved a preload study design to investigate the influence 120
of ad libitum meal composition on the compensatory energy intake response to 121
different energy preloads. Both studies followed identical procedures, other 122
than the energy content of the preloads. Here, the individual data have been 123
rearranged to visit order to assess the day-to-day variability in appetite 124
responses to mixed-macronutrient meals differing in energy content but 125
matched for macronutrient composition and ingredients used. As previously 126
and utilised liquid meals containing a low (579 kJ; 138 kcal) and a moderate-128
energy content (1776 kJ; 424 kcal). Experiment two was conducted at Leeds 129
Beckett University (UK) and utilised liquid meals containing a low- (828 kJ; 198 130
kcal) and a high-energy content (4188 kJ; 1001 kcal). The use of different 131
energy contents enabled comparisons to be made regarding the reliability of 132
subjective appetite measures in response to liquid meals of increasing energy 133
content. Each experiment was approved by the respective Institutional Ethics 134
Advisory Committee for the university at which experimental testing was 135
performed, and informed written consent was obtained from all participants. 136
137
Participants and standardisation 138
All participants were non-smokers, weight stable for at least six months before 139
participation and were not dieting or taking any medication. Participants had no 140
known history of cardiovascular or metabolic disease, were classified as 141
unrestrained eaters [29] and self-reported as recreationally active (engaging in 142
structured exercise or sport 3 times/week). Participant characteristics have 143
been previously reported [28] and are repeated for clarity. In experiment one 144
the mean age, stature, body mass and body mass index were 22 ± 1 y, 1.80 ± 145
0.06 m, 81.1 ± 7.9 kg and 24.8 ± 1.6 kg/m2, respectively. In experiment two, the 146
mean age, stature, body mass and body mass index were 21 ± 4 y, 1.80 ± 0.05 147
m, 77.2 ± 6.4 kg and 24.2 ± 2.3 kg/m2, respectively. 148
149
Diet and physical activity were standardised for 24 h prior to all trials by self-150
and strenuous physical activity during this period. All trials commenced 152
between 0800 and 0900 following an overnight fast (≥ 10 h). 153
154
Experimental protocol 155
At each testing location, 10 healthy men completed four experimental trials in 156
a randomized (using online software: randomizer.org), double-blind, crossover 157
design separated by ≥72 h. The four trials consisted of the low- or 158
moderate/high-energy liquid meals each consumed on two occasions. 159
Anthropometric measures, screening for eating behaviours [29] and self-160
reported habitual physical activity levels were obtained immediately before the 161
first experimental trial. 162
163
Upon arriving at the laboratory for experimental trials, participants completed 164
baseline visual analogue scales (VAS) to assess subjective appetite ratings 165
before consuming the mixed-macronutrient liquid meal within a 5 min period. 166
During the 60 min post-consumption, participants remained in the laboratory 167
(seated and permitted to read or listen to music) whilst further VAS were 168
administered every 15 min to assess appetite sensations. Whilst participants 169
were not in isolation, any cues that could be seen to distort appetite perceptions 170
were prohibited, e.g. discussions or radio/television programmes about 171
food/appetite. 172
173
Liquid meals 174
Details of the mixed macronutrient liquid meals have been previously reported 175
but differed in energy content: 579 kJ (138 kcal) and 1776 kJ (424 kcal) in 177
experiment one and 828 kJ (198 kcal) and 4188 kJ (1001 kcal) in experiment 178
two. The macronutrient distribution was 58% carbohydrate, 26% fat, 16% 179
protein comprised of single cream (Tesco, UK), maltodextrin (MyProtein, UK), 180
whey protein isolate (MyProtein, UK), vanilla flavouring (MyProtein, UK) and 181
tap water. The mass of each liquid meal was 550 g. All meals were consumed 182
by participants in isolation. The meals were prepared by a third party external 183
to the experimental trials in an attempt to ensure blinding was successful. We 184
previously reported that participants were unaware of the energy content of the 185
liquid meals [28]. 186
187
Appetite assessment 188
Appetite sensations (hunger, fullness, satisfaction and prospective food 189
consumption) were assessed at baseline and every 15 min following meal 190
ingestion using 100 mm VAS with descriptors anchored at each end describing 191
extremes (e.g. “I am not hungry at all” to “I have never been more hungry”)[15]. 192
Participants rated their appetite by placing a vertical line intersecting each 193
horizontal line on paper and previous ratings were hidden to prevent the 194
influence of a prior rating on subsequent reporting. The VAS were analysed by 195
measuring the horizontal distance from the left-hand side of the scale to the 196
vertical line indicated by the participant. Each VAS was analysed twice to 197
maintain accuracy. A composite appetite score (herein referred to as “appetite” 198
alone) was calculated for each time-point as previously described [30]. 199
200
Data were analysed using Prism v7 (Graphpad Software, CA) and Excel 202
v14.6.6 (Microsoft, WA) and are presented as means ± SD unless otherwise 203
indicated. VAS ratings were converted into time-averaged area under the curve 204
(AUC) values. Values are reported as 1) the absolute AUC, to compare the 205
reliability across the different absolute energy content of meals; 2) as the satiety 206
quotient (using μm rather than mm to equate to whole numbers [31]): 207
Satiety Quotient = baseline appetite (μm)-postprandial appetite AUC (μm) energy content of meal (kJ)
208
and 3) as the difference between the moderate/high energy meals compared 209
with the respective low-energy meals, to assess the reliability of appetite 210
suppression. Reliability at the group level was assessed using a variety of 211
statistical techniques [mean difference with 95% confidence intervals, typical 212
error (standard error of measurement) and Bland-Altman plots] [13, 14, 32]. 213
Coefficients of variation, expressed as a percentage (CV%) was also employed 214
to compare across meals of differing absolute energy content. To assess the 215
inter-individual variation in appetite suppression with high-energy vs low-energy 216
meals, the SD of the true individual response to high- vs low-energy meals 217
(SDR) was used [33, 34]. This was calculated as: 218
SDR= √SDI2- SDC2 219
where SDI is the SD of the difference between the high vs low-energy meals 220
(intervention), and SDC is the SD of the difference between the first and second 221
exposure of the low energy meals (control). The SDR was presented in both 222
absolute units (mm60 min-1) with 95% CI [35], and also in text as standardised,
223
using the baseline SD [34]. Paired t-tests were used to identify differences in 224
226
Results 227
Absolute energy content of liquid meals 228
No differences in appetite perceptions were detected prior to ingestion of the 229
drinks in either study (70 ± 12, 77 ± 10, 72 ± 11 and 74 ± 10 mm for 579 kJ visit 230
one, 579 kJ visit two, 1776 kJ visit one and 1776 kJ visit two, and 72 ± 9, 77 ± 231
7, 72 ± 10 and 74 ± 9 mm for 828 kJ visit one, 828 kJ visit two, 4188 kJ visit 232
one and 4188 visit two, respectively; p = 0.273 for between trial and p = 0.726 233
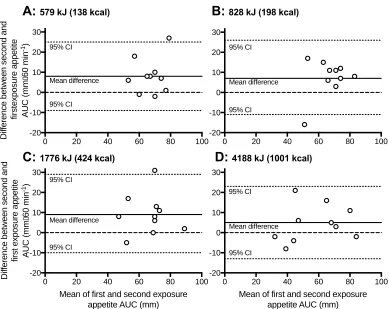
for between testing site comparisons). A systematic bias between the first and 234
second exposure was detected for appetite AUC in response to meals with an 235
energy content of 579 kJ (138 kcal) (p = 0.02), 828 kJ (198 kcal) (p = 0.03) and 236
1776 kJ (424 kcal) (p = 0.02), whereby higher appetite ratings were reported 237
with the second exposure compared to the first exposure (Table 1; Figures 1A, 238
1B and 1C). In contrast, no systematic bias was apparent between the first and 239
second exposure with the 4188 kJ (1001 kcal) meal (p = 0.2; Table 1; Figure 240
1D). When expressed in absolute units, typical errors were comparable 241
between meals of different energy content (Table 1). However, when the satiety 242
quotient was employed, the typical errors were higher with low-energy meals, 243
compared to higher energy meals (Table 1). 244
245
Reliability of appetite suppression with moderate and large differences in 246
energy content 247
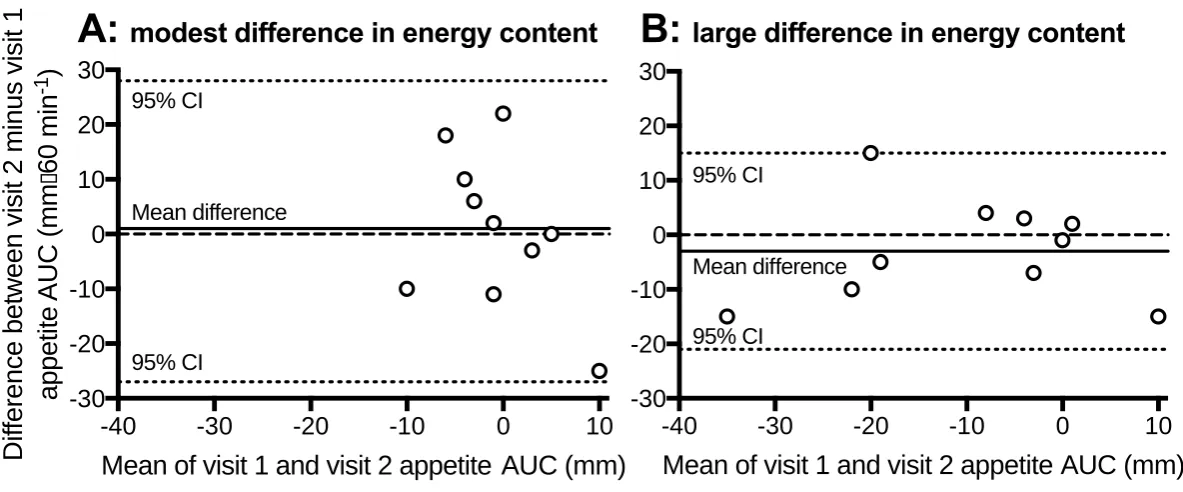
With a moderate difference in meal energy content (1197 kJ; 286 kcal), the 248
change in appetite AUC was –1.1 ± 10.9 and -0.2 ± 6.9 mm60 min-1with the first
249
between the first and second exposure was 0.95 mm60 min-1 (95% CI -9.10 to
251
11.00 mm60 min-1), indicating that there was not a systematic bias with the first,
252
compared to the second exposure (Figure 2A). The typical error for appetite 253
AUC with a moderate difference in meal energy content was 9.9 mm60 min-1
254
(95% CI 6.8 to 18.1 mm60 min-1), which was similar to the typical error of
255
hunger, fullness, satisfaction and prospective consumption AUCs (Table 2). 256
257
With a large difference in meal energy content (3360 kJ; 803 kcal), the change 258
in appetite AUC was -8.3 ± 13.8 and -11.2 ± 14.8 mm60 min-1, with the first and
259
second exposure, respectively. The mean difference between the first and 260
second exposure was -2.90 mm60 min-1 (95% CI -9.53 to 3.73 mm60 min-1),
261
which suggests there was not a systematic bias between the first compared to 262
the second exposure (Figure 2B). The typical error with a large difference in 263
meal energy content was 6.6 mm60 min-1 (95%CI 4.5 to 12.0 mm60 min-1),
264
which was similar to the typical error of hunger, fullness, satisfaction and 265
prospective consumption AUCs (Table 2). 266
267
Inter-individual variability 268
When data were combined from the two studies, the difference in the appetite 269
AUC between moderate/high vs low energy liquid meals was -4.73 mm60 min
-270
1 (95% CI -10.66 to 1.21 mm60 min-1) with the first exposure (Figure 3). The
271
SDR for appetite AUC upon first exposure to high- vs low-energy meals was 9.4 272
mm60 min-1 (95% CI 7.4 to 12.9 mm60 min-1; 1.1 in standardised units, 95% CI
273
0.8 to 1.5). When participants were exposed to the two meals for a second time, 274
was -5.7 mm60 min-1 (95% CI -11.6 to 0.2 mm60 min-1), which at a group level
276
did not differ from the first exposure [mean difference = -0.97 mm60 min-1
277
(95%CI -6.48 to 4.53 mm60 min-1); p = 0.71) and the SDR was similar to the first
278
exposure (9.2 mm60 min-1, 95% CI 7.3 to 12.7 mm60 min-1; standardized units:
279
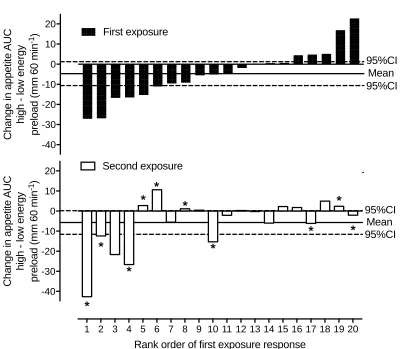
1.0, 95% CI 0.8 to 1.4). However, when individual data are presented, there is 280
a large variability in individual responses to the first and second exposure 281
(Figure 3). For example, 10 of the 20 participants (50%) display a response to 282
the second exposure that differs from the first exposure by more than the typical 283
error. 284
285
Upon first exposure, the mean difference in ratings of hunger, fullness, 286
satisfaction and prospective consumption with high vs low energy meals were 287
-4.29 mm60 min-1 (95% CI -10.81 to 2.24 mm60 min-1), 5.72 mm60 min-1 (95%
288
CI -0.22 to 11.67 mm60 min-1), 2.83 mm60 min-1 (95% CI -5.6 to 11.26 mm60
289
min-1) and -6.09 mm60 min-1 (95% CI -12.04 to -0.15 mm60 min-1), respectively.
290
With the second exposure, the mean difference in ratings of hunger, fullness, 291
satisfaction and prospective consumption were -7.03 mm60 min-1 (95% CI
-292
14.64 to 0.59 mm60 min-1), 5.74 mm60 min-1 (95% CI -0.36 to 11.84 mm60 min
-293
1), -4.10 mm60 min-1 (95% CI -2.00 to 10.36 mm60 min-1) and -5.71 mm60 min
-294
1 (95% CI -11.26 to -0.16 mm60 min-1), respectively. The mean differences in
295
hunger, fullness, satisfaction and prospective consumption did not differ with 296
the first exposure compared with the second exposure (p = 0.4, >0.9, 0.7 and 297
0.9, respectively). However, there were large differences in the individual 298
differs from the first exposure by more than the typical error (Supplementary 301
Figures 3A, 3B, 3C and 3D). 302
303
Discussion 304
In the present study, we provide novel data demonstrating that the consumption 305
of liquid meals with a higher energy content produces more reliable appetite 306
responses compared with lower energy liquid meals. In addition, we 307
demonstrate that the suppression of appetite by high- vs low-energy liquid 308
meals is reproducible at the group level but not at an individual level. This 309
suggests that repeated exposure to an intervention is required in order to 310
assess true individual appetite responses. 311
312
Quantifying the day-to-day reliability of appetite perceptions in response to 313
liquid meal ingestion can assist in the study design of future trials and 314
interpretation of previous trials. The typical error of appetite AUC in response 315
to ingestion of mixed-macronutrient semi-solid meals (1859 kJ; 444 kcal) by 316
young healthy men has previously been reported to be in the region of 8.3 to 317
12.6 mm120 min-1 [17]. In the present study, the typical errors ranged from 6.2
318
to 7.1 mm60 min-1 between the liquid meals of differing energy content. It has
319
previously been suggested that, compared with the ingestion of solid/semi-solid 320
meals, the ingestion of liquid meals result in a more consistent metabolic and 321
appetite response due to fewer sites where biological variation can act [17]. The 322
energy content did not appear to influence the typical error in absolute terms, 323
although there was a systematic bias detected for low and moderate-energy 324
to the meals containing 579 kJ (138 kcal), 828 kJ (198 kcal) and 1776 kJ (424 326
kcal) energy, which could result in an order effect in intervention studies. In 327
contrast, there was no systematic bias detected between the first and second 328
exposure to the meal containing 4188 kJ (1001 kcal) energy. Due to matching 329
for total volume, the high-energy liquid meals would likely be more viscous than 330
lower-energy meals in this study. However, it has previously been 331
demonstrated that viscosity of liquid meals does not alter the subjective appetite 332
responses to ingestion [36], and therefore the differences in viscosity between 333
test-drinks are unlikely to have influence the findings in the present study. On 334
the other hand, the higher palatability of the highest-energy liquid meal [28] 335
could potentially explain the lack of systematic bias and greater reliability with 336
higher vs lower-energy meals by eliciting stronger cognitive responses upon 337
ingestion. Finally, the high-energy meal would likely perturb physiological 338
signals to a greater extent than lower energy meals which would be more 339
robustly detected by central appetite systems and manifest as more reliable 340
appetite responses. This suggests that interventions aiming to assess the 341
appetite response to a fixed preload should utilise a relatively high energy 342
content. If a low energy meal or preload is desired, then a familiarisation trial 343
may reduce or remove an order effect and researchers should ensure that the 344
trial order is counterbalanced. 345
346
The reliability of appetite suppression with higher- relative to lower-energy 347
containing meals, often used to assess appetite sensitivity, appeared to be 348
dependent on the difference in energy content between the meals. For 349
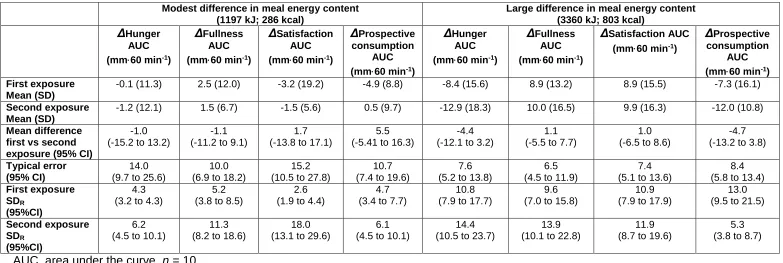
satisfaction and prospective consumption) ranged from 10.0 to 15.2 mm60 min
-351
1 with a modest difference in energy content (1197 kJ; 286 kcal; Table 2),
352
compared to a range of 6.5 to 8.4 mm60 min-1 with a large difference in energy
353
content (3360 kJ; 803 kcal; Table 2). This was reflected in the typical error of 354
the composite appetite AUC which was ~33% higher with the modest difference 355
in energy content vs the large difference in energy content. 356
357
In order to assess the reliability of individual responses, data were combined 358
from the two experiments. The different energy content in the meals provided 359
by each experiment does not preclude this analysis, since this is still a within-360
subject comparison and the typical error to assess whether individual 361
responses were reliable was specific to each experiment. Therefore the overall 362
conclusion of this approach (appetite responses were reliable at the group but 363
not individual level) is identical whether each experiment is considered in 364
isolation (Supplementary Figures 1 and 2), or in combination (Figure 3). 365
366
When data were combined from both experiments, the suppression of appetite 367
with higher- relative to lower-energy containing meals was reproducible at a 368
group level when comparing the first exposure to the second exposure, as 369
demonstrated by a small mean difference (<1 mm60 min-1) relative to the
370
magnitude of appetite suppression (~5 mm60 min-1). There was large
inter-371
individual variation in the suppression of appetite (Figure 3), with the 372
characteristic spread of responses seen when normally-distributed data are 373
plotted in rank order [26, 33]. However, when individual responses to the 374
suppression are not reproducible with ~50% of participants displaying a 376
response to the second exposure that differs from the first exposure by more 377
than the typical error for that meal (Figure 3). This is a consistent observation 378
across hunger, fullness, satisfaction and prospective consumption 379
(Supplementary Figures 3A, 3B, 3C and 3D) and also consistent with literature 380
on the effect of exercise on individual appetite responses [27]. It is noteworthy 381
that the individuals demonstrating the least reliable response with repeated 382
exposure tend to cluster at the ends of the rank order as the “highest” and 383
“lowest” responders, which supports the possibility that regression to the mean 384
is contributing to this lack of consistent individual response [37]. These data 385
suggest studying true individual variability in appetite regulation using mixed-386
macronutrient liquid meals is not possible without repeated exposure to the 387
same intervention/stimulus. This study assessed the acute individual reliability 388
of appetite responses, and therefore the sustained effect after repeated 389
exposure remains currently unknown. In a chronic intervention, a pre-post 390
comparison is (non-exclusively) influenced by 1) variability in measurement at 391
baseline; 2) variability in measurement at follow-up and 3) variability in the “true” 392
response to the intervention. The variability at each of these stages 393
independently influences the ability to detect the true effect of an intervention. 394
This study is representative of baseline testing in a chronic intervention and 395
therefore the lack of reliability at an individual-level would negatively impact on 396
the ability to identify true responders and non-responders to a longer-term 397
intervention and is, if anything, a conservative estimate on the variability with a 398
longer-term intervention. Accordingly, labeling individuals as responders vs 399
investigations into the characteristics of these individuals warrants caution as 401
the participants may not respond to an intervention in the same direction with 402
repeated exposures. 403
404
In conclusion, liquid meals containing a high-energy content (4188 kJ; 1001 405
kcal) produce a more reliable appetite response compared to lower energy 406
liquid meals (≤1776 kJ; ≤424 kcal). The appetite suppression induced by higher 407
vs lower energy meals is reliable at the group level, but not at the individual 408
level. Therefore, in order to understand individual appetite responses, repeated 409
exposure to a given intervention is required. 410
411
Acknowledgements 412
All authors contributed to the conception and design of the study, collection, 413
analysis and interpretation of data. J.T.G drafted the manuscript and all 414
authors approved the final version of the manuscript. This research did not 415
receive any specific grant from funding agencies in the public, commercial or 416
not-for-profit sectors. Data collection at Leeds Beckett University was 417
supported internally by the Carnegie Research Fund. The authors declare no 418
References
1. Blundell J, de Graaf C, Hulshof T, Jebb S, Livingstone B, Lluch A, Mela D, Salah S, Schuring E, van der Knaap H, Westerterp M: Appetite control: methodological aspects of the evaluation of foods. Obes Rev 2010, 11:251-270.
2. Gonzalez JT, Rumbold PLS, Stevenson EJ: Appetite sensations at rest, during exercise and recovery: impact of a high-calcium meal.
Applied Physiology Nutrition and Metabolism 2013, 38:1260-1267. 3. Gonzalez JT, Stevenson EJ: Postprandial glycemia and appetite
sensations in response to porridge made with rolled and pinhead oats. J Am Coll Nutr 2012, 31:111-116.
4. Gonzalez JT, Stevenson EJ: Calcium co-ingestion augments postprandial glucose-dependent insulinotropic peptide1-42,
glucagon-like peptide-1 and insulin concentrations in humans. Eur J Nutr 2014, 53:375-385.
5. Gonzalez JT, Green BP, Brown MA, Rumbold PL, Turner LA, Stevenson EJ: Calcium ingestion suppresses appetite and
produces acute overcompensation of energy intake independent of protein in healthy adults. J Nutr 2015, 145:476-482.
6. Astbury NM, Stevenson EJ, Morris P, Taylor MA, Macdonald IA: Dose-response effect of a whey protein preload on within-day energy intake in lean subjects. Br J Nutr 2010, 104:1858-1867.
7. Gonzalez JT, Veasey RC, Rumbold PL, Stevenson EJ: Breakfast and exercise contingently affect postprandial metabolism and energy balance in physically active males. Br J Nutr 2013, 110:721-732. 8. Alajmi N, Deighton K, King JA, Reischak-Oliveira A, Wasse LK, Jones
J, Batterham RL, Stensel DJ: Appetite and Energy Intake
Responses to Acute Energy Deficits in Females versus Males.
Med Sci Sports Exerc 2016, 48:412-420.
9. Deighton K, Batterham RL, Stensel DJ: Appetite and gut peptide responses to exercise and calorie restriction. The effect of modest energy deficits. Appetite 2014, 81:52-59.
10. Deighton K, Barry R, Connon CE, Stensel DJ: Appetite, gut hormone and energy intake responses to low volume sprint interval and traditional endurance exercise. Eur J Appl Physiol 2013, 113: 1147-1156.
11. Martins C, Kulseng B, King NA, Holst JJ, Blundell JE: The effects of exercise-induced weight loss on appetite-related peptides and motivation to eat. J Clin Endocrinol Metab 2010, 95:1609-1616. 12. Bailey DP, Smith LR, Chrismas BC, Taylor L, Stensel DJ, Deighton K,
Douglas JA, Kerr CJ: Appetite and gut hormone responses to moderate-intensity continuous exercise versus high-intensity interval exercise, in normoxic and hypoxic conditions. Appetite 2015, 89:237-245.
13. Atkinson G, Nevill AM: Statistical methods for assessing
measurement error (reliability) in variables relevant to sports medicine. Sports Med 1998, 26:217-238.
15. Flint A, Raben A, Blundell JE, Astrup A: Reproducibility, power and validity of visual analogue scales in assessment of appetite sensations in single test meal studies. International Journal of Obesity and Related Metabolic Disorders 2000, 24:38-48.
16. Raben A, Tagliabue A, Astrup A: The reproducibility of subjective appetite scores. Br J Nutr 1995, 73:517-530.
17. Gonzalez JT, Veasey RC, Rumbold PL, Stevenson EJ: Consistency of metabolic responses and appetite sensations under
postabsorptive and postprandial conditions. Appetite 2012. 18. Beaulieu K, Hopkins M, Blundell J, Finlayson G: Does Habitual
Physical Activity Increase the Sensitivity of the Appetite Control System? A Systematic Review. Sports Med 2016.
19. Betts JA, Gonzalez JT: Personalised nutrition: what makes you so special? Nutrition Bulletin Under Review.
20. Hopkins M, Blundell JE, King NA: Individual variability in
compensatory eating following acute exercise in overweight and obese women. Br J Sports Med 2014, 48:1472-1476.
21. King NA, Hopkins M, Caudwell P, Stubbs RJ, Blundell JE: Individual variability following 12 weeks of supervised exercise:
identification and characterization of compensation for exercise-induced weight loss. Int J Obes (Lond) 2008, 32:177-184.
22. Blundell JE, Stubbs RJ, Golding C, Croden F, Alam R, Whybrow S, Le Noury J, Lawton CL: Resistance and susceptibility to weight gain: individual variability in response to a high-fat diet. Physiol Behav 2005, 86:614-622.
23. King NA, Horner K, Hills AP, Byrne NM, Wood RE, Bryant E, Caudwell P, Finlayson G, Gibbons C, Hopkins M, et al: Exercise, appetite and weight management: understanding the compensatory responses in eating behaviour and how they contribute to variability in
exercise-induced weight loss. Br J Sports Med 2012, 46:315-322. 24. Jebb SA, Siervo M, Fruhbeck G, Goldberg GR, Murgatroyd PR,
Prentice AM: Variability of appetite control mechanisms in
response to 9 weeks of progressive overfeeding in humans. Int J Obes (Lond) 2006, 30:1160-1162.
25. Parr EB, Camera DM, Burke LM, Phillips SM, Coffey VG, Hawley JA:
Circulating MicroRNA Responses between 'High' and 'Low' Responders to a 16-Wk Diet and Exercise Weight Loss Intervention. PLoS One 2016, 11:e0152545.
26. Hecksteden A, Kraushaar J, Scharhag-Rosenberger F, Thiesen D, Senn S, Meyer T: Individual responses to exercise training - a statistical perspective. Journal of Applied Physiology 2015,
118:1450-1459.
27. Unick JL, O'Leary KC, Dorfman L, Thomas JG, Strohacker K, Wing RR: Consistency in compensatory eating responses following acute exercise in inactive, overweight and obese women. Br J Nutr 2015, 113:1170-1177.
28. Deighton K, Frampton J, Gonzalez JT: Test-meal palatability is
29. de Lauzon B, Romon M, Deschamps V, Lafay L, Borys JM, Karlsson J, Ducimetiere P, Charles MA, Fleurbaix Laventie Ville Sante Study G:
The Three-Factor Eating Questionnaire-R18 is able to distinguish among different eating patterns in a general population. J Nutr 2004, 134:2372-2380.
30. Anderson GH, Catherine NL, Woodend DM, Wolever TM: Inverse association between the effect of carbohydrates on blood glucose and subsequent short-term food intake in young men. American Journal of Clinical Nutrition 2002, 76:1023-1030.
31. Green SM, Delargy HJ, Joanes D, Blundell JE: A satiety quotient: a formulation to assess the satiating effect of food. Appetite 1997,
29:291-304.
32. Bland JM, Altman DG: Statistical methods for assessing agreement between two methods of clinical measurement. Lancet 1986,
1:307-310.
33. Atkinson G, Batterham AM: True and false interindividual
differences in the physiological response to an intervention. Exp Physiol 2015, 100:577-588.
34. Hopkins WG: Individual responses made easy. Journal of Applied Physiology 2015, 118:1444-1446.
35. Zar JH: Biostatistical Analysis. Upper Saddle River, NJ.: Prentice Hall; 1999.
36. McCrickerd K, Chambers L, Yeomans MR: Does modifying the thick texture and creamy flavour of a drink change portion size
selection and intake? Appetite 2014, 73:114-120.
Figure 1. Bland and Altman plot of the composite appetite area under the curve
(AUC) for 60 min following the ingestion of mixed-macronutrient liquid meals
with an energy content of 579 kJ (A; 138 kcal), 828 KJ (B; 198 kcal), 1776 kJ
(C; 424 kcal) and 4188 kJ (D; 1001 kcal).
0 20 40 60 80 100
-20 -10 0 10 20 30 D iff e re n c e b e tw e e n s e c o n d a n d f ir s te x p o s u re a p p e ti te A U C ( m m 6 0 m in -1) Mean difference 95% CI 95% CI
0 20 40 60 80 100
-20 -10 0 10 20 30
Mean of first and second exposure appetite AUC (mm)
D iff e re n c e b e tw e e n s e c o n d a n d fi rs t e x p o s u re a p p e ti te A U C ( m m 6 0 m in -1) Mean difference 95% CI 95% CI
0 20 40 60 80 100
-20 -10 0 10 20 30 Mean difference 95% CI 95% CI
0 20 40 60 80 100
-20 -10 0 10 20 30
Mean of first and second exposure appetite AUC (mm)
Mean difference
95% CI 95% CI
A: 579 kJ (138 kcal) B: 828 kJ (198 kcal)
Figure 2. Bland and Altman plot of suppression of composite appetite area under the curve (AUC) for 60 min following the ingestion
of mixed-macronutrient liquid meals differing in energy content by a modest (A; 1197 kJ; 286 kcal) or large (B; 3360 kJ; 803 kcal)
degree.
-40 -30 -20 -10 0 10
-30 -20 -10 0 10 20 30
Mean of visit 1 and visit 2 appetite AUC (mm)
D
iff
e
re
n
c
e
b
e
tw
e
e
n
v
is
it
2
m
in
u
s
v
is
it
1
a
p
p
e
ti
te
A
U
C
(
m
m
6
0
m
in
-1
)
Mean difference 95% CI
95% CI
-40 -30 -20 -10 0 10
-30 -20 -10 0 10 20 30
Mean of visit 1 and visit 2 appetite AUC (mm)
Mean difference
95% CI 95% CI
Figure 3. Individual responses in the change in composite appetite area
under the curve (AUC) for 60 min following ingestion of mixed-macronutrient
liquid meals with a higher- vs. a lower-energy content. *Response to second
exposure differs from the first exposure by more than the typical error.
-40 -30 -20 -10 0 10 20 C h a n g e i n a p p e ti te A U C h ig h l o w e n e rg y p re lo a d ( m m × 6 0 m in
-1) First exposure
Mean 95%CI
95%CI
1 2 3 4 5 6 7 8 9 10 11 12 13 14 15 16 17 18 19 20 -40 -30 -20 -10 0 10 20
Rank order of first exposure response
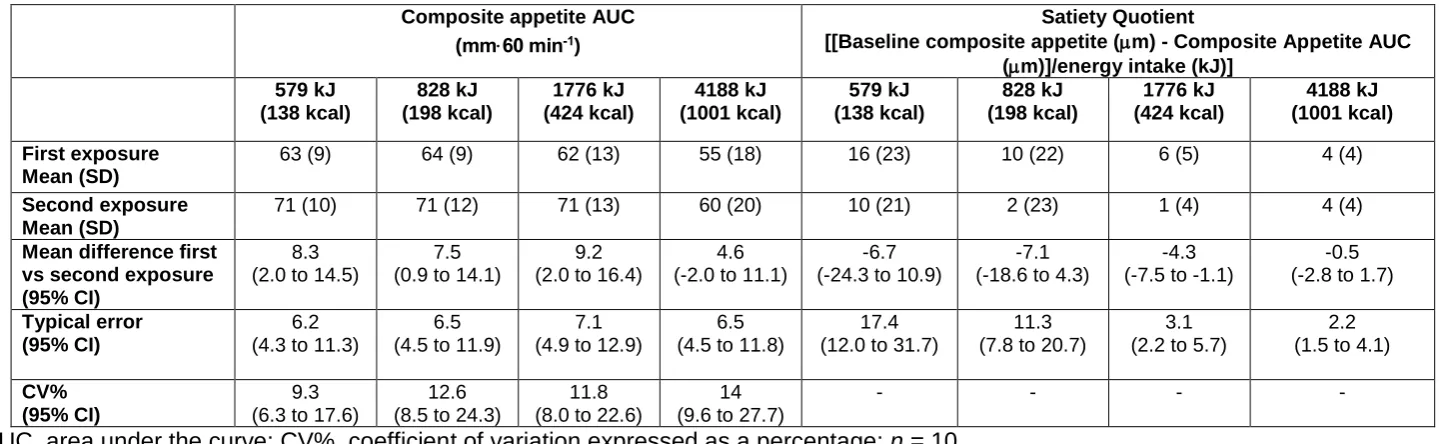
Table 1. Day-to-day variability of composite appetite area under the curve (AUC) and the satiety quotient in response to
liquid meals of differing energy content.
AUC, area under the curve; CV%, coefficient of variation expressed as a percentage; n = 10.
Composite appetite AUC
(mm60 min-1)
Satiety Quotient
[[Baseline composite appetite (m) - Composite Appetite AUC
(m)]/energy intake (kJ)]
579 kJ (138 kcal)
828 kJ (198 kcal)
1776 kJ (424 kcal)
4188 kJ (1001 kcal)
579 kJ (138 kcal)
828 kJ (198 kcal)
1776 kJ (424 kcal)
4188 kJ (1001 kcal)
First exposure Mean (SD)
63 (9) 64 (9) 62 (13) 55 (18) 16 (23) 10 (22) 6 (5) 4 (4)
Second exposure Mean (SD)
71 (10) 71 (12) 71 (13) 60 (20) 10 (21) 2 (23) 1 (4) 4 (4)
Mean difference first vs second exposure (95% CI)
8.3 (2.0 to 14.5)
7.5 (0.9 to 14.1)
9.2 (2.0 to 16.4)
4.6 (-2.0 to 11.1)
-6.7 (-24.3 to 10.9)
-7.1 (-18.6 to 4.3)
-4.3 (-7.5 to -1.1)
-0.5 (-2.8 to 1.7)
Typical error (95% CI)
6.2 (4.3 to 11.3)
6.5 (4.5 to 11.9)
7.1 (4.9 to 12.9)
6.5 (4.5 to 11.8)
17.4 (12.0 to 31.7)
11.3 (7.8 to 20.7)
3.1 (2.2 to 5.7)
2.2 (1.5 to 4.1)
CV% (95% CI)
9.3 (6.3 to 17.6)
12.6 (8.5 to 24.3)
11.8 (8.0 to 22.6)
14 (9.6 to 27.7)
Table 2. Day-to-day variability of the change in subjective appetite ratings in response to high vs low-energy liquid meals.
AUC, area under the curve. n = 10.
Modest difference in meal energy content (1197 kJ; 286 kcal)
Large difference in meal energy content (3360 kJ; 803 kcal)
ΔHunger
AUC
(mm60 min-1)
ΔFullness
AUC
(mm60 min-1)
ΔSatisfaction
AUC
(mm60 min-1)
ΔProspective
consumption AUC
(mm60 min-1)
ΔHunger
AUC
(mm60 min-1)
ΔFullness
AUC
(mm60 min-1)
ΔSatisfaction AUC
(mm60 min-1)
ΔProspective
consumption AUC
(mm60 min-1)
First exposure Mean (SD)
-0.1 (11.3) 2.5 (12.0) -3.2 (19.2) -4.9 (8.8) -8.4 (15.6) 8.9 (13.2) 8.9 (15.5) -7.3 (16.1)
Second exposure Mean (SD)
-1.2 (12.1) 1.5 (6.7) -1.5 (5.6) 0.5 (9.7) -12.9 (18.3) 10.0 (16.5) 9.9 (16.3) -12.0 (10.8)
Mean difference first vs second exposure (95% CI)
-1.0 (-15.2 to 13.2)
-1.1 (-11.2 to 9.1)
1.7 (-13.8 to 17.1)
5.5 (-5.41 to 16.3)
-4.4 (-12.1 to 3.2)
1.1 (-5.5 to 7.7)
1.0 (-6.5 to 8.6)
-4.7 (-13.2 to 3.8)
Typical error (95% CI)
14.0 (9.7 to 25.6)
10.0 (6.9 to 18.2)
15.2 (10.5 to 27.8)
10.7 (7.4 to 19.6)
7.6 (5.2 to 13.8)
6.5 (4.5 to 11.9)
7.4 (5.1 to 13.6)
8.4 (5.8 to 13.4) First exposure
SDR
(95%CI)
4.3 (3.2 to 4.3)
5.2 (3.8 to 8.5)
2.6 (1.9 to 4.4)
4.7 (3.4 to 7.7)
10.8 (7.9 to 17.7)
9.6 (7.0 to 15.8)
10.9 (7.9 to 17.9)
13.0 (9.5 to 21.5)
Second exposure
SDR
(95%CI)
6.2 (4.5 to 10.1)
11.3 (8.2 to 18.6)
18.0 (13.1 to 29.6)
6.1 (4.5 to 10.1)
14.4 (10.5 to 23.7)
13.9 (10.1 to 22.8)
11.9 (8.7 to 19.6)
Supplementary Figure 1. Individual responses in the change in composite
appetite area under the curve (AUC) following ingestion of
mixed-macronutrient liquid meals with a moderate- vs. low-energy content. Data
from experiment 1. *Response to second exposure differs from the first
exposure by more than the typical error.
-40 -30 -20 -10 0 10 20 C h a n g e i n a p p e ti te A U C h ig h -l o w e n e rg y p re lo a d ( m m 6 0 m in -1) First exposure Mean 95%CI 95%CI
1 2 3 4 5 6 7 8 9 10
-40 -30 -20 -10 0 10 20
Rank order of first exposure response
C h a n g e i n a p p e ti te A U C h ig h -l o w e n e rg y p re lo a d ( m m 6 0 m in
-1) Second exposure
Supplementary Figure 2. Individual responses in the change in composite
appetite area under the curve (AUC) following ingestion of
mixed-macronutrient liquid meals with a high- vs. low-energy content. Data from
experiment 2. *Response to second exposure differs from the first exposure
by more than the typical error.
-40 -30 -20 -10 0 10 20 C h a n g e i n a p p e ti te A U C h ig h -l o w e n e rg y p re lo a d ( m m 6 0 m in -1) First exposure Mean 95%CI 95%CI
1 2 3 4 5 6 7 8 9 10
-40 -30 -20 -10 0 10 20
Rank order of first exposure response
C h a n g e i n a p p e ti te A U C h ig h -l o w e n e rg y p re lo a d ( m m 6 0 m in -1)
Second exposure
*
*
*
*
Mean95%CI
Supplementary Figure 3. Individual responses in the change in hunger (A),
fullness (B), satisfaction (C) and prospective consumption (D) area under the
curve (AUC) for 60 min following ingestion of mixed-macronutrient liquid
meals with a higher- vs. a lower-energy content. *Response to second
exposure differs from the first exposure by more than the typical error.
-50 -40 -30 -20 -10 0 10 20 C h a n g e i n h u n g e r A U C h ig h l o w e n e rg y p re lo a d ( m m × 6 0 m in -1) First exposure Mean 95% CI 95% CI
1 2 3 4 5 6 7 8 9 10 11 12 13 14 15 16 17 18 19 20 -50 -40 -30 -20 -10 0 10 20
Participants (rank order of first exposure response)
C h a n g e i n h u n g e r A U C h ig h l o w e n e rg y p re lo a d ( m m × 6 0 m in -1) Second exposure Mean 95% CI 95% CI * * * * * * * * * -20 -10 0 10 20 30 40 C h a n g e i n s a ti s fa c ti o n A U C h ig h l o w e n e rg y p re lo a d ( m m × 6 0 m in -1) First exposure Mean 95% CI 95% CI
1 2 3 4 5 6 7 8 9 10 11 12 13 14 15 16 17 18 19 20 -20 -10 0 10 20 30 40
Participants (rank order of first exposure response)
C h a n g e i n s a ti s fa c ti o n A U C h ig h l o w e n e rg y p re lo a d ( m m × 6 0 m in -1) Second exposure Mean 95% CI 95% CI * * * * * * * * * -20 -10 0 10 20 30 40 C h a n g e i n f u lln e s s A U C h ig h l o w e n e rg y p re lo a d ( m m × 6 0 m in -1) First exposure Mean 95% CI 95% CI
1 2 3 4 5 6 7 8 9 10 11 12 13 14 15 16 17 18 19 20 -20 -10 0 10 20 30 40
Participants (rank order of first exposure response)
C h a n g e i n f u lln e s s A U C h ig h l o w e n e rg y p re lo a d ( m m × 6 0 m in -1) Second exposure Mean 95% CI 95% CI * * * * * * * * * * * -30 -20 -10 0 10 20 C h a n g e i n p ro s p e c ti v e c o n s u m p ti o n A U C h ig h l o w e n e rg y p re lo a d ( m m × 6 0 m in -1) First exposure Mean 95% CI 95% CI
1 2 3 4 5 6 7 8 9 10 11 12 13 14 15 16 17 18 19 20 -30 -20 -10 0 10 20
Participants (rank order of first exposure response)