Citation:
Bailey, DP and Smith, LR and Chrismas, BC and Taylor, L and Stensel, DJ and Deighton, K
and Douglas, JA and Kerr, CJ (2015) Appetite and gut hormone responses to moderate-intensity
continuous exercise versus high-intensity interval exercise, in normoxic and hypoxic conditions.
Appetite, 89. 237 - 245. ISSN 0195-6663 DOI: https://doi.org/10.1016/j.appet.2015.02.019
Link to Leeds Beckett Repository record:
http://eprints.leedsbeckett.ac.uk/1228/
Document Version:
Article
Date of Acceptance: 13 Feb 2015
The aim of the Leeds Beckett Repository is to provide open access to our research, as required by
funder policies and permitted by publishers and copyright law.
The Leeds Beckett repository holds a wide range of publications, each of which has been
checked for copyright and the relevant embargo period has been applied by the Research Services
team.
We operate on a standard take-down policy.
If you are the author or publisher of an output
and you would like it removed from the repository, please
contact us
and we will investigate on a
case-by-case basis.
1
Appetite and gut hormone responses to moderate-intensity continuous exercise versushigh-1
intensity interval exercise, in normoxic and hypoxic conditions
2
3
Daniel P Bailey
a, Lindsey R Smith
a,1, Bryna C Chrismas
a, Lee Taylor
a, David J Stensel
b, Kevin
4
Deighton
b,2, Jessica Douglas
b, Catherine J Kerr
c.
5
6
Author affiliations
7
a
Institute for Sport and Physical Activity Research, Department of Sport Science and Physical Activity,
8
University of Bedfordshire, Polhill Avenue, Bedford, Bedfordshire, MK41 9EA.
9
b
School of Sport, Exercise and Health Sciences, Loughborough University, Ashby Road,
10
Loughborough, Leicestershire, LE11 3TU, UK.
11
c
Department of Sport and Health Sciences, Faculty of Health and Life Sciences, Oxford Brookes
12
University, Gipsy Lane, Oxford, OX3 OBP.
13
14
Corresponding author
: Dr. Daniel Bailey, Institute for Sport and Physical Activity Research,
15
Department of Sport Science and Physical Activity, University of Bedfordshire, Polhill Avenue,
16
Bedford, Bedfordshire, MK41 9EA. Phone: +441234 793237, email: [email protected].
17
18
Conflict of interest:
none
19
20
Manuscript word count:
5,647
21
22
Funding source:
University of Bedfordshire Research Investment Programme. The funding body had
23
no involvement in study design; in the collection, analysis and interpretation of data; in the writing
24
of the report; and in the decision to submit the article for publication.
25
1 Present address: Department of Life Sciences, College of Life and Natural Science, University of Derby, Kedleston Road, Derby, DE22 1GB.
2
2
Abstract
26
This study investigated the effects of continuous moderate-intensity exercise (MIE) and
high-27
intensity interval exercise (HIIE) in combination with short exposure to hypoxia on appetite and
28
plasma concentrations of acylated ghrelin, peptide YY (PYY), and glucagon-like peptide-1 (GLP-1).
29
Twelve healthy males completed four, 2.6 h trials in a random order:
1
) MIE-normoxia,
2
)
MIE-30
hypoxia,
3
) HIIE-normoxia, and
4
) HIIE-hypoxia. Exercise took place in an environmental chamber.
31
During MIE, participants ran for 50 min at 70% of altitude-specific maximal oxygen uptake (
V
O
2max)
32
and during HIIE performed 6 x 3 min running at 90%
V
O
2maxinterspersed with 6 x 3 min active
33
recovery at 50%
V
O
2maxwith a 7 min warm-up and cool-down at 70%
V
O
2max(50 min total). In
34
hypoxic trials, exercise was performed at a simulated altitude of 2,980 m (14.5% O
2). Exercise was
35
completed after a standardised breakfast. A second meal standardised to 30% of participants’ daily
36
energy requirements was provided 45 min after exercise. Appetite was suppressed more in hypoxia
37
than normoxia during exercise, post-exercise, and for the full 2.6 h trial period (linear mixed
38
modelling,
p
< 0.05). Plasma acylated ghrelin concentrations were lower in hypoxia than normoxia
39
post-exercise and for the full 2.6 h trial period (
p
< 0.05). PYY concentrations were higher in HIIE than
40
MIE under hypoxic conditions during exercise (
p
= 0.042). No differences in GLP-1 were observed
41
between conditions (
p
> 0.05). These findings demonstrate that short exposure to hypoxia causes
42
suppressions in appetite and plasma acylated ghrelin concentrations. Furthermore, appetite
43
responses to exercise do not appear to be influenced by exercise modality.
44
45
Keywords
46
Hypoxia; high altitude anorexia; high-intensity exercise; appetite-regulating hormones; acylated
47
ghrelin
48
49
Highlights
50
3
Short exposure to hypoxia causes appetite suppressions
52
Appetite responses to exercise are not dependant on exercise modality
53
Suppressed appetite may be explained by decreased circulating acylated ghrelin
54
55
Abbreviations
56
PYY, peptide YY; HIIE, high-intensity interval exercise; MIE, moderate-intensity exercise; GLP-1,
57
glucagon-like peptide-1;
V
O
2max,maximum oxygen uptake; PFC, prospective food consumption;
58
4
Introduction
60
The current obesity epidemic is a major concern since excess weight is associated with morbidity
61
and premature mortality [5,8]. Exercise can play an important role in weight management as it may
62
improve the comorbidities of obesity [37] and contribute to a negative energy balance by increasing
63
energy expenditure [9]. Individuals do not tend to compensate for the energy expended during
64
exercise in the immediate hours after by altering food intake and such energy deficits could be
65
important for weight management if repeated over long periods of time [40]. Increasing exercise
66
intensity may increase energy expenditure and evidence suggests high-intensity exercise produces
67
greater short term reductions in appetite compared to moderate-intensity exercise [13,29].
68
One form of exercise training that is receiving more attention in health-enhancing
69
research is high-intensity interval exercise (HIIE), which may reduce cardiometabolic disease risk [28]
70
and promote similar or even superior physiological adaptations compared to traditional
endurance-71
based training [20]. All-out sprint interval exercise may acutely suppress appetite more than
72
continuous moderate-intensity exercise (MIE) [13], but this form of supramaximal exercise may not
73
be safe, tolerable, or practical for many individuals [13,20]. Submaximal HIIE may thus be preferred
74
and recent evidence suggests this form of interval exercise may also acutely suppress appetite and
75
increase the satiating gut hormone, peptide YY (PYY), more than an energy-matched continuous
76
bout of MIE [14]. Bartlett et al. [4] observed higher levels of enjoyment during a high-volume HIIE
77
protocol that involved 3 min intervals at 90% of maximum oxygen uptake (
V
O
2max) compared to a
78
continuous MIE session matched for average intensity (70%
V
O
2max). It would be of interest to
79
explore whether this interval exercise protocol suppresses appetite and affects gut hormone
80
concentrations more than continuous MIE.
81
A loss of appetite, termed “high altitude anorexia”, is often apparent when individuals are
82
exposed to high altitude (> 2,500 m) [26]. Reduced energy intake and weight loss are observed in
83
both normobaric and hypobaric hypoxia and studies using hypobaric chambers suggest it is hypoxia,
84
5
hormones in high-altitude anorexia is unclear. The acute and chronic effect of hypoxia on leptin; a
86
hormone released from white adipose tissue that reduces food intake and modulates adiposity; is
87
controversial [12,27,42]. Acute suppression of appetite and acylated ghrelin (the post-translationally
88
modified form of this gut peptide essential for its appetite-stimulatory effects) was observed during
89
7 h exposure to normobaric hypoxia, while PYY tended to be higher than in normoxic conditions
90
[48]. The response of the satiating gut hormone, glucagon-like peptide-1 (GLP-1), to hypoxia has only
91
been investigated in one previous study that showed a trend towards increased concentrations
92
following overnight hypoxic exposure [42]. The effect of short exposure to hypoxia (i.e. ≤ 1 h) on
93
appetite and appetite-related hormones has not been studied, nor has the effect of different
94
exercise modalities performed in hypoxia.
95
This study therefore investigated the effects of continuous MIE versus HIIE in combination
96
with short exposure to hypoxia on appetite and plasma concentrations of acylated ghrelin, PYY, and
97
GLP-1.
98
99
Methods
100
Participants
101
Following approval from the University of Bedfordshire ethics review board, 12 physically active (≥
102
150 min/wk of moderate-to-vigorous physical activity) and apparently healthy normal-weight men
103
(mean ± SD; age, 21.6 ± 2.0 years; body mass index, 23.5 ± 2.0 kg/m
-2) gave written informed
104
consent to participate in the study following a verbal and written explanation of the nature and risks
105
involved. Participants were non-smokers, normotensive, not taking any medications, and had no
106
known history of cardiometabolic disease.
107
108
Preliminary tests
109
Participants attended the University of Bedfordshire Sport and Exercise Science laboratories for
110
6
Height was measured to the nearest 0.1 cm using a stadiometer (Horltain Ltd, Crymych, UK) and
112
body mass to the nearest 0.1 kg using electronic weighing scales (Tanita BWB-800, Tanita Corp.,
113
Tokyo, Japan).
114
115
Maximum oxygen uptake
116
O
V
2maxwas assessed under two blinded conditions: normoxia and hypoxia. Both conditions were
117
generated by a custom built environmental chamber (T.I.S. Services, Hampshire, UK) regulated by a
118
microprocessor control. In addition to the chamber control panel display readings, all environmental
119
conditions were monitored and checked by independent calibrated instruments: temperature and
120
humidity via a Testo 625 hygrometer and oxygen levels via a Kane 250 Gas Meter. Humidity and
121
temperature were controlled at 40% relative humidity and 18°C, respectively. Hypoxic conditions
122
represented a simulated altitude of 2,980 m (14.5% O
2). In both conditions an incremental exercise
123
test was performed on a motorised treadmill (Woodway PPS55 Med-i, GmbH, Germany) with a 0%
124
gradient. Oxygen uptake was measured continuously during exercise using an online gas analysis
125
system (Cortex Metalyzer 3B, GmbH, Germany). The gas analyser used was daily volume- and
gas-126
calibrated and corrected for barometric pressure, temperature, and humidity. Following
127
familiarisation, participants were asked to warm up for 5 min at a velocity they felt they could
128
comfortably maintain for 30 min. The participants then began the test with a 2 min stage at this
129
speed. The speed was then increased by 1 km/h every 2 min until volitional exhaustion.
V
O
2maxwas
130
taken as the highest
V
O
2value averaged over a 10 sec period. Criteria used to confirm a true
131
maximum value included two or more of the following:
1
) heart rate within 10 bpm of age predicted
132
maximum,
2
) respiratory exchange ratio > 1.15,
3
) plateau of
V
O
2despite increasing workload, and
133
4
) rating of perceived exertion ≥ 18 on the Borg scale [6].
V
O
2maxwas significantly higher in
134
normoxia compared to hypoxia (56.0 ± 7.8 vs. 44.0 ± 5.8 mL/kg
-1/min
-1, respectively,
p
< 0.001).
135
136
7
Main trials
138
This was a randomised four-way cross-over design study. Participants completed four trials
139
separated by ≥ 7 days:
1
) MIE-normoxia,
2
)
MIE-hypoxia,
3
) HIIE-normoxia, and
4
) HIIE-hypoxia. The
140
environmental condition of each trial (normoxic versus hypoxic) was single blinded. Fig. 1 shows the
141
trial protocol. Participants weighed and recorded food intake for 24 h before the first main trial and
142
were asked to replicate the quantity and timings of eating prior to each subsequent testing day and
143
to refrain from alcohol and moderate-to-vigorous physical activity during this time.
144
145
Figure 1 about here.
146
147
Participants arrived at the laboratory between 7am and 8am having fasted for a minimum of 9 h
148
overnight and were weighed in light clothing and no footwear. A breakfast meal was then consumed
149
followed by a 1.75 h rest period. Exercise bouts then commenced at 0 h and participants were
150
informed of the exercise session (MIE or HIIE) that they would be performing upon entering the
151
chamber. The environmental condition remained blinded to the participant during all trials. The
152
chamber replicated those conditions outlined above for the normoxic and hypoxic conditions,
153
respectively. Exercise was performed for 50 min in the environmental chamber with participants
154
seated in a normal laboratory testing room for the remainder of each trial. During MIE, participants
155
ran for 50 min at a speed predicted to elicit 70%
V
O
2max. HIIE consisted of 6 x 3 min bouts at a
156
running velocity corresponding to 90%
V
O
2maxinterspersed with 6 x 3 min bouts of active recovery
157
at a velocity corresponding to 50%
V
O
2max, and was preceded by a 7 min warm-up and followed by a
158
7 min cool-down at a velocity of 70%
V
O
2max. This protocol thus consisted of 36 min interval exercise
159
and total exercise duration of 50 min. These protocols were selected based on a comparative study
160
in recreationally active males that reported greater levels of perceived enjoyment following HIIE,
161
similar energy expenditure (811 ± 83 and 832 ± 136 kcal for the HIIE and MIE protocols,
162
8
duration and mean intensity of exercise was used in both exercise conditions but with alternating
164
high and low intensity bouts in the HIIE trials.
165
166
Standardised meals
167
On arrival, a standardised breakfast was provided to each participant following collection of fasted
168
blood samples. The breakfast consisted of cornflakes and semi-skimmed milk and was consumed
169
within 15 min. The macronutrient content of this meal was 78% carbohydrate, 16% protein, and 6%
170
fat. The breakfast provided 20% of the estimated sedentary daily energy needs for each individual
171
(mean energy content 494 ± 27 kcal). Resting daily energy requirements were calculated [33] and
172
this value multiplied by 1.4 to represent a sedentary day. An instant pasta lunch meal was consumed
173
at 1.6 h (i.e. 45 min post-exercise), which provided 30% of the daily energy requirements for each
174
individual (mean energy content 741 ± 40 kcal). Macronutrient content was 74.5% carbohydrate,
175
21% protein, and 4.5% fat. Water was available
ad libitum
throughout trials.
176
177
Ratings of perceived appetite and nausea
178
During each trial subjective feelings of hunger (“How hungry do you feel”), satisfaction (“How
179
satisfied do you feel”), fullness (“How full do you feel”), and prospective food consumption (PFC;
180
“How much do you think you can eat”) were reported on paper using a validated 100-mm visual
181
analogue scale (VAS) [19]. Appetite perceptions were measured at baseline (-2 h), immediately after
182
breakfast (-1.75 h), immediately before exercise (0 h), mid-exercise (0.4 h), immediately
post-183
exercise (0.8 h), immediately before lunch (1.6 h), immediately post-lunch (1.8 h), and 30 and 60 min
184
(2.1 and 2.6 h, respectively) following the first mouthful of the lunch meal. A subjective rating of
185
nausea (“Not at all nauseous” to “Very nauseous”) was also taken at each of these time points using
186
a 100-mm VAS scale. An overall appetite rating was calculated as the mean value of the four
187
appetite perceptions after inverting the values for satisfaction and fullness [43].
188
9
Blood sampling
190
During each main trial, blood samples were collected via venepuncture (VACUETTE
®
, Greiner
Bio-191
One, Austria) from an antecubital vein whilst participants were in a semi-supine position. A fasting
192
venous sample was taken upon arrival at the laboratory followed by samples immediately before
193
exercise (0 h), immediately post-exercise (0.8 h), immediately before lunch (1.6 h), and 30 and 60
194
min (2.1 and 2.6 h, respectively) following the first mouthful of the lunch meal. Samples were
195
collected into two pre-cooled 4.9-mL EDTA vacuettes (Horltain Ltd, Crymych, UK). One vacuette was
196
immediately centrifuged at 1,500 x g for 10 min at a temperature of 4
oC (Heraeus Multifuge X3R,
197
Thermo Scientific, Loughborough, UK). The plasma supernatant was then dispensed into separate
2-198
mL cryovials and stored at -80°C until later analysis of glucose, insulin, total PYY, and total GLP-1
199
concentrations. From each sample, duplicate 20-µL blood samples were collected into heparinised
200
microhaematocrit tubes for determination of haematocrit and a 10-µL sample into a microcuvette
201
for determination of haemoglobin concentration to enable an estimation of plasma volume changes
202
[16]. To prevent the degradation of acylated ghrelin, a 50-L solution containing potassium
203
phosphate buffer, p-hydroxymercuribenzoic acid, and sodium hydroxide was added to one 4.9-mL
204
EDTA vacuette, which was then centrifuged at 1,500 x g for 10 min at 4
oC. The plasma supernatant
205
was then dispensed into a storage tube and 100-L of 1 M hydrochloric acid was added per mL of
206
plasma to preserve acylated ghrelin [24]. Thereafter, samples were spun at 1500 x g for 5 min at 4
oC
207
prior to storage in 2-mL cryovials at -80
oC until analysis.
208
209
Blood biochemistry
210
Commercially available enzyme immunoassays were used to determine plasma concentrations of
211
acylated ghrelin (SPI BIO, Montigny le Bretonneux, France), total PYY (Millipore, Watford, UK), total
212
GLP-1 (Millipore, Watford, UK) and insulin (Mercodia, Uppsala, Sweden). Plasma glucose
213
concentrations were determined by enzymatic, colorimetric methods using a bench top analyser
214
10
samples from each participant were analysed in the same run. The within batch coefficients of
216
variation for the assays were as follows: acylated ghrelin, 4.5%; total PYY, 5.5%; GLP-1, 4.4%; insulin,
217
2.9%; glucose, 0.8%.
218
219
Statistical analysis
220
Analyses were completed using the statistical software package IBM SPSS Statistics version 19.0
221
(SPSS Inc., Chicago, IL, USA) and SigmaPlot version 12.3 (Systat Software Inc., CA, USA). Data are
222
presented as mean (SE) in tables, text and figures. Correction of blood parameters for changes in
223
plasma volume did not alter the interpretation of the results; therefore, for simplicity, the
224
unadjusted values are presented. Standard graphical methods were preferred over null hypothesis
225
significance testing to check statistical assumptions [22]. Prior to any inferential statistical analyses
226
descriptive statistics tables were generated to check the central tendency (mean, median) and
227
dispersion (standard deviation, minimum, maximum) of the data. Second, quantile-quantile
(Q − Q)
228
plots were used to check the normality assumption of the results obtained for each of the conditions
229
across all trial periods. Where normality was deemed plausible, central tendency and dispersion
230
were reported as the mean and standard error. The two-tailed alpha level for significance testing
231
was set as
p
< 0.05.
232
Linear mixed models were chosen to determine if there were any differences in the
233
dependent variables between the conditions across time. This type of analysis was preferred as it i)
234
allows for missing data, ii) can accurately model different covariate structures for repeated
235
measures data, and iii) can model between-subject variability [47,49]. Area under the curve (AUC)
236
was calculated for all blood metabolite and appetite variables using the trapezoidal method for the
237
total trial period (2.6 h), the period during exercise (0 to 0.8 h), and the post-exercise period (0.8 to
238
2.6 h). Fixed and random factors for the linear mixed model were fit for each dependent variable
239
and the main effects for
1
) altitude (hypoxia vs. normoxia), and
2
) exercise (HIIE vs. MIE), as well as
240
11
[23] adjusted post-hoc pair wise comparisons were calculated if a significant main effect and/or
242
interaction effect was present. Analysis of serial measurements was also conducted using linear
243
mixed models, for the main effects of
1
) altitude (hypoxia vs. normoxia),
2
) exercise (HIIE vs. MIE),
244
and
3
) time (serial measurements over 2.6 h), as well as interactions (condition x time). The most
245
appropriate model was chosen using the smallest Hurvich and Tsai’s criterion (AICC) in accordance
246
with the principal of parsimony. Second, normality and homogeneity of variance of the residuals
247
were checked using
Q − Q plots and scatter plots, respectively, and deemed plausible in each
248
instance. Pearson correlation was used to explore within-subject relationships between AUC values
249
for appetite perceptions and gut hormones concentrations for combined hypoxic trials, normoxic
250
trials, HIIE trials, MIE trials, and all trials combined for the 2.6 h trial period.
251
Based on previous data from Deighton et al. [13], a sample size of 12 participants was
252
determined as sufficient to detect a 10% difference in appetite perceptions during the post-exercise
253
period. This calculation was performed using G*power with an alpha value of 5% and a power of
254
80% [18].
255
256
Results
257
Table 1 about here
258
259
Appetite perceptions
260
There were no significant differences in any fasting appetite perception between trials (
p
> 0.05).
261
Table 1 shows AUC values for each appetite perception for the combined hypoxia and normoxia
262
trials, and for the combined HIIE and MIE trials. Compared with normoxia, hunger AUC was
263
significantly lower during exercise (0 to 0.8 h;
p
< 0.001), post-exercise (0.8 to 2.6 h;
p
= 0.003), and
264
for the total 2.6 h trial period (0 to 2.6 h;
p
< 0.001) in hypoxia. Satisfaction AUC was significantly
265
higher during exercise (
p
= 0.010), post-exercise (
p
< 0.001), and for the total 2.6 h trial period (
p
<
266
12
findings of the AUC analysis by demonstrating a main effect of altitude for hunger (
p
= 0.049) and
268
satisfaction (
p
= 0.025), respectively.
269
Fullness AUC was significantly higher post-exercise (
p
= 0.030) and for the total 2.6 h trial
270
period (
p
= 0.016) in hypoxia compared with normoxia, and this difference was approaching
271
significance for the exercise time period (
p
= 0.056). The main effect of altitude in the serial
272
measurements analysis for fullness was approaching significance (
p
= 0.061). AUC values for PFC
273
were significantly lower in hypoxia compared with normoxia during exercise (
p
< 0.001),
post-274
exercise (
p
= 0.002), and for the full trial period (
p
< 0.001). Overall appetite AUC was also
275
significantly lower during exercise (
p
< 0.001) and for the full 2.6 h trial period (
p
= 0.001) in hypoxia
276
compared with normoxia, and was approaching significance for the post-exercise period (
p
= 0.051).
277
These findings were confirmed in the serial measurements analysis with a main effect of altitude on
278
PFC (
p
= 0.014) and overall appetite (
p
= <0.001). There were no significant differences for any
279
appetite perception between HIIE and MIE conditions. Perceived appetite responses over time for
280
each trial are shown in Fig. 2.
281
Feelings of nausea did not differ significantly between hypoxic and normoxic trials or
282
between HIIE and MIE trials in the exercise, post-exercise, or full 2.6 h trial periods (
p
> 0.05). There
283
were also no altitude x exercise interaction effects for any trial time period (
p
> 0.05). Differences in
284
appetite perceptions between trials were thus unlikely due to nausea sensations.
285
286
Figure 2 about here.
287
288
Figure 3 about here.
289
290
Gut hormone concentrations
291
Fasting plasma acylated ghrelin (
p
= 0.402), PYY (
p
= 0.959), and GLP-1 concentrations (
p
= 0.815) did
292
13
for the combined hypoxia and normoxia trials, and for the combined HIIE and MIE trials. Compared
294
with normoxia, acylated ghrelin AUC was significantly lower in hypoxia during the post-exercise (
p
=
295
0.020) and total 2.6 h (
p
= 0.035) time periods. Acylated ghrelin AUC did not differ significantly
296
between HIIE and MIE for any time period. Analysis of serial measurements revealed that the main
297
effect of altitude for acylated ghrelin was approaching significance (
p
= 0.065). There were no
298
significant interaction effects for altitude x exercise for acylated ghrelin in any of the analyses.
299
There were no significant main effects between altitude or exercise conditions for PYY AUC.
300
However, there was a significant altitude x exercise interaction effect for PYY AUC in the exercise
301
time period (
p
= 0.042) with concentrations being significantly higher in HIIE than MIE (115 ± 17 and
302
98 ± 12 pg/mL
-1/0.83 h
-1, respectively) under hypoxic conditions (
p
= 0.042). The altitude x exercise
303
interaction effect for PYY AUC was also approaching significance for the total 2.6 h time period (
p
=
304
0.076). The analysis of serial measurements confirmed the findings of the AUC analysis by
305
demonstrating a significant altitude x exercise interaction effect (
p
= 0.015) with PYY concentrations
306
being significantly higher in HIIE than MIE (128 ± 12 and 120 ± 12 pg/mL, respectively) under hypoxic
307
conditions (
p
= 0.048) in addition to revealing significantly higher values in hypoxia than normoxia
308
(128 ± 12 and 120 ± 12 pg/mL, respectively) during HIIE (
p
= 0.027). There were no main or
309
significant interaction effects for altitude or exercise conditions for GLP-1 concentrations. Gut
310
hormone concentrations over time for each trial are shown in Fig. 3.
311
312
Table 2 about here.
313
314
Glucose and insulin concentrations
315
Plasma glucose and insulin AUC values for the combined hypoxia and normoxia trials, and combined
316
HIIE and MIE trials, can be seen in Table 2. Fasting plasma glucose (
p
= 0.402) and insulin (
p
= 0.895)
317
concentrations did not differ at baseline between the trials. Glucose AUC was significantly lower in
318
14
significance for the total 2.6 h trial period (
p
= 0.051). Glucose AUC post-exercise was lower in MIE
320
than HIIE and this was approaching significance (
p
= 0.076). Analysis of serial measurements
321
demonstrated a main effect of altitude and exercise with glucose concentrations being lower in
322
hypoxia than normoxia (
p
= 0.041) and lower in MIE than HIIE (
p
= 0.034). Insulin AUC was lower in
323
hypoxia than normoxia during exercise and the total 2.6 h trial period and this was approaching
324
significance (
p
= 0.073 and
p
= 0.067, respectively). There were no significant main effects for insulin
325
in the serial measurements analysis. Plasma glucose and insulin concentrations over time for each
326
trial are shown in Fig. 4.
327
328
Figure 4 about here.
329
330
Correlations between appetite perceptions and appetite-regulating hormones
331
Within-subject AUC correlations for the full 2.6 h trial period for all trials combined revealed a
332
significant negative relationship between plasma acylated ghrelin and satisfaction (
r
= -0.403,
p
=
333
0.005) and fullness (
r
= -0.497,
p
< 0.000), and a significant positive relationship with PFC (
r
= 0.456,
p
334
= 0.001) and overall appetite (
r
= 0.428,
p
= 0.003). Acylated ghrelin was also significantly negatively
335
related with fullness in the HIIE trials combined for the 2.6 h trial period (
r
= -0.593,
p
= 0.042). No
336
significant correlations between plasma PYY and GLP-1 with appetite perceptions were observed in
337
the analyses.
338
339
Discussion
340
This study investigated the effects of HIIE versus continuous MIE exercise combined with short
341
exposure to hypoxia on appetite and gut hormone concentrations. Our novel data suggest that
342
appetite perceptions and plasma acylated ghrelin may be suppressed in response to as little as 50
343
min normobaric hypoxic exposure whilst performing exercise. Acute suppressions in the active form
344
15
these data suggest that this response in acylated ghrelin in the absence of cold and other stressors
346
may be implicated in high altitude anorexia. The effect of hypoxia on ghrelin is in its early stages of
347
research and the mechanisms responsible for hypoxia-induced suppressions of this hormone are
348
thus unclear. Ghrelin is predominantly derived from the stomach [2] and crosses the blood-brain
349
barrier to exert its appetite-stimulating effects in the food-regulating centre of the hypothalamus
350
[3]. Ghrelin secreted from the stomach passes through the liver from the portal vein into the
351
peripheral circulation [21]. Decreased oxygen saturation in hypoxia may result in compensatory
352
reductions in splanchnic blood flow in an attempt to maintain oxygen delivery elsewhere in the body
353
[52]. Given that the liver may be involved in the acylation of ghrelin [21], reduced blood flow to this
354
organ could explain hypoxia-induced reductions in circulating concentrations of ghrelin in its
355
acylated form. One study also observed reduced blood flow to the superior mesenteric artery, which
356
supplies the intestine, in a fasted and postprandial state following 2 h exposure to a simulated
357
altitude of 4,800 m [31], which might suggest impaired gut blood flow as a mechanistic explanation
358
for high altitude anorexia. However, similar postprandial increases in arterial and venous blood flow
359
in the gut at sea level and high altitude have been observed after a 3 day exposure to hypobaric
360
hypoxia [25]. Appetite was also suppressed in the study by Kalson et al. [25], thus suggesting that
361
high altitude anorexia after several days was not due to impaired gut blood flow. It is possible that
362
changes in gut blood flow occur in response to acute hypoxia and contribute to suppressed acylated
363
ghrelin concentrations and high altitude anorexia, while, in the longer term, different mechanisms
364
are responsible [48].
365
It has been suggested that the postprandial suppression of ghrelin may be in part
glucose-366
induced [36] and previous research that exposed participants to 7 h hypoxia observed higher glucose
367
and suppressed acylated ghrelin concentrations in hypoxia than normoxia [48]. However, glucose
368
concentrations in the current study were suppressed in the hypoxic trials and this was concomitant
369
with suppressed acylated ghrelin concentrations and another study found hyperglycaemia of 11
370
16
important physiological and dynamic modulator of ghrelin [36,38], although insulin did not differ
372
between hypoxia and normoxia conditions in the current study. These data suggest that the array of
373
other hormones released after eating may be involved in the observed postprandial ghrelin response
374
in hypoxia [30].
375
GLP-1 concentrations were unaffected by short exposure to hypoxia combined with exercise.
376
To the authors’ knowledge, only one previous study has investigated the response of GLP-1 to
377
hypoxia [42]. In that study, fasting concentrations of GLP-1 did not differ compared to normoxia
378
following overnight exposure to a simulated altitude of 4,100 m, while there was a tendency for
GLP-379
1 to be higher 40 min postmeal. This might suggest that hypoxia does not influence GLP-1 in the
380
absence of feeding. Research into the effects of hypoxia on PYY is also limited, although Wasse et al
381
[48] observed a tendency for higher total PYY concentrations in normoxia compared to 7 h hypoxic
382
exposure. However, the current study observed higher total PYY concentrations in trials where HIIE
383
was performed in hypoxia compared to when HIIE was performed in normoxia. However, these
384
differences in PYY concentrations were not accompanied by changes in perceived appetite and more
385
research is needed to establish if PYY is important in high altitude anorexia. A limitation of these
386
studies, though, is that total PYY was measured and not concentrations of PYY
3-36, which is the form
387
of PYY that is more potent in suppressing hunger [11]. However, total PYY and PYY
3-36are highly
388
correlated [44] and changes in total PYY are thus likely to reflect changes in PYY
3-36.
389
There is convincing evidence that exercise at ≥ 60%
V
O
2maxcauses acute suppressions in
390
appetite [15]. Given the recent rise in popularity of HIIE in the media and scientific literature, several
391
recent studies have compared appetite responses of this mode of exercise to traditional
moderate-392
intensity endurance-based exercise [1,13,14,32,41]. The current study did not observe suppressed
393
appetite in response to submaximal HIIE compared to continuous MIE, which has similarly been
394
reported in studies using overweight and obese participants [32,41]. Alkahtani et al [1] also observed
395
no differences in appetite perceptions following HIIE compared with moderate-intensity interval
396
17
previous research in healthy males that did observe suppressed appetite in HIIE compared with
398
continuous MIE [14,51]. One study in healthy males reported increased appetite sensations
399
following HIIE [13], but this exercise protocol was supramaximal and might suggest there is an
400
exercise intensity threshold above which appetite is increased post-exercise. However, another
401
study employing a supramaximal HIIE protocol did not observe any differences in appetite
402
perceptions compared with submaximal HIIE or continuous MIE [41] and this theory thus requires
403
further investigation. Nonetheless, an important observation in the literature that the current study
404
supports is that traditional endurance based exercise does not elicit reduced appetite compared to
405
submaximal HIIE [15].
406
There were no differences in appetite perceptions, acylated ghrelin, or GLP-1
407
concentrations between HIIE and MIE for any trial period. However, total PYY concentrations during
408
exercise were higher in HIIE than MIE when exercising under hypoxic conditions. Although research
409
exploring the effects of HIIE on appetite-regulating hormones is limited, higher mean plasma PYY
3-36410
concentrations were recently reported following submaximal HIIE than continuous MIE [14]. Greater
411
increases in PYY
3-36concentrations were also observed following 30 min of high intensity continuous
412
exercise than 30 min continuous MIE [45], although these exercise sessions were not matched for
413
energy expenditure. It is thus possible that the kinetics of PYY in blood might differ in response to
414
different modes and intensities of exercise. The reason for PYY response to exercise is not well
415
understood but it is known that gut hormones interact with one another and with glucose
416
metabolism and these may be important mechanistic factors [35].
417
The current study found no difference in acylated ghrelin concentrations between HIIE
418
and MIE. Previous research also demonstrated no difference in acylated ghrelin following
419
submaximal HIIE compared with continuous MIE exercise in overweight men [41]. However, another
420
study in overweight and obese participants reported decreased acylated ghrelin and increased GLP-1
421
concentrations following both HIIE and continuous MIE, while no differences were observed for
422
18
variations in protocols employed, such as exercise intensity and duration, and the participants
424
studied. It is also important to note that it is difficult to make direct comparisons between total PYY
425
measured in the current study with PYY
3-36responses in other investigations as the conversion rate
426
between these two forms of this hormone is unknown. Based on data from the current study, it is
427
not possible to advise which mode of exercise (HIIE or MIE) individuals should engage in under
428
hypoxic or normoxic trials to elicit preferable appetite responses.
429
Responses in appetite perceptions to exercise and/or hypoxia are not always concomitant
430
with changes in appetite-regulating hormone concentrations, and vice versa [7,13,14,32,41,48]. In
431
the current study, appetite perceptions and acylated ghrelin concentrations were suppressed in the
432
hypoxic compared with normoxic trials. Wasse et al [48] also observed suppressed appetite
433
perceptions and acylated ghrelin following hypoxia. In other studies, appetite was suppressed
434
following high-intensity exercise without changes in appetite-regulating hormone concentrations [7],
435
while on the contrary, gut hormone concentrations have been affected without associated changes
436
in appetite perceptions [14,32]. This emphasises the complex nature of appetite regulation that
437
comprises a range of both neuroendocrine and psychological factors [17,34,41] and responses
438
observed may be dependent on the nature of exposure to exercise (e.g. intensity, mode, duration)
439
and/or hypoxia.
440
The current study presents both strengths and limitations. The main strength is the
441
crossover design and the measurement of an array of appetite-related variables (subjective feelings
442
and plasma levels of several appetite-related hormones). The findings of the current study are
443
limited by the population sample as participants were all healthy young males. Although previous
444
research suggests similar appetite responses in lean and overweight individuals [46], further studies
445
in overweight and obese individuals are warranted to inform the design of effective weight
446
management interventions. Although the HIIE and MIE trials in the current study were matched for
447
average intensity (70%
V
O
2max) based on data from
V
O
2maxtesting, this was not confirmed during
448
19
be determined whether the observed responses in appetite and acylated ghrelin result in reduced
450
energy intake as participants were provided standardised meals throughout the study. However, the
451
purpose of a fixed-size meal was to distinguish the effects of food intake and of exercise and altitude
452
conditions on objective and subjective measures of appetite. Furthermore, carbohydrate and
453
protein content of a breakfast meal could alter ventilatory and metabolic responses to exercise in
454
hypoxia [10]. Since the breakfast meal in the current study is high in carbohydrate and low in protein
455
the findings may be limited to high-carbohydrate breakfasts only. The breakfast and lunch meals
456
provided were also relatively low in fat compared to realistic conditions and this limits application of
457
the findings to meals with higher fat content. The absence of a control condition for hypoxia and
458
exercise conditions is also a limitation, but this would have meant a total of six trials per participant,
459
which we believe would have been too substantial. Although symptoms of nausea were assessed,
460
other symptoms of acute mountain sickness (AMS) such as headache, fatigue, and dizziness were
461
not. Although Wasse et al [48] reported no significant correlations between AMS scores and appetite
462
perceptions during rest and exercise, it is possible symptoms other than nausea could have
463
influenced appetite perceptions in the current study. Lastly, it could not be determined if hypoxia or
464
exercise affected water intake, or whether water intake was related to appetite perceptions or gut
465
hormone concentrations, as no measure was taken.
466
In conclusion, short exposure to normobaric hypoxia whilst performing exercise causes
467
suppressions in appetite and circulating plasma acylated ghrelin concentrations. Furthermore,
468
appetite responses to exercise do not appear to be influenced by exercise modality (interval versus
469
continuous). Further research is needed to establish the chronic effects of hypoxia on appetite
470
regulation and whether there are differences in appetite following repeated bouts of HIIE versus
471
continuous MIE.
472
473
Acknowledgements
474
20
References
476
1. Alkahtani, SA, Byrne, NM, Hills, AP, King, NA (2014) Acute interval exercise intensity does not
477
affect appetite and nutrient preferences in overweight and obese males. Asia Pac J Clin Nutr
478
23:232-238
479
2. Ariyasu, H, Takaya, K, Tagami, T, Ogawa, Y, Hosoda, K, Akamizu, T et al. (2001) Stomach is a major
480
source of circulating ghrelin, and feeding state determines plasma ghrelin-like
481
immunoreactivity levels in humans. J Clin Endocrinol Metab 86:4753-4758
482
3. Banks, WA, Tschop, M, Robinson, SM, Heiman, ML (2002) Extent and direction of ghrelin transport
483
across the blood-brain barrier is determined by its unique primary structure. J Pharmacol
484
Exp Ther 302:822-827
485
4. Bartlett, JD, Close, GL, MacLaren, DP, Gregson, W, Drust, B, Morton, JP (2011) High-intensity
486
interval running is perceived to be more enjoyable than moderate-intensity continuous
487
exercise: implications for exercise adherence. J Sports Sci 29:547-553
488
5. Bigaard, J, Frederiksen, K, Tjonneland, A, Thomsen, BL, Overvad, K, Heitmann, BL et al. (2004)
489
Body fat and fat-free mass and all-cause mortality. Obes Res 12:1042-1049
490
6. Borg, GA (1982) Psychophysical bases of perceived exertion. Med Sci Sports Exerc 14:377-381
491
7. Burns, SF, Broom, DR, Miyashita, M, Mundy, C, Stensel, DJ (2007) A single session of treadmill
492
running has no effect on plasma total ghrelin concentrations. J Sports Sci 25:635-642
493
8. Canoy, D, Boekholdt, SM, Wareham, N, Luben, R, Welch, A, Bingham, S et al. (2007) Body fat
494
distribution and risk of coronary heart disease in men and women in the European
495
Prospective Investigation Into Cancer and Nutrition in Norfolk cohort: a population-based
496
prospective study. Circulation 116:2933-2943
497
9. Catenacci, VA, Wyatt, HR (2007) The role of physical activity in producing and maintaining weight
498
21
10. Charlot, K, Pichon, A, Richalet, JP, Chapelot, D (2013) Effects of a carbohydrate versus
high-500
protein meal on acute responses to hypoxia at rest and exercise. Eur J Appl Physiol
113:691-501
702
502
11. Chelikani, PK, Haver, AC, Reidelberger, RD (2004) Comparison of the inhibitory effects of
PYY(3-503
36) and PYY(1-36) on gastric emptying in rats. Am J Physiol Regul Integr Comp Physiol
504
287:R1064-1070
505
12. Debevec, T, Simpson, EJ, Macdonald, IA, Eiken, O, Mekjavic, IB (2014) Exercise training during
506
normobaric hypoxic confinement does not alter hormonal appetite regulation. PLoS One
507
9:e98874
508
13. Deighton, K, Barry, R, Connon, CE, Stensel, DJ (2013) Appetite, gut hormone and energy intake
509
responses to low volume sprint interval and traditional endurance exercise. Eur J Appl
510
Physiol 113:1147-1156
511
14. Deighton, K, Karra, E, Batterham, RL, Stensel, DJ (2013) Appetite, energy intake, and PYY3-36
512
responses to energy-matched continuous exercise and submaximal high-intensity exercise.
513
Appl Physiol Nutr Metab 38:947-952
514
15. Deighton, K, Stensel, DJ (2014) Creating an acute energy deficit without stimulating
515
compensatory increases in appetite: is there an optimal exercise protocol? Proc Nutr Soc
516
73:352-358
517
16. Dill, DB, Costill, DL (1974) Calculation of percentage changes in volumes of blood, plasma, and
518
red cells in dehydration. J Appl Physiol 37:247-248
519
17. Evero, N, Hackett, LC, Clark, RD, Phelan, S, Hagobian, TA (2012) Aerobic exercise reduces
520
neuronal responses in food reward brain regions. J Appl Physiol (1985) 112:1612-1619
521
18. Faul, F, Erdfelder, E, Lang, AG, Buchner, A (2007) G*Power 3: a flexible statistical power analysis
522
22
19. Flint, A, Raben, A, Blundell, JE, Astrup, A (2000) Reproducibility, power and validity of visual
524
analogue scales in assessment of appetite sensations in single test meal studies. Int J Obes
525
Relat Metab Disord 24:38-48
526
20. Gibala, MJ, Little, JP, Macdonald, MJ, Hawley, JA (2012) Physiological adaptations to low-volume,
527
high-intensity interval training in health and disease. J Physiol 590:1077-1084
528
21. Goodyear, S, Arasaradnam, RP, Quraishi, N, Mottershead, M, Nwokolo, CU (2010) Acylated and
529
des acyl ghrelin in human portal and systemic circulations. Mol Biol Rep 37:3697-3701
530
22. Grafen, G, Hails, R. (2002).
Modern statistics for the life sciences
. New York, USA: Oxford
531
University Press.
532
23. Hommel, G (1988) A stagewise rejective multiple test procedure based on a modified Bonferroni
533
test. Biometrika 75:383-386
534
24. Hosoda, H, Doi, K, Nagaya, N, Okumura, H, Nakagawa, E, Enomoto, M et al. (2004) Optimum
535
collection and storage conditions for ghrelin measurements: octanoyl modification of ghrelin
536
is rapidly hydrolyzed to desacyl ghrelin in blood samples. Clin Chem 50:1077-1080
537
25. Kalson, NS, Hext, F, Davies, AJ, Chan, CW, Wright, AD, Imray, CH (2010) Do changes in
gastro-538
intestinal blood flow explain high-altitude anorexia? Eur J Clin Invest 40:735-741
539
26. Kayser, B, Verges, S (2013) Hypoxia, energy balance and obesity: from pathophysiological
540
mechanisms to new treatment strategies. Obes Rev 14:579-592
541
27. Kelly, KR, Williamson, DL, Fealy, CE, Kriz, DA, Krishnan, RK, Huang, H et al. (2010) Acute
altitude-542
induced hypoxia suppresses plasma glucose and leptin in healthy humans. Metabolism
543
59:200-205
544
28. Kessler, HS, Sisson, SB, Short, KR (2012) The potential for high-intensity interval training to
545
reduce cardiometabolic disease risk. Sports Med 42:489-509
546
29. King, NA, Burley, VJ, Blundell, JE (1994) Exercise-induced suppression of appetite: effects on food
547
23
30. Koliaki, C, Kokkinos, A, Tentolouris, N, Katsilambros, N (2010) The effect of ingested
549
macronutrients on postprandial ghrelin response: a critical review of existing literature data.
550
Int J Pept 2010:
551
31. Loshbaugh, JE, Loeppky, JA, Greene, ER (2006) Effects of acute hypobaric hypoxia on resting and
552
postprandial superior mesenteric artery blood flow. High Alt Med Biol 7:47-53
553
32. Martins, C, Stensvold, D, Finlayson, G, Holst, J, Wisloff, U, Kulseng, B et al. (2014) Effect of
554
moderate- and high-intensity acute exercise on appetite in obese individuals. Med Sci Sports
555
Exerc (Epub ahead of print):
556
33. Mifflin, MD, St Jeor, ST, Hill, LA, Scott, BJ, Daugherty, SA, Koh, YO (1990) A new predictive
557
equation for resting energy expenditure in healthy individuals. Am J Clin Nutr 51:241-247
558
34. Morton, GJ, Cummings, DE, Baskin, DG, Barsh, GS, Schwartz, MW (2006) Central nervous system
559
control of food intake and body weight. Nature 443:289-295
560
35. Murphy, KG, Bloom, SR (2006) Gut hormones and the regulation of energy homeostasis. Nature
561
444:854-859
562
36. Nakagawa, E, Nagaya, N, Okumura, H, Enomoto, M, Oya, H, Ono, F et al. (2002) Hyperglycaemia
563
suppresses the secretion of ghrelin, a novel growth-hormone-releasing peptide: responses
564
to the intravenous and oral administration of glucose. Clin Sci (Lond) 103:325-328
565
37. Ross, R, Dagnone, D, Jones, PJ, Smith, H, Paddags, A, Hudson, R et al. (2000) Reduction in obesity
566
and related comorbid conditions after diet-induced weight loss or exercise-induced weight
567
loss in men. A randomized, controlled trial. Ann Intern Med 133:92-103
568
38. Saad, MF, Bernaba, B, Hwu, CM, Jinagouda, S, Fahmi, S, Kogosov, E et al. (2002) Insulin regulates
569
plasma ghrelin concentration. J Clin Endocrinol Metab 87:3997-4000
570
39. Schaller, G, Schmidt, A, Pleiner, J, Woloszczuk, W, Wolzt, M, Luger, A (2003) Plasma ghrelin
571
concentrations are not regulated by glucose or insulin: a double-blind, placebo-controlled
572
24
40. Schubert, MM, Sabapathy, S, Leveritt, M, Desbrow, B (2014) Acute exercise and hormones
574
related to appetite regulation: a meta-analysis. Sports Med 44:387-403
575
41. Sim, AY, Wallman, KE, Fairchild, TJ, Guelfi, KJ (2014) High-intensity intermittent exercise
576
attenuates ad-libitum energy intake. Int J Obes (Lond) 38:417-422
577
42. Snyder, EM, Carr, RD, Deacon, CF, Johnson, BD (2008) Overnight hypoxic exposure and
glucagon-578
like peptide-1 and leptin levels in humans. Appl Physiol Nutr Metab 33:929-935
579
43. Stubbs, RJ, Hughes, DA, Johnstone, AM, Rowley, E, Reid, C, Elia, M et al. (2000) The use of visual
580
analogue scales to assess motivation to eat in human subjects: a review of their reliability
581
and validity with an evaluation of new hand-held computerized systems for temporal
582
tracking of appetite ratings. Br J Nutr 84:405-415
583
44. Tsilchorozidou, T, Batterham, RL, Conway, GS (2008) Metformin increases fasting plasma peptide
584
tyrosine tyrosine (PYY) in women with polycystic ovarian syndrome (PCOS). Clin Endocrinol
585
(Oxf) 69:936-942
586
45. Ueda, SY, Yoshikawa, T, Katsura, Y, Usui, T, Fujimoto, S (2009) Comparable effects of moderate
587
intensity exercise on changes in anorectic gut hormone levels and energy intake to high
588
intensity exercise. J Endocrinol 203:357-364
589
46. Ueda, SY, Yoshikawa, T, Katsura, Y, Usui, T, Nakao, H, Fujimoto, S (2009) Changes in gut hormone
590
levels and negative energy balance during aerobic exercise in obese young males. J
591
Endocrinol 201:151-159
592
47. Vandenbogaerde, TJ, Hopkins, WG (2010) Monitoring acute effects on athletic performance with
593
mixed linear modeling. Med Sci Sports Exerc 42:1339-1344
594
48. Wasse, LK, Sunderland, C, King, JA, Batterham, RL, Stensel, DJ (2012) Influence of rest and
595
exercise at a simulated altitude of 4,000 m on appetite, energy intake, and plasma
596
concentrations of acylated ghrelin and peptide YY. J Appl Physiol 112:552-559
597
49. West, BT, Welch, KB, Galecki, AT. (2006).
Linear mixed models: A practical guide using statistical
598
25
50. Westerterp-Plantenga, MS, Westerterp, KR, Rubbens, M, Verwegen, CR, Richelet, JP, Gardette, B
600
(1999) Appetite at "high altitude" [Operation Everest III (Comex-'97)]: a simulated ascent of
601
Mount Everest. J Appl Physiol (1985) 87:391-399
602
51. Williams, CB, Zelt, JG, Castellani, LN, Little, JP, Jung, ME, Wright, DC et al. (2013) Changes in
603
mechanisms proposed to mediate fat loss following an acute bout of high-intensity interval
604
and endurance exercise. Appl Physiol Nutr Metab 38:1236-1244
605
52. Wolff, CB (2007) Normal cardiac output, oxygen delivery and oxygen extraction. Adv Exp Med
606
Biol 599:169-182
607
608
26
Figure 1
610
Fig. 1. Schematic representation of the study protocol.
611
612
Figure 2
613
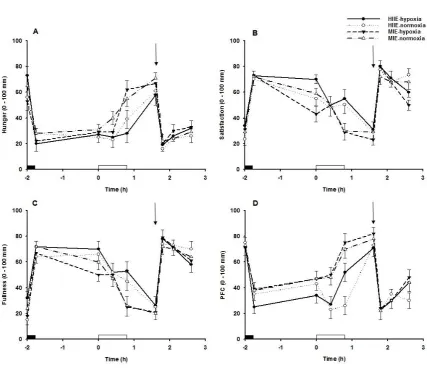
Fig. 2. Changes in perceptions of (A) hunger, (B) satisfaction, (C) fullness, and (D) prospective food
614
consumption during moderate-intensity exercise (MIE)-normoxia, MIE-hypoxia, high-intensity
615
interval exercise (HIIE)-normoxia, and HIIE-hypoxia. Values are means ± SE;
n
= 12. Some error bars
616
have been omitted for clarity.
Black rectangle
indicates standardised breakfast,
open rectangle
617
indicates treadmill exercise and hypoxia (or normoxia),
downward arrow
indicates standardised
618
lunch meal.
619
620
Figure 3
621
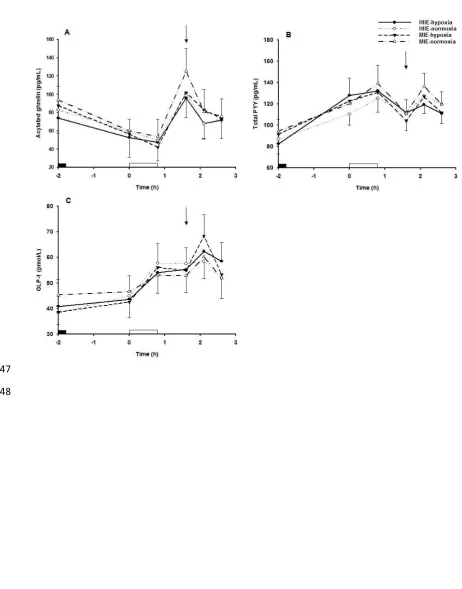
Fig. 3. Changes in plasma concentrations of (A) acylated ghrelin, (B) total PYY, and (C) GLP-1 during
622
moderate-intensity exercise (MIE)-normoxia, MIE-hypoxia, high-intensity interval exercise
(HIIE)-623
normoxia, and HIIE-hypoxia. Values are means ± SE;
n
= 12. Some error bars have been omitted for
624
clarity.
Black rectangle
indicates standardised breakfast,
open rectangle
indicates treadmill exercise
625
and hypoxia (or normoxia),
downward arrow
indicates standardised lunch meal.
626
627
Figure 4
628
Fig. 4. Changes in plasma concentrations of (A) glucose and (B) insulin during moderate-intensity
629
exercise (MIE)-normoxia, MIE-hypoxia, high-intensity interval exercise (HIIE)-normoxia, and
HIIE-630
hypoxia. Values are means ± SE;
n
= 12. Some error bars have been omitted for clarity.
Black
631
rectangle
indicates standardised breakfast,
open rectangle
indicates treadmill exercise and hypoxia
632
(or normoxia),
downward arrow
indicates standardised lunch meal.
633
27
Figure 1
635
636
637
638
639
28
Figure 2
641
642
643
[image:29.595.78.506.115.483.2]29
Figure 3
645
646
647
[image:30.595.43.506.109.699.2]30
Figure 4
649
650