TWO-DIMENSIONAL DIGITAL HALFTONING BASED ON
WEIGHTED LEAST-SQUARES FOR LASER CARVING
GRAVURE CYLINDER TECHNOLOGY AND DETECTING
SYSTEM OF INK CELLS VIA NEURAL NETWORK
1
ZIFEN HE, 2ZHAOLIN ZHAN, 1YINHUI ZHANG* 1
Kunming University of Science and Technology, Faculty of mechanical and electrical engineering,
Kunming, 650093, China
2
Kunming University of Science and Technology, Faculty of materials science and engineering, Kunming,
650093, China
E-mail: [email protected], 1*[email protected] , [email protected]
ABSTRACT
Laser carving technology has the advantages of higher resolution, focusing precision and digital modulation. It has been widely used in laser engraving gravure plate and laser plate processing. However, the switching of the laser has only two states, so the halftoning processing plays a vary important role in the laser plate. In this paper, we present a 2-dimensional digital halftoning method based on weighted least-squares(WLS) which can significantly gain high quality image during the processing of laser plate. Two main strategies were made. The first is adding a procedure to partition into several finite regions using K-means image segmentation and least squares to reduce the total quantizing error. The second is that the statistics of the mean and variance of the gray-scale pixel of each clustering are calculated and the new energy function is constructed using the weighted least squares method, which the reciprocal of the variance of the segmented regions are referred to as the weighting operator. The analysis and simulation results show that the proposed algorithm produces better gray-scale halftone image quality when we increase the number of clustering with a certain range. A performance measure for halftone image is used to evaluate our method. We apply neural network to build up a detecting system of ink cells in gravure cylinder.We use different thresholds and experimental sigma values that compare to experimental results. Binarization images are obtained through adaptive threshold segmentation, which regards the value of gaps and dark tone as the characteristic value when they start to detecting. We extract size and surface defects of ink cells for grading. The areas of ink cells are deemed to size characteristics. Then we classify the ink cells into two classes by using of neural network. The experimental results consider neural network model that produce consequences.
Keywords: Laser Carving Technology, Digital Halftoning, Weighted Least Squares, Ink Cells in Gravure
Cylinder, Neural Network, Value of Gaps and Dark Tone
1. INTRODUCTION
Laser carving technology is an applied technique developed in the 1980’s. But its application range has widely expanded combined with CAD, computer graphic, industrial automation, information technology etc. Laser carving system for digital image is one of laster carving applications, which derived from computer integrated numerical control system based on digital image processing. Without loss of generality, the surface of the plate has been efficiently carved into a number of square area, which the surface regions
have a high spatial resolution during the process of plate. Laser carving technology has the advantages of higher resolution, focusing precision and digital modulation. It has been widely used in laser engraving gravure plate and laser plate processing.
Figure 1 : Laser Carving the Galvanized
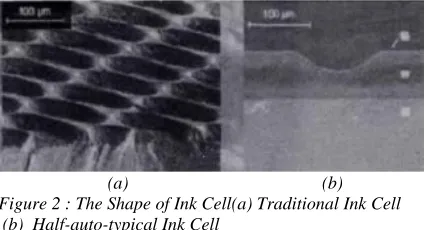
The traditional ink cell (the depth variational and diameter invariable on the gray-scale) can be generated by the flat waveform. Half-auto-typical ink cell(the depth and diameter can be change on the gray-scale) can be generated by a Gaussian laser beam waveform. It is shown in Figure 2. Ink cell size rely on the pulse energy.
(a) (b)
Figure 2 : The Shape of Ink Cell(a) Traditional Ink Cell (b) Half-auto-typical Ink Cell
In this paper, we present a 2-dimensional digital halftoning method for the laser carving processing. Halftoning is a method for creating the illusion of continuous tone output with a binary device. Effective digital halftoning can substantially improve the quality of rendered images at minimal cost[1].The halftoning algorithms can be broadly classified into three categories[2]. These include ordered dithering, error diffusion and optimization-based techniques. The goal of model-optimization-based halftoning techniques is to exploit explicit models of the display device and the human visual system (HVS) to maximize the quality of the displayed images[3].
Many practical but suboptimal search techniques have been proposed to perform the minimization procedure. They include a dual interpretation direct binary search[4], one-dimensional Viterbi algorithm[5], blocking with greedy bit flipping[6], blocking with branch and bound minimization[7], diffusion-reaction model[8]. The Lsmb halftoning approach attempts to produce an optimal halftoned reproduction. The error criterion of the Lsmb approach provides a measure of halftone image quality that takes into account the characteristics of both the display device (printer) and the human
visual system and can be used to evaluate the performance of any halftoning technique[9].
The rest of the paper is organized as follows. In section 2, we present the gray image that is partitioned into several finite regions using k-means image segmentation method. The statistics of the mean and variance of each clustering is calculated. The building of halftoning error metric is presented in section 3. In section 4, we build the energy function, which to minimize error metric by Direct Binary Search method. Section 5 discusses the results and presents examples of the halftone quality results that can be achieved. Section 6 build the detection system of ink cells via neural network. Section 7 is a brief conclusion with comments on future work.
2. SEGMENTATION USING CLUSTERING METHOD
An algorithm for partitioning (or clustering)
Ndata points into Kdisjoint subsets Sjcontaining
j
N data points so as to minimize the
sum-of-squares criterion.
2
1 j
K
n j
j n S
J x µ
= ∈
=
∑ ∑
− (1)where xnis a vector representing the nth data
point and µjis the geometric centroid of the data
points inSj. In general, the algorithm does not
achieve a global minimum of J over the
assignments. In fact, since the algorithm uses discrete assignment rather than a set of continuous parameters, the “minimum” it reaches cannot even be properly called a local minimum[10].
The algorithm consists of a simple re-estimation procedure as follows[11]. Initially, the data points are assigned at random to the Ksets. For step 1, the centroid is computed for each set. In step 2, every point is assigned to the cluster whose centroid is closest to that point. The processing of K-means clustering is shown in Figure 3.
(a) (b) Figure 3 : The Iterative Processing of K-means [image:2.612.91.304.287.402.2]
3. HALFTONING ERROR FIELD AND WEIGHTED LEAST-SQUARES
In this section, the relationship between the Human vision system(HVS)/printer model and the halftoning algorithm have been set up[12].
Let f [m,n] be the continuous-tone image and f
(x,y) be the rendition of this continuous-tone image by an ideal printer. Let g[m,n] =0 or 1 represent the halftone image. Then, the following equations hold:
,
( , ) [ , ] ( , )
m n
f x y =
∑
f m n p x−mX y−nY
,
( , ) [ , ] ( , )
m n
g x y =
∑
g m n p x−mX y−nY
( , ) ( / , / )
p x y =rect x X y Y
where p(x,y) is the dot rendering function of an ideal printer, and X and Y are the basis for the lattice of printer addressable dots in units of in/dot.
A HVS model is a linear shift invariant filter based on the Point Spread Function (PSF) of the human eye, which will be denoted by h(x,y). The perceived continuous-tone image is gien by
,
( , ) ( , ) ( , ) [ , ] ( , )
m n
f x y = f x y ∗∗h x y =
∑
f m n p x−mX y−nY
where ** denotes 2-D convolution and
( , ) ( , ) ( , )
p x y =p x y ∗∗h x y
embodies the effects of cascading the printer rendering and HVS model. Similarly, the perceived halftone image can be written as
,
( , ) [ , ] ( , )
m n
g x y =
∑
g m n p x−mX y−nY
then, the perceived error between the
continuous-tone image and the halfcontinuous-tone image is given by
( , ) ( , ) ( , ) e x y =g x y −f x y
The goal of least-squares halftoning is to find the
optimal halftone image which minimizes the total squared error.
2
, , ,
,
( )
x y x y x y
x y
E =
∑
g −f
Weighted least squares (WLS) regression is
useful for estimating the values of model parameters when the response values have differing degrees of variability over the combinations of the predictor values[9].
Optimal results that minimize the uncertainty in the parameter estimators are obtained when the
weights used to estimate the values of the unknown parameters are inversely proportional to the variances at each combination of predictor variable
values 2 1 i i λ σ ∝ .
In the proposed approach, we seek the halftone image that minimizes the weighted squared error
4
2
, , ,
1 ,
( )
x y k x y x y
k x y
E λ g f
=
=
∑ ∑
−(2)
The λk(k=1,2,3,4) are weighting operators and
∗
indicates convolution. Note that we have alloweddifferent impulse responses for the eye filters corresponding to the halftone and continuous-tone images.
4. DIRECT BINARY SEARCH (DBS) AND ERROR METRIC
The goal of DBS is to determine the binary halftone image g[m,n] such that the difference between the perceived versions of the original gray-scale image and the rendered halftone is minimized. As a measure of the difference, the total squared error is equation [13].
We model the low pass characteristic of the eye with a luminance spatial frequency response function (model by Mannos and Sakrison[8] ).
{
1.1}
( ) 2.6(0.0192 0.114 ) exp (0.114 )
r r r r
H f = + f − f
(3)
fr in Eq. (3) is the spatial frequency of the visual stimuli given in cycles/degree. The function has a
peak of value 1 approximately at fr =7.9
cycles/degree, and is meaningless for frequencies above 60 cycles/degree.
We compute this error efficiently by computing
first the autocorrelation function of the filter, cp p
and the correlation between the error and the
filter, e p c
. This is acceptable though, because especially in the last passes over the image, we try much more changes than the number we accept.
[ , ] ( , )
p p p p
c m n =c mX nY
,ce p[ , ]m n e m n[ , ] cp p( , )m n
= ∗∗
In DBS, there are two kinds of pixel changes, toggles and swaps.
5. HALFTONING EXPERIMENTAL RESULTS AND DISCUSSIONS
All halftones are generated and printed at a resolution of 300dpi and 24inches viewing distance. In the experiment, we compare two algorithms: Lsmb, and proposed algorithms.
(a) (b)
[image:4.612.308.522.75.280.2]
(c) (d) Figure 4: Original Image and Image Labels by Cluster
Index K (a)Original Image(b)K=2(c)K=3(d)K=4
[image:4.612.97.289.145.342.2]Seen from Figure 4, there are two, three and four regions generated by the clustering. The statistics of the mean and variance of the gray-scale pixel of each clustering are calculated. The results are shown in Table 1.
Table 1: Pixels statistics for each cluster
Clustering
µ
σ
22 K= Ⅰ 81 776
K= Ⅱ 173 1124
3 K= Ⅰ 64 433
K= Ⅱ 125 376
K= Ⅲ 199 612
4 K= Ⅰ 52 274
K= Ⅱ 98 187
K= Ⅲ 147 229
K= Ⅳ 208 260
Then we use the proposed algorithm to obtain the halftone images.
(a) (b)
(c) (d)
(e) (f)
Figure 5: Bridge Halftoning using Lsmb and Proposed Algorithm (a)Original Image (b)Initial Halftoning Image
(c)Lsbm Algorithm (d) Proposed Algorithm in K=2
Weighed Operator λ λ1, 2(e)Proposed Algorithm in K=2
Weighed Operatorλ λ1, 2andλ3(f)Proposed Algorithm in
K=2 Weighed Operatorλ λ λ1, 2, 3andλ4
The Figure 5 (c)(d)(e)(f) show the halftone of Bridge generated with the proposed algorithm for the cluster classes K=2,3 and 4 and the weighted
1, 2, 3and 4
λ λ λ λ
. On testing images, we founded that when comparing the quality measurements of halftone images with MSEv and PSNR. We plot the MSEv and PSNR for the test image in Figure 6 and Figure 7.
0 0.02 0.04 0.06 0.08 0.1 0.12 0.14
Ⅰ Ⅱ Ⅲ Ⅳ
K-means clustering
MSEv
y MSEv
0 10 20 30 40
Ⅰ Ⅱ Ⅲ Ⅳ
K-means clustering
PSNR
y
Figure 6: Comparison of the Figure 7: Comparison of Value of MSEv the Value of PSNR
0 0.1 0.2 0.3 0.4 0.5
1 2 3 4 5 6
iterations
convergence error
LSMB Ⅱ WLSMB Ⅲ WLSMB Ⅳ WLSMB
Figure 8: Comparison of the Number Iterations for The Test Image
[image:4.612.108.279.442.567.2] [image:4.612.315.520.472.663.2]increase in cluster partition, the value of MSEv is also decreases. We can be seen from Figure 7 that the proposed algorithm achieves consistently higher values of PSNR than the Lsmb algorithm, and with the increase in cluster partition, the value of PSNR are also increase. During the running of the program, the Lsmb algorithm iterates six times, while the proposed algorithm iterates four times, the convergence error down to 0.25. Figure 8 shows that the proposed algorithm can further reduce the number of iterations.
6. DETECTING SYSTEM OF INK CELLS VIA NEURAL NETWORK
The gray-scale image quality of laser carving gravure cylinder depend largely on the quality of ink cells of the gravure cylinder. But at present, the vast majority of gravure manufacturing enterprises produced good gravure test sample cells by use of artificial or semi-automatic method[14]. Machine vision inspection system is mainly used in the quality of printed matter rather than printing plates.
In abroad, studied on offset and gravure on the automatic detection system by Rafail Bronstein, Omer Karp, and Goldstein has been advanced by the United States Scitex Vision Technology Co. Ltd and proxy, which applied for the patent[15]. Based on machine vision detecting technology is mainly
used in quality inspection of agricultural
products[16]. Since 2000, the machine vision technology has also been applied to sorting timber, ore, chemicals and other products classification.
We apply neural network to build up a detecting system of ink cells in gravure cylinder. The experimental results consider neural network model that produce properly sorting and gain true systematization consequences.
A computer-aided ink cells quality assessment and detecting system has two subsystems: a computer vision system and a ink cells handling system[17]. Figure 9 show computer-aided sorting system processes.
Figure 9: Computer-aided Sorting System Processes
[image:5.612.312.523.271.464.2]In the process of laser engraving of the ink cells, each ink cell is formed that the graver is completed a movement rather than time after time engrave.
Figure 10: The Ink Cells of Gravure
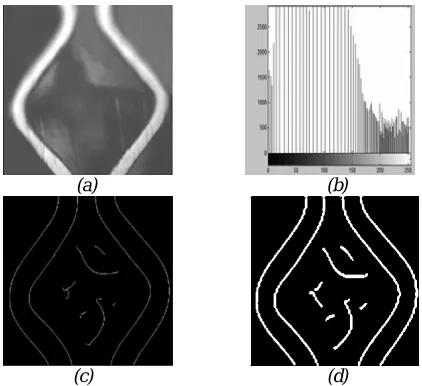
The ink cell information is shown the Figure11[18]. When T and sigma are the default value, the edge of Figure11(c) is extracted by use of Canny operator[19], Binarization images are obtained through adaptive threshold segmentation.
(a) (b)
(c) (d) Figure11: Read the Results of Information
Cell(a)Original Image (b)The Histogram of
Equalization(c)Canny Operator Extraction Sigma=16 (d) Binarization Images t = 0.10
In this paper, we chose the threshold equal to 0.10. The value of gaps and dark tone are the image feature value. The bright is 1, the other part is 0 in the detected edge image. By the detected edge image analysis shows that the value of dark tone corresponds to the image matrix of horizontal distance of two points. At first, there are highlights the location coordinates in the edge image, it is i
and j, the jm is the largest horizontal coordinates, the js is the smallest horizontal coordinates. Hypothesis s is the value of dark tone and s is the difference with the js and jm. In addition to using the progressive test,the calculation of value of the gaps is the same as the dark tone. On the edge of the image all the columns of matrix of the first transverse are scanned that the results are no bright spots, then the second line are scanned, the value of
r and c are get. Image
quantification
Judge Identification
Im
ag
e
Targe t
Image signal Digital signal
Target feature extraction Sorting
According to the image used in this research to determine the standard cells carving gaps value of d0
equal 125, the value of dark tone s0 equal 394, so
the standard range of are d0± 10 and s0± 10. The
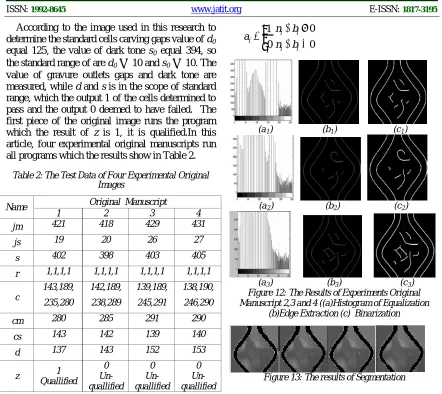
[image:6.612.84.526.72.466.2]value of gravure outlets gaps and dark tone are measured, while d and s is in the scope of standard range, which the output 1 of the cells determined to pass and the output 0 deemed to have failed. The first piece of the original image runs the program which the result of z is 1, it is qualified.In this article, four experimental original manuscripts run all programs which the results show in Table 2.
Table 2:The Test Data of Four Experimental Original
Images
Name Original Manuscript
1 2 3 4
jm 421 418 429 431
js 19 20 26 27
s 402 398 403 405
r 1,1,1,1 1,1,1,1 1,1,1,1 1,1,1,1
c
143,189,
235,280
142,189,
238,289
139,189,
245,291
138,190,
246,290
cm 280 285 291 290
cs 143 142 139 140
d 137 143 152 153
z 1
Quallified 0 Un- quallified
0 Un- quallified
0 Un- quallified
The experimental results of the second, third and forth piece of the original images show in Figure12. Segmentation pictures are extracted by K-means clustering. The areas of ink cells are deemed to size characteristics. The results of segmentation is shown in Figure 13.
American computer scientist F. Roseblatt was proposed perceptron convergence theorem in 1957[20].
1 r
i ij j
j n w p
= =
∑
, ai= f n( i+bi)
where, ni is the i’th weighted neuron total inputs. ai
is the i’th neuron output, i= 1,2,…,s.
The basic function of the perceptron that the input vector is converted to the output vector which it is 0 or 1. According to test the total weighted output value is located in left and right of the threshold function which to classify the input data.
1 0
i
a =
0
0
i i
i i
n b
n b
+ ≥ + <
(a1) (b1) (c1)
(a2) (b2) (c2)
(a3) (b3) (c3)
Figure 12: The Results of Experiments Original Manuscript 2,3 and 4 ((a)Histogram of Equalization
(b)Edge Extraction (c) Binarization
Figure 13: The results of Segmentation
This function can be explained by mapping the
input vector space. For example, the input vector
r=2, for the selected weight w1,w2 and b, we are
regard P1 and P2 as horizontal and vertical axis,
respectively, which to draw the geometric locus of
1 1 2 2 0
w p∗ + =b w ∗p +w ∗p + =b that is a straight
line when w1∗p1+w2∗p2+ >b 0, the value of P
1
and P2locate the straight line and above, the output
of perception is 1, else 0.
When we apply the perceptron to classification for different input vectors for the desired output 0 or 1, the problem can be transformed the input vector into in the input space formed by different points of location to design perceptron weights w
and b. The purpose of perceptron weight parameter
is design a path of w p∗ + =b 0 according to learning law which to achieve the desired division for the input vectors.
weight equals to the input vector. Assume that the input vector P, the output vector A, the target vector
T.
( )
( ) 1
ij i i j
i i i
w t y p
b t y
∆ = − ×
∆ = − ×
In this article, determine the input vector P, the
target vector T, and determine the vector dimension
and number of neurons: r, s and
q.Parameter initialization a) Assign the weight vector w in (-1,1) random non- zero initial value.b) Give the maximum training cycle max-epoch.
Firstly, we classify the cells in gravure cylinder according to the characteristic, namely, given the value of perceptron input vector P and the target output vector T. Figure14 can be seen to determine the location of the border.
[image:7.612.122.261.562.684.2]Figure 14: Perceptron Training
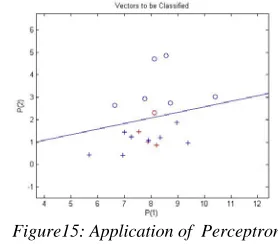
We use the trained perceptron to classify samples of unknown type. We are trained to detect 14 samples of gravure cells, and use the perceptron test four new samples .The results show in Figure15.
The simulation results show that gravure cells have been successfully sorted using perceptron neural network. This shows the validity of proposed method.
Figure15: Application of Perceptron
7. CONCLUSIONS
This paper developed a based on the weighted least squares digital halftoning. A detailed analysis
on the proposed algorithm was presented. Analysis results show that the proposed algorithm produces better gray-scale halftone image quality when we increase the number of clustering, in particular details of the image. Simulation results also demonstrated that the proposed algorithm achieves consistently lower values of MSEv than the Lsmb algorithm. As the cluster partition increases, the value of MSEv decreases. And the proposed algorithm achieves consistently higher values of PSNR than the Lsmb algorithm. As the cluster partition increases, the value of PSNR decreases. The proposed algorithm can further reduce the number of iterations. The main contents of cells in gravure cylinder are extract image feature value and sorting. We regard the machine vision as the theoretical basis for establishing the sorting system of cells in gravure cylinder. Firstly, the cells images are gained in the images capturing device. We have applied the MATLAB to read the experiment images and histogram equalization. The edge of cells is extracted by using of Canny operator. The value of gravure outlets gaps and dark tone are measured. Binarization images are obtained through adaptive threshold segmentation, which regards the value of gaps and dark tone as the characteristic value when they start to sorting. Then we apply neural network to classify the cells to two classes. The experimental results consider neural network model that produce properly sorting and gain true systematization consequences.
ACKNOWLEDGEMENTS
This work was supported by Project 60962007 of the National Science Foundation of China and Foundation of Kunming University of Science and Technology under Grant 2011-02.
REFRENCES:
[1] C. A. Bouman, “Digital Halftoning”,Digital
Image Processing,January 11 (2010).
[2] J.P. Allebach, Ed, “Selected Papers on Digital Halftoning”, Vol. MS 154, SPIE:Bellingham, WA(1999).
[3] Thrasyvoulos N. Pappas,Jan P. Allebach and
David L. Neuhoff,“Model-Based Digital
Halftoning”, IEEE Trans. Signal Processing
Magazine, Vol.7,2003,pp.14-27.
Processing, Vol. 11, No.9, 2000, pp. 1950-1963.
[5] D. 1. Neuhoff, T. N. Pappas, and N. Seshadri, One-dimensional Least-squares Model Based Halftoning”, in Proceedings of ICASSP, (San
Francisco, CA), March 1992, pp. III 189-192.
[6] R. A. Vander Kam, P. A. Chou, and R. M.
Gray, “Combined Halftoning and Entropy Constrained Vector Quantization”, in SID
Digest of Technical Papers, (Seattle,
WA),May 1993, pp. 223-226 .
[7] A. Zakhor, S. Lin, and F. Eskafi,“A new class of B/W halftoning algorithms”, IEEE Trans.
Image Processing, Vol. 10, No.2, 1993, pp.
499-509.
[8] A. Sherstinsky and R. W. Picard, “M-Iattice: A novel non-linear dynamical system and its application to halftoning”, in Proceedings of
ICASSP, (Adelaide, Australia), April 1994, pp.
(11-565)-(11-568).
[9] Thrasyvoulos N. Pappas and David L. Neuhoff, “Least-Squares Model-Based Halftoning”,
IEEE Trans. Image Processing, Vol. 8, No.8,
1999, pp. 1102-1116 .
[10] Bishop. C. M, “Neural Networks for Pattern
Recognition”, Oxford, England, Oxford
University Press,1995.
[11] Dan Pelleg and Andrew Moore,“Accelerating Exact k-means Algorithms with Geometric Reasoning”, Proc. Conference on Knowledge
Discovery in Databases 1999,(KDD99)
[12] Sang Ho Kim and Jan P. Allebach, “Impact of HVS Models on Model-Based Halftoning”, IEEE Trans. Image Processing, Vol. 3, No.11, 2002, pp. 258-269.
[13] Farhan A.Baqai and Jan P. Allebach,
“Halftoning via Direct Binary Search Using Analytical and Stoachastic Printer Models”,
IEEE Trans. Image Processing, Vol. 1, No.12,
2003, pp.1945-1959.
[14] Deng pu jun.Jin yang, “Packaging
Engineering”,Vol.27, 2006, pp.19-21.
[15] Rafail Bronstein, The United States.
Patent,6031932[P]. (2000).
[16] Anderson Rochaa, Daniel C. Hauaggeb,
Jacques Wainera, Siome Goldenstein,
“Automatic Fruit and Vegetable Classification from Images”, Computers and Electronics in
Agriculture,Vol. 70, 2010, pp. 96–104.
[17] Yousef Al Ohali, “Computer Vision Based Date Fruit Grading System”, Design and implementation. Computer and Information
Sciences, Vol. 23, No.9, 2002, pp. 29–36.
[18] Rafael C gonzalez. Richard E.Woods, “Digital
Image Processing Using MATLAB”,Publishing House of Electronics
Industry, Beijing ,2005.
[19] Zhu zhenwei.Liu guangrui and Liu qiaohong, “Modern Electronics Technique”, Vol. 24, 2009, pp. 89-90.