An Analytical Model for Power Control T-MAC Protocol
Ramchand V
School of Computer and Systems Sciences Jawaharlal Nehru University
New Delhi, India
D.K.Lobiyal
School of Computer and Systems Sciences Jawaharlal Nehru University
New Delhi, India
ABSTRACT
This paper presents a Power Control T- MAC protocol that combines the features from S-MAC and T-MAC protocols for Wireless Sensor Networks (WSN). This protocol has been proposed to reduce the energy consumption of a node. In WSN a node consumes energy in transmitting and receiving of data, listening transmissions of other nodes, and in sleep mode. Therefore, energy consumption of a node has been estimated by adding up the energy consumed in each of the above activity. This has been achieved by estimating the time spent in each activity by a node. The proposed protocol has been simulated using NS-2. The simulation results of Power Control T-MAC shows better energy savings as compared to T-MAC and S-MAC protocol.
Keywords
Wireless Sensor Networks, T-MAC, S-MAC, Power control and Poisson distribution.
1.
INTRODUCTION
Sensor networks are highly distributed networks of small, lightweight wireless nodes, deployed in large numbers to monitor the environments or system by the measurement of physical parameters such as temperature, pressure, or relative humidity. Building sensors has been made possible by the recent advances in Micro Electro Mechanical System (MEMS) technology.
Sensors have limited sensing region, processing power and energy. Networking a large number of sensors gives rise to a robust, reliable and accurate sensor networks covering a wider region. Sensors consume energy in sensing the object, processing and transmitting the data. Energy consumed in processing is negligible. However, energy consumed in other two tasks is significant that may results in frequent partitioning of WSN. Energy in WSN is very scarce resource due to limited battery power. Further, the advances made in battery technology are not sufficient to ensure the enough power required for longevity of network life. Therefore, it is inevitable to use the energy optimally both in sensing and transmission. However energy consumed in sensing is difficult to be used optimally.
Therefore, attention of researchers has been in designing energy efficient protocols that can use power in controlled manner for transmission of data.
Designing energy efficient protocols is a cross-layer research issue in wireless sensor network. However, using controlled power in transmitting of data and control packets is a MAC layer issue. Therefore, most power control protocols designed for WSN are medium access control protocols. The medium access control
since they have to coordinate the sharing of link among the thousands of randomly scattered sensors.
IEEE 802.11[3] is one of the most dominating MAC protocols in recent times. On the other hand the power control function of IEEE 802.11 cannot satisfy the needs of sensor network applications. Therefore, to meet the energy constraint of sensor network applications, T-MAC protocol was designed that proposes several schemes for improving traditional IEEE 802.11 [13]. In this paper we propose an analytical model for estimating energy consumption of sensor nodes using T-MAC protocol. Here we estimate the power consumption of a sensor node by calculating the time taken in processing of controls packets and data packets by each individual node.
The rest of this paper is organized as follows. We discuss the related work in section 2. In section 3 the basic T-MAC is presented in brief. In section 4 preliminary is explained. Section 5, the design of proposed model is explained. Section 6 presents the simulation results and finally, we conclude the paper in section 7.
2. RELATED WORK
Sensor Medium Access Control (S-MAC) [14] protocol has been designed to reduce energy consumption, support scalability and collision avoidance. S-MAC protocol tries to reduce energy consumption from all the sources of energy wastage such as idle listening, collision, overhearing and control overhead. This protocol consists of major components like periodic listen and sleep, collision and overhearing avoidance, and message passing. S-MAC adopts a contention-based scheme. Common Scenario is that any packet transmitted by a node is received by all its neighbors even only one of them is its intended receiver. Overhearing makes contention-based protocols less energy efficient. For a packet moving through a multi-hop network, it experiences the certain delays like carrier sensing delay, back-off delay, transmission delay, propagation delay, and processing delay. These delays are inherent to a multi-hop network using contention-based MAC protocols. These are the common factors for both S-MAC and IEEE 802.11protocols. S-MAC protocol has better energy conserving property compared to IEEE 802.11. It also has the ability to make trade-off between energy and latency in different traffic scenarios.
avoid such situation messages are queued at the neighboring nodes.
Communication among nodes occurs with use of Request-To-Send (RTS), Clear- To-Request-To-Send (CTS), data, and Acknowledgement (ACK), these schemes also provides collision avoidance and reliable transmission in the network. Every node in the network listens and potentially transmits frames as long as it is in an active mode. Active mode ends when no event occurs over a specified period of time. At the end of the active mode node goes in to sleep mode. All the messages are buffered which arrives during the sleep period. T-MAC protocol moves all these messages to a burst at the beginning of next active period and transmits as a frame. Therefore, buffer capacity determines the frame time for transmission of messages.
Power Control Algorithm (PCA) [6] allows several improvements in the operation of Wireless Sensor Networks. The node which is in the process of forwarding data packet to its neighbors chooses the shortest path which consumes minimum energy and gives the high probability of successful delivery ratio. Power Control Algorithm decreases the transmission power level where link reliability is high, but consumption of energy is low.
3.
BASIC T-MAC PROTOCOL
The following are the main three characteristics of T-MAC protocol.
• It reduces idle listening by transmitting all messages in a burst of variable length and sleeping between bursts.
• In order to maintain an optimal active time under variable load the length of the data to be transmitted is determined dynamically.
• The active time of a node ends when no event is heard over a specified period of time.
4.
PRELIMINARY
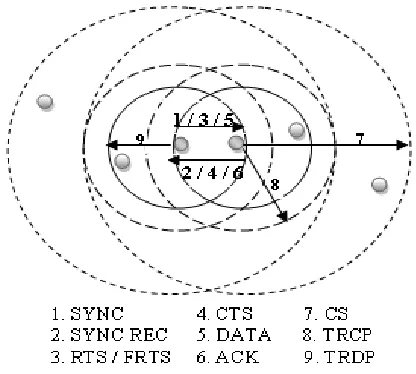
At the initial stage a node in the network broadcasts its SYNC packet with maximum transmission power i.e. PTXMAX in order to
synchronize its schedule for reducing control overhead. When synchronization is done, the transmission power is divided into different levels i.e., from PTXMIN to PTXMAX. A node sends an RTS
packet to another node, using maximum power.
threshold TMIN TXMAX
P
P
r_
r
P
P
=
(
1
)
P
P
*
r
r_threshold TMAX
TXMIN
P
P
=
)
2
(
P
P
*
r_ r threshold TXMIN TXMAX
P
P
=
Where, Pr_threshold is the minimum necessary received signal
strength. PTXMAX is the maximum power transmitted. PTXMIN is the
[image:2.612.330.538.69.256.2]minimum power transmitted.
Figure 1: Transmission Range
The receiver upon receiving the RTS packet calculates the minimum required transmission power level. The calculated transmission power should lie within the nominal limit of the transceiver [8]
TXUpper TXMIN
TXLower
P
P
P
≤
≤
The ratio of received power and transmit power can be given by [1]
2
4
=
d
G
P
P
lTx Rx
π
λ
where
G
l is the product of the transmit and receive antenna field radiation patterns in the LOS direction, λ is the wavelength, d is the distance. Transmission power of a node is given by)
3
(
16
*
PR
Xthreshold 2 2
≥
λ
π
l TMING
d
P
When a node receives data, the received data may include noise. In order to decode the received data the receiver power level should be greater than the power level of the noise, therefore the power used to transmit the data should be greater than or equal to the threshold value.
RX TXMIN
P
P
P
*
SNR
threshold Tx≥
SNR, Signal to noise ratio is represented by [1]
( )
>
=
Th
Where ‘P’ is power,
l
( )
x
,
y
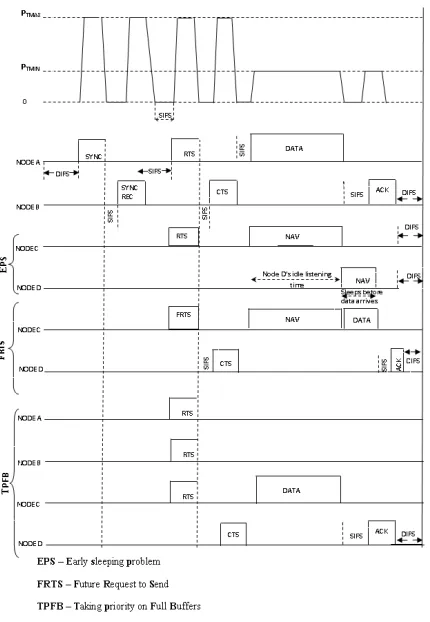
is a loss factor, ‘x’ and ‘y’ be any two nodes in the network which are engaged in communication, ‘N’ is the noise & ‘Th’ is the threshold value. The receiver sends the CTS frame with maximum power i.e., PTXMAX. After the [image:3.612.68.283.238.549.2]RTS-CTS handshake the sender node has the information of the required minimum transmission power. The DATA and ACK frames are transmitted at minimum required power level. When source and destination nodes transmit RTS and CTS packets, nodes in the transmission range correctly receive these packets and set their NAVs for the duration of the whole packet transmission. However [13], nodes in the carrier sensing zone only sense the signal and cannot decode it correctly, therefore these nodes set their NAVs for EIFS duration. The NAV setting and the power level changes for SYNC–(SYNC-REC)–RTS– CTS–DATA–ACK transmissions are depicted below.
Figure 2 NAV Settings
In power control mechanism the SYNC and RTS packets are transmitted with maximum power PTXMAX. CTS packets are sent
using maximum receive power PRXMAX. DATA and ACK packets
are transmitted with minimum power PTXMIN and PRXMIN
respectively.
5. PROPOSED ANALYTICAL MODEL
Consider a time period T during which, the total power consumed by a node is expressed as( )
T
(
T
k*
P
tR
k*
P
r t*
p
l(
1
(
)
)
T
*
p
s)
(
4
)
P
=
+
+
β
+
−
α
+
β
Where Tkand Rkdenote the number of messages transmitted and received by a node. Pt and pr is the power consumed in transmitting and receiving of a packet, respectively.
βt is the idle time of a node. Since the idle time is a fixed period, therefore, the power consumption during this period will be a constant. (1-(α+β))T is the time spent in sleep mode by a node. A node while in sleep mode, it has to updates its timing and consumes very small power for this activity, therefore we assign a constant value for pswhich is power consumed in sleep mode by a node.
It is assumed that a node with Poisson distribution transmits packets at rate of
λ
T packets/second and at the rateλ
R packets/second.To transmit a message a node takes τ time, According to T-MAC protocol a node transmits all its messages as a burst in a given time. Then at the receiving node, the average arrival rate λR of a node
τ
λ
R=
1
According to Poisson distribution the probability of transmitting a message is.
(
)
( )
!
1
1
*
1
1 )
1
( τ
τ
−
=
=
e
X
P
Therefore the probability of successfully transmitting ‘k’ number of messages by a node with respect to time is
(
)
( )
(
5
)
!
1
*
) 1 ( ...
2 , 1
k
e
k
X
P
T
k x
k
τ
τ
−
=
=>
=
=
Similarly the same node may also be receiving k messages from his vicinity, therefore the probability of successful receiving of ‘k’ messages is
(
)
( )
(
6
)
!
1
*
) 1 ( ..
2 , 1
k
e
k
X
P
R
k x
k
τ
τ
−
=
=>
=
=
5.1 Time estimation
As referred in [14] when a node has a packet to transmit, it has to consider carrier sense delay (tcs), backoff delay (tbo), transmission
delay, processing delay and sleep delay (tsd). All the delays are the
same as IEEE 802.11 protocol expect the sleep delay.
In T-MAC protocol the active time and sleep time are random. The active time consist of (transmitting \ receiving) time and Itime
the listen time during which a node listens for any event. If no event occurs during Itime period, a node goes in to sleep mode. The
(
i t)
Time
c
R
ta
I
=
1
.
5
*
+
+
For the calculation of ITime, we consider the idle period as
the suggested in [13]. ci is the length of the contention interval. R is the length of the RTS packet.tat is the turnaround time. Turn-around time is the short time between the end of the RTS packet and the beginning of the CTS packet.
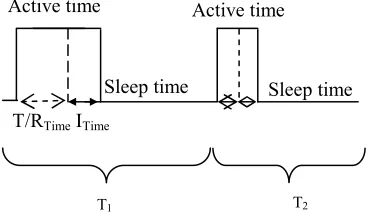
T / RTime – Transmit / Receive time
ITime – Idle time
[image:4.612.81.266.185.295.2]T1, T2 – Timecycle1, Timecycle2…
Figure 3: Timing Cycle
During active time a node may involve in process of transmitting and receiving the data. Any node in a network may be involved in a series of sequence of active mode followed by sleep mode. The sequence of these two modes collectively forms a cycle and the total time a node spends in a cycle is called cycle time (Tcycle1).
Therefore a node may get into the state of active and sleep mode for ‘n’ times. A node may have many such cycles until its battery drains.
(
)
11 active sleep
cycle
T
T
T
=
+
Where
T
active=
T
transmit/receive+
I
Time( )
Time k activeI
k
e
T
=
+
−
!
1
*
) 1( τ
τ
Where τ = l / r
Where l is length of data packet, r is the rate at which packet is received by a node. Therefore
)
7
(
!
1
*
1 Time k r l activeI
k
r
l
e
T
+
=
− active cyclesleep
T
T
T
=
−
1
We assign Ttransmit/Receive =
!
1
*
1k
r
l
e
k r l
−=> αT1
ITime => βT1
(
1 1)
1
T
T
T
T
Sleep=
−
α
+
β
(
)
(
1
)
T
1(
8
)
T
Sleep=
−
α
+
β
With the time estimation, a node can alert its neighbor by transmitting the values of TActive and TSleep through SYNC packets.
Life time of a network depends on the available energy of all the nodes. It is obvious that when time increases the energy of a node decreases, and both are inversely proportional to each other. When a node is in transmitting or receiving mode it spends time in carrier-sensing, back-off, RTS, CTS, DATA & ACK packets. Therefore power consumption of a node during transmission mode Pt is
)
9
(
*
*
*
*
TXMIN DATA TXMAX RTS Itime BO CS tP
t
P
t
p
t
p
t
P
+
+
+
=
γpγis the power consumed in Carrier-sensing which is a constant value. p Itimeis power consumed in Back-off mode.
Power consumption of a node during receiving mode Pr is
)
10
(
*
*
RXMAX ACK RXMAXCTS
r
t
P
t
P
P
=
+
Substituting equations 5, 6, 7, 8, 9, 10 and 11 in equation 4 we obtain the power consumption of a node. With this information, we can estimate the remaining power of a node. Based on the requirement of application and the availability of remaining power a node may or may not be employed in network traffic.
Active time
Sleep time
Active time
Sleep time T/RTime ITime
6. SIMULATION RESULTS
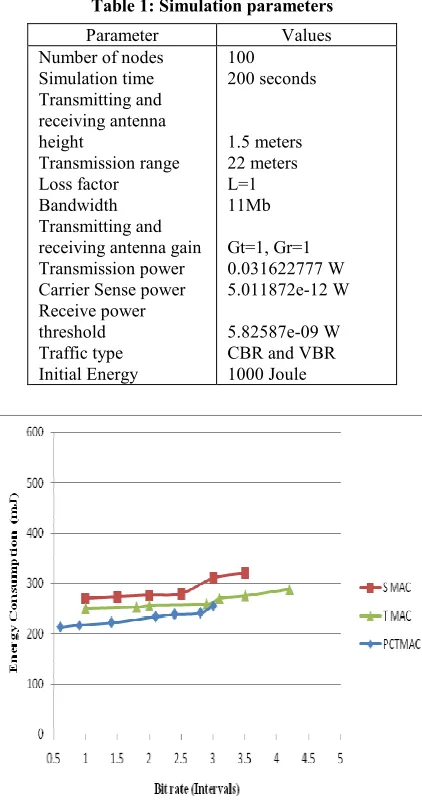
[image:5.612.68.279.163.567.2]The proposed Power Control T-MAC protocol (PCT-MAC) is implemented using NS-2 simulator. We analyze the performance of PCMAC protocol and compared it with the performance T-MAC and S-T-MAC protocol using the same simulation parameters with fixed network size. The simulation parameters are listed in the table below:
Table 1: Simulation parameters
Parameter Values
Number of nodes Simulation time Transmitting and receiving antenna height
Transmission range Loss factor Bandwidth Transmitting and receiving antenna gain Transmission power Carrier Sense power Receive power threshold Traffic type Initial Energy
100 200 seconds
1.5 meters 22 meters L=1 11Mb
Gt=1, Gr=1 0.031622777 W 5.011872e-12 W
5.82587e-09 W CBR and VBR 1000 Joule
Graph 1: Comparison of Energy consumption between S-MAC, T-MAC and PCT-MAC
The proposed work combines features from S-MAC protocol and T-MAC protocol. We are proposing analytical model for computing power consumption of individual nodes in the network. Our proposed protocol Power Control T-MAC (PCT-MAC) supports constant bit rate as well as variable bit rate traffic and performs better for bursty traffic. Nodes in network using PCT-MAC protocol consume minimum energy in packet transmission of individual node than the S-MAC and T-MAC protocol in the network. If the power of a node in a network is
lower than the threshold value, the node automatically goes into sleep mode. Our model is calculating power consumption of every individual node with idle listen and sleep time. Node in a network dynamically changes its state according to availability of remaining power level.
7. CONCLUSON
In this work, we have proposed A Power Control T-MAC protocol for Wireless Sensor Networks where power consumption of every individual node is calculated using listen and sleep time. Based on the available power of a node and estimated cycle time, a node save its energy by changing its mode periodically. Our proposed Power Control T-MAC protocol for energy consumption shows better results than S-MAC and T-MAC protocols.
ACKNOWLEDGMENT
I would like to acknowledge Mr. Sushil Kumar Asst. professor, School of Computer and Systems Sciences Jawaharlal Nehru University, for his valuable initiatives in designing this model.
8. REFERENCE
[1] Andrea Goldsmith, Cambridge University press 2007, Wireless Communication.
[2] C. Siva Ram Murthy, B.S.Manoj, Department of Computer Science & Engineering, IIT Madras, Pearson Education 2005, Ad hoc Wireless Sensor Networks.
[3] Eun-Sun Jung and Nitin H. Vaidya “A Power Control MAC Protocol for Ad Hoc Networks”, Springer Science and Business Media, Wireless Networks 2005, Netherlands.
[4] Giruseppe Bianchi, “Performance analysis of IEEE 802.11 DCF”, IEEE Journal on selected areas in communications, March 2000.
[5] H.W.Tseng, S.H.Yang, P.Y. Chuang, E.H.Kuang and G.H. Chen, "An Energy consumption analytic model for a Wireless Sensor MAC protocol”, in proceedings of IEEE Vehicular Technology Conference (VTC’ 2004) September 2004, pp 4533-4537.
[6] Jian Xiao and Fengqi Yu, “An Energy Efficient Transmission Power Control Algorithm in Wireless Sensor Networks”, in preceddings of 2007 pp. 2767-2770.
[7] Konstantinos Kalpakis, Shilang Tang, “Maximum lifetime continuous query processing in wireless sensor networks” Science Direct Ad Hoc Networks, Volume 8, Issue 7, April 2010.
[8] Luiz H.A. Correia and Jose Marcos S. Nogueira, “Transmission Power Control Techniques for MAC protocol in Wireless Sensor Networks”, Network Operations and Management Symposium 2008 IEEE.
[10]Minghao Cui, Violet R. Syrotiuk, “Time–space backoff for fair node throughput in Wireless Networks using power control”, Science Direct Ad Hoc Networks, Volume 8, Issue 7, April 2010
[11]Nikolaos A. Pantazis Dimitrios J, Vergados, Imitrios D. Vergados, Christos Douligeris, “Energy Efficiency in Wireless Sensor Networks using sleep mode in TDMA scheduling”, Science Direct Ad Hoc Networks, Volume 7, Issue 2, March 2009.
[12]Sinha, Amit Sinha, Anantha Chandrakasan, “Dynamic power management in Wireless Sensor Networks”, IEEE Design and Test of computers, March-April 2001
[13]Tijs Van Dam and Koen Lanendoen, “An Adaptive Energy Efficient MAC Protocol for Wireless Sensor Networks”, The first ACM Conference on Embedded Network Sensor Systems, Los Angels, CA, USA November 2003.
[14]Wei Ye, John Heidehann, Deborah Estrin, “An Energy Efficient MAC protocol for Wireless Sensor Networks”, INFOCOM 2002, IEEE Computer and Communication Socities Proceedings, Volume 3.
[15]Wang, Jun-Jie Ma, Sheng Wang and Dao-Wei Bi, “Prediction based Dynamic Energy Management in Wireless Sensor Networks”, Sensors Journal 2007, Volume 7, Issue 3.
[16]Yan Wua, Sonia Fahmy b, Ness B. Shroff, “Sleep/wake scheduling for multi-hop sensor networks: Non-convexity and approximation algorithm”, Science Direct Ad Hoc Networks, Volume 8, Issue 7, April 2010.