A Comparative Study of Traditional and Mobile based
ECG System Algorithms
Dipti Patil
Dept. of Computer Engineering MIT College of Engineering
Pune, India
Tejashree Chhajed
Dept. of Computer EngineeringMIT College of Engineering Pune, India
V. M. Wadhai
PrincipalMIT College of Engineering Pune, India
Prasad Pomaji
Dept. of Computer EngineeringMIT College of Engineering Pune, India
Abhinav Sharma
Dept. of Computer EngineeringMIT College of Engineering Pune, India
Bhagyashri Samanta
Dept. of Computer EngineeringMIT College of Engineering Pune, India
ABSTRACT
ECG is a very important tool for cardiac health status measurement and detection of various diseases at their early stage. Thus, it will be helpful in providing such analysis on the move using a mobile device. The basic aim for such implementation would be an accurate, efficient yet light-weighted algorithm that is simple to implement on mobile. With a lot of traditional techniques been developed, it is important to study them correctly and use the right combination to achieve the desired result for efficient processing. This paper discusses comparative study of traditional and mobile based ECG feature extraction techniques and design of a mobile based ECG classification system.
General Terms
Your general terms must be any term which can be used for general classification of the submitted material such as Pattern Recognition, Security, Algorithms et. al.
Keywords
ECG analysis, Feature Extraction, Mobile phone development
1.
INTRODUCTION
ECG is a continuous wave plotted over mV on the y-axis and time over the x-axis. ECG is a reliable method for checking the cardiac health status used over time. ECG is a record of direction and magnitude of the electrical signal generated by the heart‟s atria and ventricles. This is caused by the repetitive polarization and depolarization taking place to acquire the sufficient flow of blood throughout the body. The ECG signal is broken down into sections known as P-QRS-T waves as shown in Fig-1 which repeat with every heart beat. These waves form the basic structure and are to be analyzed to get an effective over-view of the heart status.
P-QRS-T detection and feature extraction are important part of ECG analysis as these values are used and processed to determine overloading and abnormal functionality of heart. Early detection of such diseases can prevent many diseases such as arrhythmia, hypoglycemia etc. A mobile and light weighted system that can be implemented on mobile phone would be very useful. Thus, the purpose of the paper is to study and provide a system which not only correctly extracts features in an ECG signal but also has a low computational
cost. The mobile based ECG classification provides a personalized health screening system, which will be an effective preventive system for heart diseases.
The paper is divided into sections with the Section 2 discussing the stages and blocks in ECG evaluation and pattern recognition. The 3rd section discusses various algorithms that can be efficient for QRS detection and Feature Extraction which form the important units in making inference from the ECG wave-form. The 4th section tells about the steps to be followed in construction of a system followed by conclusion.
Fig 1: A sample ECG wave showing P-QRS-T wave
2.
BLOCK- STRUCTURE OF ECG
In the recent years, the task of automated analysis of ECG waves has been broken down in parts namely:
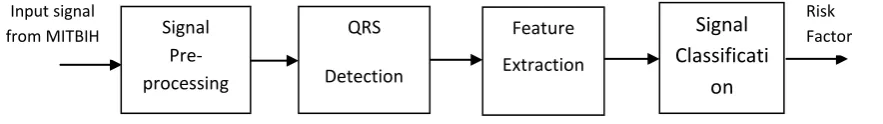
(i) Signal Pre-processing (ii) QRS-detection (iii) Feature Extraction (iv) Signal Classification.
Each process is assigned a given task and must be processed in a sequential manner, thus input for one block is the output of the previous block. Various techniques have been worked on for each block which yields accurate results. This paper
PR interval
QT interval
Q
ST segment
T
P
R
would be focusing on QRS detection and Feature extraction techniques which would be efficient, robust yet light weighted to be implemented on mobile phone. This is because QRS is
[image:2.595.91.533.120.182.2]an important part which relates to most of disease related problems. Figure 2 shows the basic steps in ECG classification process.
Fig 2: Steps in ECG Classification
2.1
Signal Pre-Processing
This involves process of filtering of the input to avoid unwanted noise and interference which affect the signal. This helps further processes to work properly and infer more accurate results. Base-Line drift is removed by employing Adaptive filtering techniques which helps in calculating the P-QRS-T intervals.
2.2
QRS Detection
QRS wave is the most striking wave and its time of occurrence and shape provide a lot of information about the current state of heart. The QRS detection algorithm works to single out the QRS wave in an ECG wave-form.
2.3
Feature Extraction
The Feature Extraction system provides fundamental features of the ECG wave which includes amplitude and intervals. Feature extraction is further broken down in:
2.3.1
Morphological Features
All amplitudes and intervals are generated. For example QRS Area, QT- segment, RR-segment. These values are of the highest importance.
2.3.2
Statistical Feature
QRS Energy and Auto-correlation coefficient are calculated.
The different algorithms will be discussed to compare the efficiency and feasibility of the algorithms.
2.4
Signal Classification
The process of comparing the extracted values to the expert rules is signal classification. These expert rules are standardized and under normal circumstances the ECG should satisfy these rules. Sometimes the rules can also be learned automatically by means of analysis techniques like data mining, ANN, fuzzy systems etc. This system is intelligent enough to learn the behavior of the ECG signals and predict the health status of the patient.
3.
ALGORITHM OVERVIEW
The paper discusses and studies traditional and mobile based algorithms that operate optimally and give accurate results. The focus is on the QRS Detection and Feature Extraction processes because these units are of extreme importance.
3.1
QRS Detection
The main difficulties in QRS complex detection can be summarized as follows:
(i) Negative QRS polarities (ii) Low SNR (noisy ECG signal)
(iii) Non-Stationary Signal (statistical properties of the ECG signals change with time)
(iv) Low QRS amplitudes,
There are a large number of QRS detection schemes available. We will consider some algorithms to provide insight into an efficient system. The two basic criteria used in selection are:
1. Complexity 2. Performance.
After a survey we found that according to the performance criteria, algorithms with high noise sensitivity had to be rejected. The selected algorithms were insensitive to low noise levels and were practical enough for incorporation in clinical systems. There are three basic traditional types of algorithms included in this study, with their advantages over the others.
(i) Algorithms based on both amplitude and first derivative (AF).
(ii) Algorithms based on first derivative only (FD).
(iii) Algorithm utilizes both first and second derivative (FS).
3.1.1
Algorithms Based On Both Amplitude And
First Derivative (AF)
It is an adaptation of the Analog QRS detection scheme developed by Neuman. AF2 algorithm based on both amplitude and first derivative, accurately calculates the qrs wave.
(i) Electromyography Noise:
AF2 algorithm is more accurate in correctly identifying all of the QRS complexes without incurring any false positives. The noise is effectively eliminated in AF2 on the basis of its amplitude characteristics.
(ii) Power-line Interference:
The algorithm is able to correctly locate all of the QRS complexes. It is also able to do so without generating any false positives.
.
The algorithm employs a threshold value calculated over the period of the input. This threshold corresponds to the amplitude of the system helps to float over the noise. Derivative is calculated over the rectified wave above the threshold. A QRS candidate occurs when a point in the derivative exceeds the fixed constant threshold of 0.7.
3.1.2
Algorithms Based On First Derivative Only
(FD)
FD1 algorithm is a modification of early digital QRS detection scheme. The derivative is calculated for ECG. The derivate is searched to note points exceeding the slope
Signal Pre-processing
QRS
Detection
Feature
Extraction
Signal
Classificati
on
Input signal from MITBIH
threshold. A QRS candidate occurs if another point in the next three samples exceeds the threshold. We select FD1 algorithm, as in [1] from the list of algorithms based on first derivative only for the following reasons:
(i)Baseline shift:
The algorithm is able to locate all QRS complexes without generating any false positives.
(ii) Power-line Interference:
The algorithm is able to accurately locate most QRS complexes. It is also able to do so without generating any false positives.
FD1 algorithm description:
This algorithm was adapted from one developed by Menard. The first derivative, as in [3] is calculated for each point of the ECG, using a formula
The slope threshold is calculated as a fraction of the maximum slope for the first derivative array.
The first derivative array is searched for points which exceed the slope threshold. The first point that exceeds the slope threshold is taken as the beginning of a QRS candidate,
3.1.3
Algorithm Utilizes Both First and Second
Derivative (FS)
FS2 is actually the Hamilton–Tompkins algorithm which applies a squaring function to rectify the differentiated ECG. The squaring function provides further attenuation of other ECG features, leaving the QRS complexes as outstanding positive peaks in the signal regardless of their polarity in the original ECG recording. The transform can also be viewed as a measure of energy with a threshold that verifies if the output is enough to carry the energy of a QRS complex.
3.1.4
Combinatorial ECG Analysis:
In combinatorial ECG analysis as in [15], the reading are taken at regular time intervals in the form of (pn tn) where pn is the electrical potential of the lead and tn is the current time. The readings are taken at regular time intervals, sample rate σ. The algorithm maintains 5 counters namely, +count, -count, ++count, --count and 0count. The appropriate counter is incremented when the current series is C[x, k] and di is not equivalent to x. A new series is identified when the di counter reaches a certain value v. All the counters are zeroed when a new series is found. Two threshold value are calculated namely, a low threshold (μ) and high threshold (μ‟).
The direction of the rate of change is a character d. To determine di the criteria is
A stack is put to use for keeping track of previous qR location compared along with the current qR location in the ECG wave. The RR interval can thus be calculated, giving a measure of the heart rate.
This algorithm, as in [14] is simple and has a low computation cost, effective for mobile implementation. The computing time is also less thus, it provides a faster result.
3.2
Feature Extraction:
The purpose of feature extraction is to find as few properties as possible within ECG signal that would allow successful abnormality detection and efficient prognosis. Feature extraction process as told works to generate two feature types, those are:
(i) Morphological Features (ii) Statistical Features.
These provide exact values for each segment that is of importance in the ECG wave-form hence, the accuracy is of prime importance. The classifying method which have been proposed during the last decade and under evaluation includes digital signal analysis, Fuzzy Logic methods, Artificial Neural Network, Hidden Markov Model, Genetic Algorithm, Support Vector Machines, Self-Organizing Map, Bayesian and other method with each approach exhibiting its own advantages and disadvantages.
We have discussed techniques for both time domain as well frequency domain in feature extraction. Wavelet method because of its effectiveness in mapping of time and frequency together provides a viable option. On implementation along with other techniques, an accurate system is achieved. While a time domain analysis of ECG would provide a simple and easy to implement system useful for mobile based ECG classification. Time domain analysis along with ANFIS classifier provides accurate and adaptive ECG signal analysis. ANFIS Classifier which is a combination of neural network and fuzzy logic integrates features of both these techniques.
3.2.1
Wavelet Transform:
The wavelet transform is used to extract the coefficients of the transform as the features of each ECG segment.
The wavelet transformation as in [6] is based on a set of analyzing wavelets allowing the decomposition of ECG signal in a set of coefficients. Each analyzing wavelet has its own time duration, time location and frequency band. The wavelet coefficient resulting from the wavelet transformation corresponds to a measurement of the ECG components in this time segment and frequency band.
The practical benefit of the wavelet based ECG approach is that T-wave abnormalities can be assessed without the need for T-wave end point identification. The peaks of QRS complexes flatten and P- and T-waves containing lower frequencies become more visible. At the same time the details at lower scales constitutes the higher frequencies of the signal. The benefit of the wavelet transformation thus, lies in its capacity to highlight the details of the ECG signal with optimal time frequency resolutions.
recognition methods, which separates an input example X = (xl, ...xd) of dimension d into two classes. A decision function of SVM separates two classes by f(X) > 0 or f(X) < 0. This algorithm discussed is found to be accurate and thus is efficient to implement on a traditional system however a mobile based system has limitations.
3.2.2
Time Domain Analysis of ECG:
Time domain analysis is simple to perform and leads to determination of either heart rate at any point of time or the intervals between successive normal complexes also known as NN interval. A time domain analysis [16] along with an adaptive classifier is a strong tool and can be used to provide a simple to implement and low requirement ECG signal classifier.
Four standard measured parameters are:
(i) The standard deviation of NN intervals (SDNN).
(ii) The standard deviation of differences between the adjacent NN intervals (SDSD).
(iii) The root mean square successive difference of intervals (RMSSD).
(iv)The number of interval differences of successive NN intervals greater than 50ms (NN50) used for the proportion derived by dividing NN50 by the total number of NN intervals (pNN50).
Using these values more complex statistical data can be calculated over a longer period of time. These variables may be derived from analysis of total ECG wave or a smaller segment of the recording period.
3.2.3
ANFIS Classifier
ANFIS is a FIS implemented in the framework of adaptive fuzzy neural network. The advantage of fuzzy set in the representation of prior knowledge into a set of constraints to reduce the optimization research space is utilized. ANFIS[10] has a similar structure to a multilayer feed forward neural network but the links in an ANFIS only indicate the flow direction of signals between nodes and no weights are associated with the links.
ANFIS uses a strategy of hybrid training algorithm to tune all parameters. It takes a given input/output data set and constructs a fuzzy inference system whose membership function parameters are tuned, or adjusted, using either a back-propagation algorithm in combination with a least squares type of method. To achieve good generalization toward unseen data, the size of the training data set should be at least as big as the number of modifiable parameters in ANFIS. The neurons in ANFIS as in [16] have different structures.
(i) The Membership function is defined by parameterized soft trapezoids (Generalized Bell Functions).
(ii) The rules are differentiable T-norm usually product. (iii) The Normalization is by Sum and arithmetic division. (iv) Functions are linear regressions and multiplication with w, that is, normalized weights ω, and Output (Algebraic Sum). Hybrid systems are a growing research area in medical applications. The statistical parameters are used as input for the ANFIS classifier and provide accurate result.
The advantage of time domain analysis and ANFIS classifier is simplicity, ease of implementation and is adaptable in nature.
4.
SYSTEM STRUCTURE
The Main steps to be performed in the system are:
1. While Input ECG from MIT-BIH Database at sample rate Do
2. Perform Signal Pre-processing using adaptive filters: 2.1 Remove Base line Drift
2.2 Remove Noise caused by various measures. 2.3 If resultant ECG crosses threshold value drop the signal goto 1.
3. Perform QRS detection technique:
3.1 Calculate the Adaptive threshold. 3.2 Find the QRS segment.
3.3 Thus, the one heart beat wave-form, P-QRS-T should be confined in one segment. 3.4 Amplitudes of P wave, QRS wave and T wave are calculated.
4. Perform Feature extraction: The aim is to find least number of features to deduce the right inference.
4.1 Find the morphological features: 4.1.1 QRS area
4.1.2 QRS duration 4.1.3 R-R interval 4.1.4 PR interval 4.1.5 R wave amplitude 4.1.5 RT interval 4.1.6 QT segment 4.1.7 ST interval 4.2 Find Statistical features:
4.2.1 QRS energy
4.2.2 Auto-correlation coefficient 5. Perform Signal Classification:
5.1 Apply standard rules on the morphological and statistical features calculated or input the extracted features to data mining algorithms for self learning the rules and predicting the cardiac status of the patient.
5.2 Display the Status. 6. Goto step 1
5.
CONCLUSION
With the different processing speeds and memory available for computation in traditional devices and mobiles, the techniques efficiency parameters differ. The comparison of traditional and mobile based ECG classification techniques, keeping track of requirements of different systems is done successfully. With algorithms belonging to both morphological and statistical features extraction compared, the study is not bound to small sections of techniques
The system structure design provides an ECG classifier that can be used in designing any kind of system. The system structure describes the important blocks and can be used for a mobile based system by choosing appropriate algorithms.
6.
REFERENCES
[1] Natalia M. Arzeno, Zhi-De Deng, and Chi-Sang Poon, „Analysis of First-Derivative Based QRS Detection Algorithms‟, IEEE TRANSACTIONS ON BIOMEDICAL ENGINEERING, VOL. 55, NO. 2, FEBRUARY 2008
[2] Jiapu pan and Willis J. Tompkins, „A Real-Time QRS Detection Algorithm‟, IEEE Transactions on Biomedical Engineering, March 1985.
QRS Detection Algorithms‟, IEEE Transactions on Biomedical Engineering. Vol. 37. No. I. January 1990
[4] Mohamed Elgendi, Sivaram Mahalingam, Mirjam Jonkman, Friso De Boer , „A Robust QRS Complex Detection Algorithm using Dynamic Thresholds‟, International Symposium on Computer Science and its Applications
[5] Patrick E. McSharry, Gari D. Clifford, Lionel Tarassenko, and Leonard A. Smith,‟ A Dynamical Model for Generating Synthetic Electrocardiogram Signals‟,
IEEE TRANSACTIONS ON BIOMEDICAL
ENGINEERING,VOL.50,NO.3,MARCH2003
[6] Yuliyan Velchev and Ognian Boumbarov, „Wavelet Transform Based ECG Characteristic Points Detector‟, International Scientific Conference Computer Science 2008.
[7] Qibin Zhao, and Liqing Zhan, “ECG Feature Extraction and Classification Using Wavelet Transform and Support Vector Machines,” International Conference on Neural Networks and Brain, ICNN&B ‟05, vol. 2, pp. 1089-1092, 2005.
[8] S.Karpagachelvi, Dr.M.Arthanari, M.Sivakumar, „ECG Feature Extraction Techniques - A Survey Approach‟, (IJCSIS) International Journal of Computer Science and Information Security, Vol. 8, No. 1, April 2010
[9] I. Romero, L. Serrano, „ECG frequency domain feature extraction: a new characteristic for Arrhythmias‟, Engineering in Medicine and Biology Society, 2001. Proceedings of the 23rd Annual International Conference of the IEEE
[10]T. M. Nazmy, H. El-messiry, B. Al-bokhity „Adaptive Neuro-fuzzy inference system for Classification of ECG signals‟, Journal of Theoretical and Applied Information Technology February 2010 | Vol. 12. No.2
[11]K. W. Goh, J. Lavanya, Y. Kim, E. K. Tan and C. B. Soh , „A PDA-based ECG beat detector for home cardiac care‟, Proceedings of the 2005 IEEE Engineering in Medicine and Biology 27th Annual Conference
[12]Can Ye, Miguel Tavares Coimbra and B.V.K. Vijaya Kumar, „Arrhythmia Detection and Classification using Morphological and Dynamic Features of ECG Signals‟, IEEE EMBS, August 31 - September 4, 2010
[13]B. Castro, D. Kogan and A. B. Geva, „ECG feature extraction using optimal mother wavelet‟, Electrical and Electronic Engineers in Israel, 2000.
[14]Costas S. Iliopoulos, Spiros Michalakopoulos, „Combinatorial ECG Analysis for Mobile Devices‟, MIR '10 Proceedings of the international conference on Multimedia information retrieval
[15]Costas S. Iliopoulos, Spiros Michalakopoulos, „A Combinatorial Model for ECG Interpretation‟, World Academy of Science, Engineering and Technology 54 2009