Intelligent information systems for
defence problems
Andreou, Andreas S. and Zombanakis, George A.
University of Cyprus, Bank of Greece
14 July 2003
Online at
https://mpra.ub.uni-muenchen.de/38637/
SOLVE COMPLICATED DEFENCE
PROBLEMS
THE GREEK–TURKISH ARMS RACE AND THE CYPRUS ISSUE
Andreas S. Andreou and George A. Zombanakis (eds.)
List of Contributors
Andreas S. Andreou
Nicos H. Mateou
Konstantine Parsopoulos
Michael Vrahatis
Introduction 1
Chapter 1 Financial Versus Human Resources in the Greek-Turkish Arms Race: A Forecasting Investigation Using Artificial Neural Networks
11
1.1 Introduction 11
1.2 Literature overview 12
1.3 Technical background 14
1.4 Input/output variables and scenarios 18
1.5 Empirical results 21
1.6 Conclusions 32
1.7 References 34
Interim 1 37
Chapter 2 A Neural Network Measurement of Relative Military Security − The Case of Greece and Cyprus
43
2.1 Introduction 43
2.2 Literature overview and theoretical background 44
2.3 Technical background 49
2.4 Policy simulations 56
2.5 Conclusions 62
2.6 References 63
Chapter 3 Optimal Versus Required Defence Expenditure: The Case of the Greek – Turkish Arms Race
75
3.1 Introduction 75
3.2 Literature overview 76
3.3 The model 77
3.4 Policy considerations 92
3.5 Conclusions 99
3.6 References 101
Interim 3 105
Chapter 4 Optimal Versus Required Defence Expenditure Revisited: The Case of the Greek – Cypriot Alliance
109
4.1 Introduction 109
4.2 Literature overview 110
4.3 The model modifications 112
4.4 Empirical results 115
4.5 Conclusions 120
4.6 References 121
Interim 4 123
Chapter 5 The Cyprus Puzzle and the Greek – Turkish Arms Race: Forecasting Developments Using Genetically Evolved Fuzzy Cognitive Maps
127
5.1 Introduction 127
5.2 Technical background 130
5.5 Conclusions 149
5.6 Update 150
5.7 References 151
Epilogue 153
“Greeks and Turks have been condemned by History to learn how to co– exist” (Constantine Mitsotakis, Greek Prime Minister, Parliament speech on foreign policy, February 24, 1992).
If we were asked to describe the relations between Greece and Turkey in a manner
as comprehensive as possible then a good idea would be “a long history of unsolved
problems”. The extent to which some or, maybe, even all of these problems would have
been solved in the course of time, has remained an open issue offering ample room to
what economists call “normative thinking” involving personal evaluations and value
judgments. A representative sample of such normative thinking, can be easily traced
during various media shows in Greece when a wide variety of “experts” are invited to
support an even wider variety of opinions, presented as a rule, with a few notable
exceptions, in the form of sweeping generalizations. It seems, at least according to the
polls, that Greeks adore this kind of fruitless argument for the sake of argument. They
even use a very descriptive term to refer to it as “conversation between deaf” to
underline the chaotic atmosphere created by the panel members raising their voices to a
stentorian level hoping that this will make their point of view more convincing. We
suspect that the reason why the public adores such a show is simply because it seems
that it is the best that the media can offer in terms of entertainment.
Joking apart, however, history has pointed out in more ways than one that the
problems in the relations between Greece and Turkey are matters far too intricate to be
treated as media shows. And the first thing one must do in order to appreciate the
complexity of the relations between the two sides is to take a look at their historical
background in the area. In fact, archaeology indicates that the roots of the Greek
civilization in the Aegean date back to the Neolithic age (7000 to 6000 b.C.) its
presence culminating during the prime of the Minoan and the subsequent Mycenaean
civilization (since 1600 b.C.). By 500 b.C. all the islands in the Aegean and along the
entire Asia Minor are inhabited by Greeks whose colonial expansion reaches as far as
Syria and Italy. The Byzantine Empire has made the Greek presence in the area even
stronger until its fall in May 1453, which started the Turkish occupation of Greece that
lasted about 400 years. In fact the Turks who appeared in the region during the 11th
century A.D. conquered the Greek mainland and the islands between 1456 and 1669.
Greece had to wait until 1821 to resume its independence with the revolution in March
of that year marking the revival of the Greek dominance in the area. All territorial
disputes remaining were terminated by the Treaty of Lausanne (July 24, 1923) while all
Greeks were driven away from Asia Minor. Finally, the Treaty of Paris (February 10,
1947) acknowledged Greek sovereignty on the Dodecanese isles thus raising the
number of Greek islands to a total of 3,100 of which 2,463 are found in the Aegean
inhabited by about 15% of the total Greek population.
The case of Cyprus is equally interesting: The Greeks settled on the island during
the 2nd millennium b.C. while the Persians conquered it in 540 b.C. and held it until
330 b.C. when Alexander the Great put an end to the Persian rule of the island. Cyprus
was ruled by Alexander’s Ptolemy descendant dynasty until 30 b.C. Since then, and
until 330 A.D. the island became a province of the Roman Empire and, later on, of the
Byzantine Empire. After the fall of Constantinople, the Ottoman Empire took over
Cyprus from the Venetians in 1571, only to cede it to Great Britain in 1878. In 1923, the
Treaty of Lausanne formally acknowledged the British rule over Cyprus while Turkey
renounced all claims on the island. In 1960 Cyprus was established as an independent
Republic.
In both the Aegean and the Cyprus case, the status, as described above, has been
concerning the Greek F.I.R, the territorial waters in the Aegean Sea and the continental
shelf of the islands. Concerning the case of Cyprus, moreover, the occupation of about
40% of the island by Turkey since July 1974, following a coup aiming at overthrowing
President Makarios, is rather unacceptable being, among other things, in direct conflict
with the status of Cyprus as a full E.U. member since April 2003. In fact, it seems that
the rapid developments with regard to the rapprochement of the Greek and the Turkish
Cypriots after that date have revealed an intrinsic dynamism which may prove to be
much more effective in terms of settling the Cyprus issue compared to all efforts
undertaken thus far mainly by the U.N.
In any case, however, and given their degree of complication, the Greek-Turkish
relations and the Cyprus issue are problems the solution of which requires much more
than just personal opinions and subjective evaluations. Those involved in such debates,
be it discussants, experts or, even, decision-makers, remind of players trying to play
football in the absence of an appropriate playing field. Their next option, of course, will
be to play in the streets meaning that it is going to be a matter of time before the ball
breaks the neighbor’s glass window or dirties the laundry drying in her backyard.
Exchanging opinions can certainly be very useful provided that those involved agree on
an objectively determined platform or framework that outlines the problem and provides
the constraints within which they are allowed to apply their proposed solutions. In the
absence of such a constraint such exchange of opinions and ideas is bound to remain
fruitless and may even cause more trouble instead of contributing to settling the matter.
The purpose of this book is to provide such a platform or framework that will
describe the Cyprus problem as a major issue affecting the relations between Greece
and Turkey and the arms race between the two countries. It is very important to point
out, however, that solving the Cyprus issue is not exactly a prerequisite for settling all
disputes between Greece and Turkey. The Greek-Turkish relations and the Cyprus
problem must be regarded as being two very important, however entirely distinct issues.
It goes without saying, however, that a mutually acceptable solution to the latter will
contribute to the improvement of the former to a large extent. Going back to the
construction of our platform, what we have decided to do is to resort to the help of
mathematics, always bearing in mind that they can be a useful servant, however a very
have contributed just to the point at which the key determinants in this conflict are
underlined thus offering a clear description of the relations between the two sides with
emphasis on the issue of Cyprus. The picture thus obtained is then used for suggesting
answers on a number of key questions, much more effectively, we believe, compared to
the results of any panel discussion. In any case, however, the responsibility of the final
decision concerning policies employed on such complicated issues certainly burdens the
politicians’ shoulders. As far as we are concerned, we will be happy to know that the
conclusions reached in this book are taken in consideration during the decision-making
process in the interest of peace. After all, it is only natural to expect that it will require
all the “intelligence” of our defence information systems in order to provide plausible
answers to such crucial political and strategic issues.
Irrespective of the importance of our contribution, however, one must always bear
in mind that “computational intelligence is no match for natural stupidity”. In other
words no matter how helpful the results of techniques of analysis may be their
usefulness or otherwise can only be certified to the extent that the policy makers use
them appropriately. We feel, however, that such a possibility is too good to be true. In
fact, one cannot help but be disappointed by the way, in which politics for the sake of
politics has disregarded national interests in Greece during the past. This is why when
we first decided to write this book, we did so as a reaction to a feeling of regret that had
overwhelmed us. Regret about the ignorance, superficiality and loss of values,
indifference to national interests, demagogy and personal interests triumphing over
national interests. The dominance of the former at the expense of the latter is crystal
clear if one takes a look at the proceedings of the Parliament discussions on how to
spend the leftovers of what used to be the 5-year procurement programme of the Greek
armed forces. The main complaint of the opposition during that session focused not on
the extent to which the purchase of a specific weapon would prove to be useful for the
defence of the country, but, instead, on why the procurement had been assigned to
dealer A rather than dealer B! We believe that this is more than enough to indicate
complete loss of sense of responsibility the consequences of which can be fatal to such
an extreme, that no technical analysis could ever rectify.
Given, however, that optimism has never hurt anyone we have decided to present
would consider ourselves the happiest people on earth if our conclusions would
contribute, even to a very small extent, to settling these intricate national issues.
The first paper of the book aims at forecasting the burden on the Greek economy
resulting from the arms race against Turkey. We employ alternatively the military debt
or the defence share of GDP in order to approximate the measurement of such a burden,
using artificial neural networks. The use of a wide variety of explanatory variables in
combination with the promising results derived suggest that the pressure on the Greek
economy resulting from this arms race is determined to a large extent by demographic
factors which strongly favor the Turkish side. Prediction on both debt and expenditure
exhibited highly satisfactory accuracy, while the estimation of input significance, has
indicated that variables describing the Turkish side are often dominant over the
corresponding Greek ones.
The next paper proposes a measure of relative military security applicable to
evaluating the impact of arms races on the security of alliance members. This measure
is tailored to fit the case of Greece and Cyprus, on one hand, and Turkey on the other, in
which demographic criteria play a dominant role. Once again, artificial neural networks
were employed, this time trained to forecast the future behavior of relative security. The
high forecasting performance permitted the application of alternative scenarios for
predicting the impact of the Greek-Turkish arms race on the relative security of the
Greek-Cypriot alliance.
Professor Michael Vrahatis and Dr. Konstantine Parsopoulos of the University of
Patras have contributed substantially in determining the optimal figure for defence
expenditure, which is the scope of the third paper. What we do, more specifically in this
case, is evaluate the optimal military expenditure for Greece and Cyprus compatible
with the constraints imposed by the resources of their economies in the context of the
Integrated Defence Doctrine. All experiments and scenarios examined using a special
algorithm designed by the two experts lead to the conclusion that the current defence
burden of the two allies seems to be driving their economies beyond capacity limits.
Reducing defence expenditure, however, seems prohibitive given the volatility of the
current political circumstances. This means that the one-sided disarmament policy
armament programmes pursued by Turkey, whose role in this arms race has been
proven as leading.
The same algorithm by Parsopoulos and Vrahatis has been used in the fourth paper
to point out that the security benefit that Greece derives thanks to its alliance with
Cyprus exceeds the corresponding Cypriot benefit by far. This conclusion is
supplemented by pointing out that Cyprus is able to contribute to the alliance security
more in terms of human resources. As regards Greece, its demographic weakness
justifies its recent defence policy revision that emphasizes on quality, capital equipment
and flexibility of forces in order to face the security requirements of the alliance and the
increasing demands of its arms race against Turkey.
A couple of words of caution may be necessary at this point: It is our firm belief
that the disagreement as to the extent to which an arms race is indeed going on between
Greece and Turkey (Brauer 2002 and 2003) is due, in most cases, to the shortcomings of
the traditional techniques of analysis employed, as pointed out by Taylor (1995) and
Kuo and Reitch (1995). We have, therefore, decided to resort to using advanced
mathematical techniques to prove not only the existence of such a race, but also the
causality direction that determines the side that takes the initiative in this race. More
specifically, Chapter 1 employs the technique of artificial neural networks to establish
the arms race between the two sides, as well as the various causal relationships between
the variables involved. What Chapter 3 does, in addition, is to take a step further by
calculating the optimal defence expenditure for the two allies, namely Greece and
Cyprus. It will become clear during the analysis that the term “optimal” refers to the
maximum defence burden allowed by the constraints imposed by the economy in each
case and does not consider any non-economic restrictions related to geopolitical or
strategic matters. While this optimal defence expenditure can be supported by the
economy without any major redistribution problems, any defence increases over and
above this optimal level may be feasible only by shifting resources from non – defence
to defence activities which can be taken to approximate the so called “peace dividend”.
We are certain that the reader realizes the importance of these issues, especially
when it comes to the arms race between Greece and Turkey, bearing in mind the
adverse economic conditions prevailing in the economy of the latter in view of its
programme, in particular, is expected to impose a disproportionally heavy burden on the
country’s economy (Pavlopoulos 2000). The interesting part in this story refers to the
substantial fraction of this sum representing the orders for the Turkish navy which
requests, among other purchases, an aircraft and a helicopter carrier. Given that,
according to the defence dogma of Turkey, the only possibility of a crisis requiring
emphasis on naval warfare will involve Greece it is only straightforward to see the
extent to which the allegation that we “presume the existence of an arms race between
Greece and Turkey” in our research (Brauer 2003, page 29) is by all scientific standards
simply wrong!
The second important point concerns the objections we have faced with regard to
referring to the Integrated Defence Doctrine as a form of alliance between Greece and
Cyprus. In fact the spectrum of objections has been so wide that it starts by
questionning our translation of the Greek “ΕνιαίονΑµυντικόν∆όγµα”, claiming that the
word “Joined” is more applicable than “Integrated”. The former, however, is much
weaker, since the degree to which two parts may be joined may vary from a loose to a
very tight extreme, while “integration” reflects exactly what “Ενιαίον” means: A
complete unification. As regards the extent to which such an alliance exists, the answer
is the following: There are very few sources in the literature describing the “de jure”
structure of this alliance (Hellenic Ministry of Defence 2000), a thing that may justify,
partly at least, the reluctance of this criticism to accept the Integrated Defence Doctrine.
In its “de facto” form, however, this alliance has been fully operational for about twenty
years or so despite the fact that its technical description reminds very little of what the
standard Theory of Alliances dictates.
After providing the necessary background describing the relations between Greece
and Turkey with special reference to the arms race between them, we make use of a
genetically evolved certainty neuron fuzzy cognitive map in order to forecast
developments concerning the Cyprus puzzle. What we do, in this case, in which Nicos
Mateou has contributed substantially, is forecast the extent to which a settlement of the
Cyprus issue may be possible given the decisions taken during the Copenhagen EU
summit. We then consider the possibilities of an improvement in the Greek-Turkish
relations which would, under certain conditions, lead to reducing the arms race between
the possible reactions of all sides involved in the Cyprus issue, namely Greece, Turkey,
Cyprus, the Turkish-Cypriot community and the international environment. The results
derived suggest that the Greek and the Cypriot side must not necessarily rely on the
decisions taken during the Copenhagen summit conference with regard to the EU full
accession of Cyprus. The forecasts point out, in addition, that the optimism of the Greek
government concerning the outlook of its relations with Turkey and the subsequent
reduction of the arms race against it is far from being justified.
Concluding this introductory chapter we must point out that we have benefited a
great deal by our discussions with Ambassador I. Bourloyannis and Professors M.
Evriviades and P. Ifestos to whom we are indebted. Needless to say that we are
responsible for any remaining errors as well as for the lack of any dose of diplomatic
flavour, especially in the technical chapters. In fact the entire book reveals our
preference for straightforward mathematical logic at the expense of diplomacy. Despite
the fact that the two are not necessarily mutually exclusive, the fact remains that this
book addresses primarily decision - makers to whom we leave the task of translating our
proposals into the language of diplomacy.
June 2003
REFERENCES
Brauer Jurgen (2002) Survey and Review of the Defence Economics Literature on
Greece and Turkey: What Have we Learned? Defence and Peace Economics, vol. 13,
2, 85–108.
Brauer Jurgen (2003) Greece and Turkey: A Comprehensive Critical View of the
Defence Economics Literature (as of December 2002), in C. Kollias and G. Gunluk –
Senesen (eds.) Greece and Turkey in the 21st Century: Conflict or Cooperation – The
Political Economy Perspective.
Hellenic Ministry of Defence (2000) The White Book, Athens.
Kuo C. and A. Reitsch (1995) Neural Networks vs. Conventional Methods of
Forecasting. The Journal of Business Forecasting, winter 1995-1996.
Pavlopoulos J. (2000) The Defence Procurement Programme of Turkey and its
Financial Versus Human Resources in the Greek-Turkish
Arms Race:
A Forecasting Investigation Using Artificial Neural Networks
*By
Andreas S. Andreou and George A. Zombanakis
1.1 INTRODUCTION
The Greek-Turkish conflict over a variety of strategic issues dates back several
centuries, having entangled the two countries to the vicious cycle of a very expensive
arms race (Kollias and Makrydakis, 1997). The aim of this paper is to forecast the
pressure due to this arms race between Greece and Turkey exercised on the economy of
the former. This forecast, established on the basis of the most appropriate explanatory
variables, will provide the opportunity to comment on the nature and relative
importance of the explanatory variables that determine the burden of this arms race on
the Greek economy, as this is approximated by either the military debt of the country or
the defence share of GDP. The method of analysis used is that of Artificial Neural
Networks, which has been considered preferable to the conventional estimation methods
for the purposes of the present analysis for reasons analyzed later on in this paper.
It is well known that the cost of an arms race is the disturbance that the excessive
military expenditure and the ensuing budgetary imbalances, bring about to the long-run
economic growth of the countries involved, as these strive to maintain the balance of
power between one another. The foreign sector of these countries, in particular, to the
*
First published in “Defence and Peace Economics”, vol. 11, 4, 2000, pp. 403-426.
extent that these are characterized as small, open economies, is considerably burdened
since military expenditure is highly import-demanding, crowding out funds intended for
alternative, non-military uses, and leading to borrowing abroad in order to finance the
military spending programmes. This foreign borrowing exerts an adverse impact on
both the domestic and the foreign sector: on the former due to the slow-down of
economic growth, as stated earlier, and on the latter because of the burden on the
balance of payments, which causes the need for more borrowing, thus creating a vicious
cycle of an ever-increasing foreign debt (Stavrinos and Zombanakis, 1998). The impact
of the arms race with Turkey upon the Greek economy has been particularly painful
since about 6% to 7% of the country's GDP is annually devoted to military expenditure.
The military debt, moreover, has doubled within the decade of the 1990s to reach about
4 billion dollars at the end of 1997, representing roughly 15% of the total external debt
of the country. Both these variables reflect the seriousness of the problem for the Greek
economy.
1.2 LITERATURE OVERVIEW
Research seems to favor the military expenditure rather than the stock of the
military debt as an indicator of the pressure exercised upon an economy due to an arms
race, with only a few notable exceptions, like McWilliams (1987). A large number of
papers have followed Benoit (1978), examining the effects of defence spending on
growth, like Deger (1986) and, later on Ward et al. (1991), Buck et al. (1993), Looney
(1994), as well as several authors in Hartley and Sandler (1990).
Concentrating on the impact of an arms race on the balance of payments and the
external debt of the countries that are involved in such a race, the only topic regarding
the external sector which appears in the literature concerns the concentration of defence
investment on the leading export sectors such as machinery and capital equipment,
something which leads to reduction of the availability of exportable and the slowing
down of economic growth. Empirical research by Fontanel (1994), considers the
independent variables that affect defence expenditure focusing on the impact of military
Smith (1997), concentrate on the role of military imports in an arms race between two
countries. Specific reference to the case of Greece or to the Greek - Turkish conflict is
found in Kollias (1994, 1995 and 1996) and Antonakis (1996 and 1997) who have
investigated the economic effects of defence expenditure upon the Greek economy.
The overwhelming majority of papers employ conventional estimation methods
with the notable exception of Refenes et al. (1995) who have employed the artificial
neural networks approach for determining the defence expenditure of Greece. The
advantages of using the neural network facility are multiple and have been repeatedly
analyzed in the literature (Kuo and Reitsch, 1995; Hill et. al., 1996). The ones that have
attracted our attention for the solution of the specific problem are the following. First,
the neural networks do not require an á-priori specification of the relationship between
the variables involved. This is a major advantage in our case, since there is no such
thing as an established theoretical background that describes the behavior of either the
military expenditure or the military debt when these are affected by the independent
variables chosen. There does not even seem to be an agreement as to which these
variables are. Second, in cases like the present one, in which certain variables are
correlated between one another and the pattern of behavior may be non-linear, the
neural networks are more applicable. Finally, studies agree on the superiority of neural
networks over conventional statistical methods concerning time-series forecasting.
The main objective of this paper, therefore, as earlier stated, is to forecast the
pressure that the arms race between Greece and Turkey exercises on the Greek economy
and to indicate, with the help of the artificial neural networks technique, the selection of
the most appropriate explanatory variables used in specifying such an “arms-race”
function. We shall show, more specifically, that the explanatory variables best
describing the behavior of the authorities and the reasoning behind such decisions are
related to a large extent, to the population characteristics of the two countries, being,
therefore, of a non-financial nature in its strict sense. Concentrating on such variables
seems to be very interesting in the case of the Greek-Turkish conflict, since the
comparison in terms of demographic developments is overwhelmingly against Greece.
The description of the technical background is presented in section 3. Section 4
includes the presentation of the explanatory variables used as input in the analysis as
obtained, comparing them to those drawn on the basis of an OLS estimate. Finally
section 6 sums up the conclusions drawn and evaluates the results.
1.3 TECHNICAL BACKGROUND
1.3.1 Neural Networks
This section is devoted to describing the emerging technology of artificial neural
networks. This technique belongs to a class of data driven approaches, as opposed to
model driven approaches. The process of constructing such a “machine” based on
available data is addressed by certain general-purpose algorithms. The problem is then
reduced to the computation of the weights of a feed-forward network to accomplish a
desired input-output mapping and can be viewed as a high dimensional, non-linear,
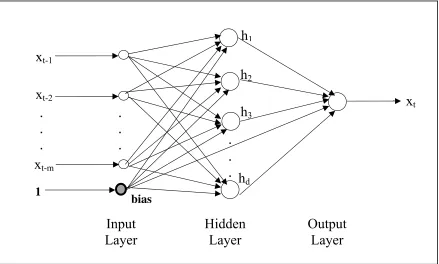
system identification problem. In a feed-forward network, the units can be partitioned
into layers, with links from each unit in the kth layer being directed to each unit in the
(k+1)th layer. Inputs from the environment enter the first layer and outputs from the
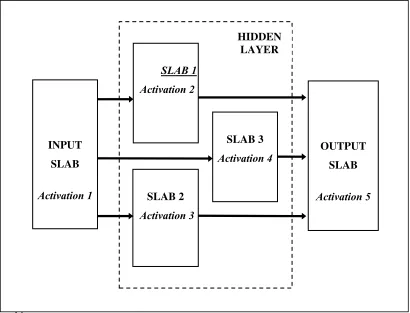
network are manifested at the last layer. An m-d-1 architecture is shown in Figure 1,
which refers to a network with m inputs, d units in the hidden layer and one unit in the
output layer.
We use such m-d-1 networks to learn and then predict the behavior of the
time-series. The hidden and output layers realize a non-linear transfer function of the form:
f y( ) (= +1 exp(−by))−1 (1)
y wi i i
n
=
=
∑
1
x (2)
where xi’s denote the input values of a node, while wi’s the real valued weights of edges
incident on a node and n the number of inputs to the node from the previous layer.
Equation (1) is known as the sigmoid function where b is the steepness. Also shown in
Figure 1 is a special node at the end of the input layer called “bias”. This node has a
fixed input value of 1 and feeds into all the neurons in the hidden and the output layers,
with adjustable weights as the other nodes. Its role is to represent the adjustable neuron
eliminates the need to treat threshold as a special neuron feature and leads to a more
[image:24.595.98.537.186.450.2]efficient algorithm implementation (Azoff, 1994).
Figure 1. Graphical representation of a Multi-Layer Perceptron feed-forward neural network architecture, with m input nodes, one bias input, d hidden nodes and one output node
Output
Layer
Hidden
Layer
x
tInput
Layer
.
.
.
.
.
.
.
.
.
x
t-1x
t-2x
t-mbias 1
h
dh
3h
2h
11.3.2 System Design
From the given time series x={x(t): 1 ≤ t≤ N} we obtain two sets: a training set
xtrain={x(t): 1 ≤ t ≤ T}, and a test set xtest={x(t): T < t ≤ N}, where N is the length of the
data series. The xtrain set is used to train the network at a certain level at which
convergence is achieved based on some error criterion. This is done by presenting to the
network L-times the sequence of inputs and desired outputs (L from now on will be
referred to as epochs) and having the learning algorithm to adjust the weights in order to
minimize the diversion of the desired value from the predicted one. The network is
asked to predict the next value in the time sequence, thus we have one output neuron.
The range of values for the output neuron is limited to [0,1] by the implementation
to this range just by taking the ratio di/dmax, in order to avoid negative values. Then,
the output values oi predicted by the network can be easily restored by taking the
inverse transformation oi* dmax. The training algorithm used is the well-known Error
Back Propagation with a momentum term (see e.g. Rumelhart and McLelland, 1986;
Azoff, 1994).
1.3.3 System Implementation, Training and Testing
The system described above has been implemented using a neural network
implementation tool, namely the Cortex-Pro Neural Networks Development System
(Unistat, 1994). We used several alternative configuration schemes, as regards the
number of hidden layers and the nodes within each layer, in order, first to achieve best
performance and second, to facilitate comparison between different network
architectures. The number of input neurons and the nature of data fed depend on what
we call “scenarios”, that is, different cases in which, using some or all of the available
input variables/factors, we attempt to forecast the performance of one specific variable
not included in the input set. These scenarios will be presented in section 4.
In each scenario, the desired values were normalized in the range [0,1] as stated
earlier, while the learning and momentum coefficients (Rumelhart and McLelland,
1986; Azoff, 1994) were kept constant at the positive values of 0.3 and 0.2 respectively.
Every input variable is associated with one neuron in the input layer. Our data
series consist of annual observations and the forecasting horizon was set to one step
ahead. Determining the number of hidden layers and neurons in each layer can often be
a very difficult task and possibly one of the major factors influencing the performance
of the network. Too few neurons in a hidden layer may produce bias due to the
constraint of the function space, which results to poor performance as the network
embodies a very small portion of information presented. Too many neurons on the other
hand may cause overfitting of data and increase considerably the amount of
computational time needed for the network to process data, something which will not
necessarily lead to convergence. We therefore have used a variety of numbers of
neurons within one hidden layer, while in some cases a two-hidden-layer scheme was
The number of iterations (epochs) presenting the whole pattern set during the
learning phase is also very important. We have let this number vary during our
simulations, since different network topologies, initial conditions and input sets, require
different convergence and generalization times. The number of epochs our networks
needed for convergence ranged between 3,000 and 10,000. One should be very cautious
though when using a large number of epochs, as the network may overfit the data thus
failing to generalize.
The problems of bias and data overfitting mentioned above can be overcome by
evaluating the performance of each network using a testing set of unseen patterns
(testing phase). This set does not participate during the learning process (see e.g. Azoff,
1994). If the network has actually learned the structure of the input series rather than
memorizing it then it can perform well when the testing set is presented. Otherwise, if
bias or overfitting is really the case, performance will be extremely poor on these “new”
data values. Architecture selection is generally based on success during the testing
phase, provided that the learning ability was satisfactory.
Performance was evaluated using three different types of errors, specifically the
Mean Absolute Error (MAE), the Least Mean Square Error (LMSE) and the Mean
Relative Error (MRE). MAE shows the divergence between actual and predicted
samples in absolute measures. LMSE is reported in order to have the error condition
met by the Back Propagation algorithm. Finally, MRE shows the accuracy of
predictions in percentage terms expressing it in a stricter way, since it focuses on the
sample being predicted, not depending on the scale in which the data values are
expressed or on the units of measurement used. Thus, we are able to estimate prediction
error as a fraction of the actual value, this making the MRE the more objective error
measure among the three used. LMSE, MAE and MRE are given by the following
equations:
LMSE= −
=
∑
1 22 1
n i oi di n
( ) (3)
MAE= −
=
∑
11
n i oi d n
MRE = 1 1
n
o d
d
i i i
n −
=
∑
i(5)
where oi is the actual output of the network, di is the desired value when pattern i is
presented and n is the total number of patterns.
An important aspect examined in the present analysis is the determination of the
significance ordering of the variables involved, that is the selection of the variables
which contribute more to the forecasting process. This task can be performed using the
notions of input sensitivity analysis, described extensively in Refenes et. al. (1995) and
Azoff (1994), based on which one can sum up the absolute values of the weights
fanning from each input variable into all nodes in the successive hidden layer, thus
estimating the overall connection strength of this variable. The input variables that have
the highest connection strength can then be considered as most significant, in the sense
of affecting the course of forecasting in a more pronounced way compared to others.
Presenting the analytical technical background behind these notions is beyond the scope
of this work, since the reader may refer to the sources stated above for further
information.
1.4
INPUT/OUTPUT VARIABLES AND SCENARIOS
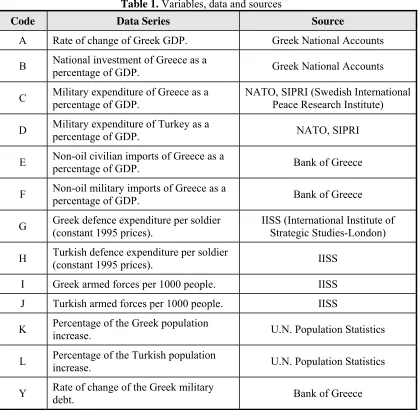
The data set used for the multiple simulations includes the 13 variables listed in
Table 1, the sources of which are the Bank of Greece, the International Institute of
Strategic Studies, the Swedish International Peace Research Center and the United
Nations Population Statistics. Variables A to F and variable Y consist of 36
observations covering the period 1961-1996, while variables G to L consist of 35
Table 1. Variables, data and sources *
Code Data Series Source
A Rate of change of Greek GDP. Greek National Accounts
B National investment of Greece as a
percentage of GDP. Greek National Accounts
C Military expenditure of Greece as a
percentage of GDP.
NATO, SIPRI (Swedish International Peace Research Institute)
D Military expenditure of Turkey as a
percentage of GDP. NATO, SIPRI
E Non-oil civilian imports of Greece as a
percentage of GDP. Bank of Greece
F Non-oil military imports of Greece as a
percentage of GDP. Bank of Greece
G Greek defence expenditure per soldier
(constant 1995 prices).
IISS (International Institute of Strategic Studies-London)
H Turkish defence expenditure per soldier
(constant 1995 prices). IISS
I Greek armed forces per 1000 people. IISS
J Turkish armed forces per 1000 people. IISS
K Percentage of the Greek population
increase. U.N. Population Statistics
L Percentage of the Turkish population
increase. U.N. Population Statistics
Y Rate of change of the Greek military
debt. Bank of Greece
*Data series are available upon request
Variable Y represents the rate of change of the military debt of Greece and shall be
used as the dependent variable alternatively to variable C, which stands for the Greek
defence share of GDP. The first set of explanatory variables representing the
developments in resources characterized as of purely financial nature includes the
following: Variable A is the rate of increase of the Greek real GDP, while B represents
the aggregate national non-defence investment expenditure, both private and public,
again as a percentage of GDP. Variables C and D stand for the GDP shares of defence
expenditure in Greece and Turkey respectively, while variables E and F denote GDP
The next set of independent variables has been selected to include those that place
emphasis on human resources, mostly representing demographic features. Thus G and H
stand for defence expenditure per soldier in Greece and Turkey respectively, while I and
J denote percentage of armed forces in the population of Greece and Turkey. Finally, K
and L indicate the population rate of increase in Greece and Turkey respectively.
Using these variables we formed three scenarios, which will be simulated and
evaluated:
(i) Financial Resources Scenario, which assumes that the Greek GDP share of
defence expenditure or, alternatively, the increase of the stock of military debt
is determined by variables representing financial resources of the two countries
involved in the arms race as these are described chiefly by national accounts
items. The choice of such variables is based on the selection of the variables
that seem to perform better in the literature cited earlier on in this paper.
(ii) Human Resources Scenario, which considers the Greek defence share of GDP
or, alternatively, the increase of the stock of military debt as determined by the
population characteristics of the two countries involved, rather than the
financial resources of the respective sides. Emphasizing on such factors does
not seem to be the case, at least as far as we know, in the relevant literature and
it is therefore interesting to see the extent to which the population factor may
affect the arms race of the countries involved.
(iii) Composite Scenario, created by the combination of those variables in the first
two scenarios that have been found to be the most significant using input
sensitivity analysis. Table 4 (top four rows – see subsection 5.2) presents a
comprehensive summary of the first two scenarios, as regards the specification
of input and output variables of a neural network, with each scenario including
two alternative cases using either the Greek defence share of GDP or the rate of
change of the stock of military debt as an output variable.
Our primary goals when formulating these scenarios have been, first to determine
the predictive ability of neural networks in the context of an arms-race scenario and
1.5
EMPIRICAL RESULTS
The training sets of the Financial Resources Scenario consist of 29 annual
observations, covering the period 1961-1989 and those of the Human Resources
Scenario of 28, representing the period 1961-1988. The testing sets, in all scenarios,
consist of 7 annual samples, referring to the period 1990-1996 for the former scenario,
while this period is shorter by one observation, that is, 1989-1995, for the latter. The
results obtained for each scenario are analyzed in the following section.
1.5.1 Comparison Between Two Scenarios: Financial vs. Human Resources
Tables 2 and 3 summarize the best results obtained in the context of both scenarios
providing for the evaluation of the training as well as the testing phase, in cases in
which the arms race pressure is approximated either by the change of the stock of
military debt or the defence share of GDP.
It is clear that using the latter as a dependent variable yields much better results in
terms of predictive ability of the networks in both scenarios, with all error figures for
the testing phase of all networks being slightly superior for the financial resources
scenario. The best performance yielded a 93% success against 84% for the human
resources scenario in MRE terms.
The corresponding network performance when the stock of military debt is used as
a dependent variable is rather inferior in terms of all error evaluation figures. In MRE
terms the testing phase exhibited 70% and 52% highest prediction success for the
financial and human resources scenarios respectively. It is interesting to point out, as a
general remark, that when the number of hidden layers and nodes within each layer is
increased, providing for a more complex topology, the time needed for the network to
converge, as this is expressed in terms of number of epochs, is reduced to
Table 2. Prediction results: Financial Resources scenario, Debt and Expenditure cases (standard errors in parentheses)
Training Phase Testing Phase Network* Epochs MAE LMSE MRE MAE LMSE MRE
Inputs:
Debt
A, B, C, D, E, F
Case
Output: Y
6-4-1 10,000 0.05842
(0.0114) 0.00347 (0.0015) 0.091 (0.0191) 0.20003 (0.0487) 0.02710 (0.0106) 0.295 (0.0811)
6-8-1 10,000 0.04259
(0.0102) 0.00212 (0.0014) 0.064 (0.0101) 0.30147 (0.0761) 0.05593 (0.0166) 0.301 (0.0822)
6-8-4-1 5,000 0.05337
(0.0109) 0.00311 (0.0015) 0.080 (0.0145) 0.2301 (0.0585) 0.0368 (0.0146) 0.318 (0.0854)
6-32-16-1 6,000 0.06979
(0.0071) 0.00533 (0.0004) 0.098 (0.0121) 0.18330 (0.0281) 0.02329 (0.0041) 0.288 (0.0400) Inputs: Expenditure
A, B, Y, D, E, F
Case
Output: C
6-4-1 5,000 0.04334
(0.0064) 0.00148 (0.0040) 0.059 (0.0110) 0.09570 (0.0215) 0.00596 (0.0022) 0.124 (0.0279)
6-8-1 3,000 0.03130
(0.0048) 0.00080 (0.0003) 0.031 (0.0061) 0.05413 (0.0052) 0.00248 (0.0009) 0.087 (0.0065)
6-8-4-1 3,000 0.0579
(0.0115) 0.00350 (0.0018) 0.085 (0.0200) 0.06061 (0.0196) 0.00311 (0.0020) 0.089 (0.0196) *
“m-d-n” stands for m input nodes, d nodes in the hidden layer and n output nodes.
“m-d-p-n” stands for m input nodes, d nodes in the first hidden layer, p nodes in the second hidden layer and n output nodes.
Figure 2 presents graphically the course of forecasting of stock of military debt in
(a) and the defence share of GDP in (b), for the financial scenario that yielded the best
predictive performance. As stated earlier, based on the error measures, the latter appears
to have higher predictive ability compared to the former. The two variables apparently
have different variances, thus we have calculated the correlation coefficient between
actual and predicted samples in order to eliminate the possibility the results are
numerical artifacts. Indeed this enhanced our results, as the correlation coefficient for
the training phase was 0.86 for the debt case and 0.98 for the expenditure one, while for
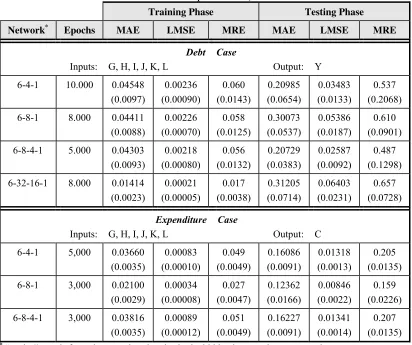
Table 3. Prediction results: Human Resources scenario, Debt and Expenditure cases (standard errors in parentheses)
Training Phase Testing Phase Network* Epochs MAE LMSE MRE MAE LMSE MRE
Inputs:
Debt
G, H, I, J, K, L
Case
Output: Y
6-4-1 10.000 0.04548
(0.0097) 0.00236 (0.00090) 0.060 (0.0143) 0.20985 (0.0654) 0.03483 (0.0133) 0.537 (0.2068)
6-8-1 8.000 0.04411
(0.0088) 0.00226 (0.00070) 0.058 (0.0125) 0.30073 (0.0537) 0.05386 (0.0187) 0.610 (0.0901)
6-8-4-1 5.000 0.04303 (0.0093) 0.00218 (0.00080) 0.056 (0.0132) 0.20729 (0.0383) 0.02587 (0.0092) 0.487 (0.1298)
6-32-16-1 8.000 0.01414 (0.0023) 0.00021 (0.00005) 0.017 (0.0038) 0.31205 (0.0714) 0.06403 (0.0231) 0.657 (0.0728) Inputs: Expenditure
G, H, I, J, K, L
Case
Output: C
6-4-1 5,000 0.03660
(0.0035) 0.00083 (0.00010) 0.049 (0.0049) 0.16086 (0.0091) 0.01318 (0.0013) 0.205 (0.0135)
6-8-1 3,000 0.02100
(0.0029) 0.00034 (0.00008) 0.027 (0.0047) 0.12362 (0.0166) 0.00846 (0.0022) 0.159 (0.0226)
6-8-4-1 3,000 0.03816 (0.0035) 0.00089 (0.00012) 0.051 (0.0049) 0.16227 (0.0091) 0.01341 (0.0014) 0.207 (0.0135) *
“m-d-n” stands for m input nodes, d nodes in the hidden layer and n output nodes.
“m-d-p-n” stands for m input nodes, d nodes in the first hidden layer, p nodes in the second hidden layer and n output nodes.
1.5.2 Estimation of Input Significance
The input significance ordering is a procedure most interesting for the purposes of
0 0.5 1 1.5
1961 1966 1971 1976 1981 1986 1991 1996 actual predicted in-sample out-of-sample
(a) Debt Case, 6-32-16-1 neural network topology
0 0.5 1 1.5
1961 1966 1971 1976 1981 1986 1991 1996 actual predicted in-sample out-of-sample
[image:33.595.137.487.102.332.2](b) Expenditure Case, 6-8-1 neural network topology
Figure 2. Neural networks prediction results on Financial Scenario: (a) Greek Military Debt and (b) Greek Defence Expenditure. Actual values are plotted versus forecasted outputs. In-sample corresponds to the learning period, while out-of-sample to the evaluation period.
First, it involves determining the most significant input variables in terms of
based on the forecasting performance of these variables on both the rate of change of
the stock of military debt and the Greek defence share of GDP, and leads to building the
composite scenario. Second, the selection of the most significant variables is expected
to lead to interesting conclusions concerning their nature and their role in determining
the pressure of the arms race on the Greek economy.
1.5.2.1 Financial Resources Results: Debt Case
The ranking showed that all networks, regardless the number of nodes or hidden
layers, exhibited the same significance order: wD>wC>wF, with the remaining variables
having very low strengths. It is interesting to see, therefore, that the Turkish GDP share
of military expenditure is the leading determinant of the Greek external military debt, its
weight being by far the largest, almost double that of each of the rest two, the weights of
which are almost equal. This finding supports the view in favor of the existence of an
arms race between the two rival countries and underlines the pressure that this arms race
exercises on the Greek economy. The second variable in terms of significance is the
Greek defence share of GDP, while the Greek import bill on military equipment comes
third in significance ordering.
Expenditure Case
The determination of the significant input variables according to their weights
summation provided the same ordering for all networks: wF>wY>wD. This result has
been, to a large extent, expected. The selection of the determinants is essentially the
same as in the previous case, with only the ordering being reversed. It is, therefore, the
expenditure on military imports that plays the dominant role in determining the Greek
GDP share of defence spending, a dominance being by far the most pronounced
compared to the rest two explanatory variables, (i.e. the change of the Greek military
external debt and the Turkish GDP share of defence spending, as indicated by the
comparison of the relevant weights). This rearrangement of the order of significance, in
this case, reinforces the conclusions already derived in the debt case. The pressure
exercised from the part of the Turkish side is always dominant expressed by the
presence of this country’s defence share of GDP as one of the leading determinants of
leading variable determining the Greek defence spending simply shows a reversal of
roles in terms of causality direction between the two variables with reference to the case
of military debt determination and supports earlier work on the topic examining the
vicious cycle between defence expenditure and military debt (Stavrinos and
Zombanakis, 1998).
1.5.2.2. Human Resources Results
Debt Case
Determining the military debt along the lines of the Human Resources scenario
indicates that the Greek defence expenditure per soldier, the rate of increase of the
Greek population and the proportion of armed forces in the population of Turkey are the
leading explanatory variables in that order (wG>wK>wJ). The weights of the first two
independent variables are almost equal, something that does not allow for a clear-cut
determination of the ordering of importance between them. Again, however, a variable
representing the resources of the “other side” is strongly present among the leading
determinants of the Greek external military debt, only to support, once more, the
existence of an arms race environment.
Expenditure Case
This case is unique in the sense that it is the only one in which variables describing
the Turkish side are not among the leading determinants of the pressure on the Greek
economy due to this arms race. The weight ranking resulted the order wG>wI>wK. Thus,
the Greek GDP share of military expenditure is determined chiefly by the Greek
defence spending per soldier, which this time, appears to be the leading determinant by
far, to be followed by the proportion of armed forces in the Greek population and the
rate of increase of the population in the country.
1.5.3 Composite Scenario
The preceding Input Significance Analysis leads us to making the main point of the
present paper in terms of what we refer to as “the Composite Scenario”. This involves
combining the three most significant inputs of each of the two scenarios earlier
examined, namely the Financial Resources and the Human Resources ones. These input
Table 4 (top four rows). The training and testing sets of this scenario have the same data
length as those in the Human Resources Scenario.
Table 4. Leading determinants for each scenario based on Input Sensitivity Analysis
Scenario Case Study Leading Determinants* Output
Financial Debt WD>WC>WF Y
Resources Expenditure W
F>WY>WD C
Human Debt WG>WK>WJ Y
Resources Expenditure W
G>WI>WK C
Composite Debt WK>WJ>WG Y
Resources Expenditure W
G>WI>WD C
*W
N denotes the sum of the absolute values of the weights of the Nth input variable node
connections.
1.5.3.1. Results
Debt Case
Various network topologies have been developed in the context of the Composite
Scenario trained using C, D, F, G, J and K as input variables and over a variety of
iterations numbers. Table 5 (top half) summarizes the best results obtained when
forecasting the Y variable and provides for an evaluation of both the training and testing
phase in the case in which the burden of the arms race for the Greek economy is
approximated by the military debt.
The interesting result in this scenario has to do with both the nature of the variables
selected as well as their explanatory power. We see that the network performance is
almost equally successful compared with the best results obtained in cases of debt
determination in the previous two scenarios. In fact, the errors derived in the testing
phase are very close to those in the corresponding case of the Financial Resources
Scenario and considerably lower compared to the errors of the debt determination case
success for the 6-8-4-1 topology that performed best, denoting that the new set of input
variables performs as successfully as it did in the case of the Financial Resources
[image:37.595.113.516.226.573.2]Scenario in forecasting the military external debt.
Table 5. Prediction results: Composite scenario, Debt and Expenditure cases (standard errors in parentheses)
Training Phase Testing Phase Network* Epochs MAE LMSE MRE MAE LMSE MRE
Inputs:
Debt
C, D, F, G, J, K
Case
Output: Y
6-4-1 10.000 0.04074
(0.0120) 0.00290 (0.0016) 0.058 (0.0154) 0.19735 (0.0594) 0.03006 (0.0136) 0.539 (0.2228)
6-8-1 10.000 0.02262
(0.0044) 0.00059 (0.0002) 0.033 (0.0065) 0.25300 (0.0615) 0.04335 (0.0183) 0.496 (0.0932)
6-8-4-1 5.000 0.02221 (0.0043) 0.00052 (0.0001) 0.029 (0.0066) 0.15384 (0.0368) 0.01589 (0.0060) 0.306 (0.0755)
6-32-16-1 6.000 0.02086 (0.0040) 0.00047 (0.0001) 0.031 (0.0067) 0.17177 (0.0479) 0.02163 (0.0099) 0.328 (0.0820) Inputs: Expenditure
Y, D, F, G, I, K
Case
Output: C
6-4-1 5,000 0.03014
(0.0039) 0.00066 (0.0001) 0.040 (0.0051) 0.14329 (0.0187) 0.01131 (0.0022) 0.182 (0.0258)
6-8-1 3,000 0.02350
(0.0033) 0.00043 (0.0001) 0.033 (0.0050) 0.09336 (0.0166) 0.00518 (0.0013) 0.119 (0.0222)
6-8-4-1 3,000 0.02605 (0.0029) 0.00048 (0.0001) 0.037 (0.0045) 0.09964 (0.0179) 0.00592 (0.0015) 0.127 (0.0239) *
“m-d-n” stands for m input nodes, d nodes in the hidden layer and n output nodes.
“m-d-p-n” stands for m input nodes, d nodes in the first hidden layer, p nodes in the second hidden layer and n output nodes.
Expenditure Case
The final simulation employs variables Y, D, F, G, I and K, found to be more
significant by input sensitivity analysis, to forecast variable C, the defence share of
GDPs in Greece. The results obtained here and summarized in Table 5 (bottom half),
All networks provided for a very satisfactory performance, the testing phase errors
being very close to those in the corresponding case of the Financial Resources scenario.
The best topology is the 6-8-1 architecture with a prediction success of approximately
88% (MRE terms).
1.5.3.2 Estimation of Input Significance
The Input Significance exercise has been performed on the basis of the results
obtained in the case of the Composite scenario along the lines of section 5.2. Its findings
are summarized in Table 4 (bottom two rows) and they seem to be very interesting since
they provide a full picture as to whether and the extent to which human resources may
account for the development of the military debt or the Greek share of GDP
expenditure, thus illustrating a number of very important points.
Debt Case
As regards the question of determining the military external debt of Greece, the rate
of the Greek population increase, a Human Resources indicator, seems to be almost
twice more powerful compared to the other explanatory variables, the explanatory
power measured by the relevant weight computed. Equally interesting is the fact that the
second in order of importance determinant is another Human Resources indicator, this
time, however, concerning the “opposite side”, the proportion of the armed forces in the
population of Turkey. Finally, the Greek military expenditure per soldier comes third in
terms of explanatory power in this case. It is worth noting, finally, that the top three
determinants in this case are the same as the top three ones in the corresponding Human
Resources case, but in a different order.
Expenditure Case
In the case in which the Greek GDP share of defence spending is taken to
approximate the arms-race pressure on the Greek economy, the Greek defence
expenditure per soldier is now the leading explanatory variable. The proportion of
armed forces in the Greek population comes second in explanatory power, while the
GDP share of military expenditure in Turkey is third in importance. It is interesting to
see, therefore, that the first two independent variables are derived from the Human
underlining once more the dominant influence of the Turkish side on the defence burden
of Greece.
1.5.4 Ordinary Least Squares Regression
Concluding this analysis, we thought that it would be interesting to investigate the
extent to which our neural network topologies are suitable for forecasting the arms-race
pressure on the Greek economy better than a conventional OLS exercise, using the same
explanatory variables.
We tried OLS regressions with the dependent variable being the rate of change of
the military external debt and, alternatively, the Greek defence share of GDP, for all
three scenarios used. All series have been found to be stationary in their first
differences, on the basis of the ADF test. Due to the small number of available
observations, the OLS has been performed using the entire sample period, (i.e.
1961-1996, while the forecasting period involves the last seven years, the forecasting period
of the corresponding neural networks exercise). The estimation results for all equations
are presented in Table 6, with t-values indicated in parentheses and the variable res
denoting the residuals of the corresponding long-run estimates. The results are
satisfactory, bearing the expected signs. The ambiguity of the sign concerning the rate
of the Greek population increase is expected. One may argue that a high rate of
population growth will lead to increasing manpower in most units and therefore, the
requirements for more equipment. An opposing view, however, appears to interpret
recent developments in the Greek armed forces in a different way: The demands of
modern warfare call for small, flexible units, very well trained and equipped with high
technology weapons. In face of the slowing down of the Greek population growth this
calls for a heavier arms race burden in order to finance this shift to the modernization of
Table 6. OLS regression results on Military Debt and Defence Expenditure (t-values in parentheses)
Financial Resources
Scenario Human Resources Scenario Composite Scenario
Varia-bles Debt
Expen-diture
Varia-bles Debt
Expen-diture
Varia-bles Debt
Expen-diture Const. -0.04
(-0.76)
0.00
(0.00) Const.
-0.02 (-0.29)
0.01
(0.16) Const.
-0.01 (-0.10)
0.01 (0.10)
A 0.44
(0.47)
4.39
(4.82) G
0.05 (2.90)
0.15
(5.07) D
0.07 (0.84)
0.22 (1.85)
B -3.09
(-1.21)
-4.99
(-1.90) H
0.13 (2.03)
0.10
(1.02) F
0.47 (3.05)
0.09 (0.38)
C 0.11
(1.53) ⎯ I
0.14 (2.46)
0.42
(3.36) Y ⎯
0.12 (0.72)
D 0.09
(1.20)
0.26
(2.94) J
0.10 (2.26)
0.18
(2.10) G
0.05 (2.78)
0.12 (4.51)
E 7.88
(2.80)
0.34
(0.13) K
-0.13 (-3.12)
0.19
(2.61) K
-0.09 (-2.47)
0.10 (1.77)
F 0.30
(1.91)
0.21
(1.30) L
0.07 (1.83)
0.15
(1.98) I ⎯
0.19 (2.58)
Y ⎯ 0.21
(1.69) ⎯ ⎯ ⎯ J
0.10
(2.07) ⎯
⎯ ⎯ ⎯ ⎯ ⎯ ⎯ C 0.03
(0.52) ⎯
res(-1) -1.39
(-7.22)
-1.27
(-10.22) res(-1)
-1.35 (-5.93)
-0.94
(-4.24) res(-1)
-1.27 (-7.12)
-1.23 (-6.31)
R2 0.78 0.90 R2 0.76 0.75 R2 0.81 0.81
D.W. 1.97 1.55 D.W. 2.14 2.04 D.W. 2.40 1.88
To the extent that one may comment on the hierarchy ordering of the leading
determinants taking the t-statistic as a measure, it seems that in the debt case, the OLS
ordering coincides with that of the neural networks in the qualification of two out of
three major determinants, namely the Greek defence expenditure per soldier and the
percentage of Greek population increase. In the expenditure case, the ordering indicated
networks, since they both agree on the qualification of the top three explanatory
variables in the same order of importance.
The results of the forecasts using the OLS regressions are shown in Table 7.
Forecasting performance does not exceed the accuracy of 65% for the debt case and
45% for the expenditures case (testing phases) based on MRE terms, suggesting that
almost all neural networks topologies performed better than the OLS.
Table 7. Ordinary least squares prediction errors
Overall Period Period of testing*
Scenario Case MAE LMSE MRE MAE LMSE MRE
Financial Debt 0.154 0.024 0.912 0.221 0.046 0.409
Resources Expenditure 0.223 0.031 0.862 0.219 0.037 0.629
Human Debt 0.165 0.032 0.923 0.175 0.035 0.363
Resources Expenditure 0.287 0.096 0.727 0.318 0.099 0.862
Composite Debt 0.152 0.023 0.749 0.192 0.031 0.806
Expenditure 0.228 0.066 0.521 0.241 0.067 0.543
*
This period corresponds to the one used as a testing phase for the neural networks.
1.6 CONCLUSIONS
The arms race that has been going on between Greece and Turkey for a long period
of time has become the cause of a considerable pressure on the economies of the two
countries. This paper has demonstrated that, apart from the financial aspect of the
problem, there is another dimension that of the human resources, which is at least
equally important to the financial resources aspect in determining the arms race load
imposed on the Greek economy. The demographic developments in the two countries,
to be more specific, have been proven to exercise significant explanatory power,
the arms race on the economy of Greece. This analysis has thus led to deriving certain
interesting conclusions:
i. The neural networks methodology employed has attained a very satisfactory
prediction level for the arms race pressure imposed on the Greek Economy, as
this is proxied by both the change of the military debt and the defence share of
GDP. This prediction performance is superior to that attained using
corresponding OLS estimations in all cases.
ii. In the context of the so-called “composite scenario”, in which both financial and
human resources variables have been included, the latter are dominant over the
former in determining and forecasting the burden of an arms race on the Greek
Economy, as this is approximated by either the military debt or the defence share
of GDP.
iii. In all scenarios and cases tried, variables representing or approximating the
Turkish side are among the dominant ones in determining the pressure due to
this arms race on the Greek economy. The input sensitivity analysis proves that
one of the top three variables determining this pressure represents the “opposite
side” in all cases, either in financial resources terms (defence share of GDP) or
in human resources terms (proportion of armed forces in the population). The
former is indeed one of the top determinants in terms of sensitivity in almost all
scenarios. This finding verifies and underlines the fact that the pressure
exercised on the Greek economy by this arms race will be very difficult to
mitigate since it is to a considerable extent exogenous, depending on the policy
followed by the “opposite side”.
iv. Combining the above two conclusions leads to suggesting that in the context of
the Greek-Turkish arms race, the human resources factor deserves more
attention than what it has been given in the literature thus far. Demographic
developments in the two countries, provide for a serious disadvantage for the
Greek side, since its population, unlike that of Turkey, is aging, increasing at
very low rates, which, on certain occasions, have even turned negative during
the recent past. These developments, combined with pronounced differences as
regards the standard of living between the two countries have made the need for