Separation of Respiratory Sound from Heart
sound for Asthma Analysis
T. Ayesha Rumana1, Smitha.M2, P.Sutha3
Department of Biomedical Engineering, PSNA College of Engineering and Technology, Dindigul
Abstract—Heart Sound (HS) interferes with lung sound in the diagnosis of respiratory illness. In the analysis of respiratory disorders, Separation of Respiratory Sound (RS) from heart sound plays a major role. The proposed scheme implements a virtual instrument for removing heart sounds from respiratory sounds. Sound samples are recorded using Electronic stethoscope comprises both HS and RS. RS is separated from the HS for Asthma analysis at the primary stage of the disorder. This scheme involves two main phases namely Respiratory Sound separation and analysis of the resultant RS. The separation of RS involves detection, cancellation, localization and grouping of HS segments, modelling and prediction of RS. The recorded sound is given as output to the HS detection block and the segments of HS are detected using Multi resolution Analysis (MRA). The detected segments are cancelled and localized by the cancellation and localization block. The HS segments are grouped and modelled using Linear Prediction method. The modelled output is RS, presence of asthma is analyzed using the parameters like Mean, Variance and Standard deviation.
Keywords— Virtual Instrument (VI), Heart Sound (HS), Respiratory Sound(RS), Power Spectral Density(PSD), Multiresolution Analysis(MRA).
I. INTRODUCTION
Every year 100 to 150 million people around the globe suffer from asthma and this number is increasing. Annually 1,80,000 people die due to asthma world-wide. In India 15-20 million people have been estimated to be affected by Asthma.
The proposed scheme helps in the diagnosis of Asthma in the primary stage.Utility of stethoscope plays an important role in the diagnosis of respiratory pulmonary conditions like bronchitis, sleep apnea, asthma in common day to day practice. Asthma is a persistent lung disease, a very common respiratory condition also known as reactive airway disease. Asthma is causes an inflammation and constriction of bronchial walls leading to a series of complications in breathing. Asthma can be diagnosed by the presence of the signs and symptoms. Confirmed diagnosis is performed using pulmonary function tests, chest x-rays and blood tests.
The authors presented some diagnostic methods available for asthma by assessing the breathing patterns for asthmatic patient and also focused the need for the computational analysis of breathing pattern, alternate solution to diagnose asthma at the primary stage [1].
In the past decades developments of electronic recording using computer –based method have made recent researches in the area of lung and tracheal sound signal analysis. Recent advancements in computer analysis and modern digital signal processing techniques have established more research methodologies in the investigation of respiratory sound. In [2], authors discussed the Computerized respiratory sound analysis, respiratory sounds have relatively low frequency and low intensity, noise and other interfering sounds (i.e heart sound) from the respiratory sounds is removed prior to any diagnostic analysis.
LabVIEW 8.6 and its advanced signal processing toolkit removes the heart sound from respiratory sound. In [3], authors suggested the usage of linear adaptive filters in separating respiratory sound from heart sound for computational analysis with load and speed.
The authors proposed 10 different methods in removing heart sound from respiratory sound and concluded that linear adaptive filter is the best method because reference sound signal is not needed [4].
The authors implemented a virtual instrument for cancellation of Heart Sound (HS) from the recorded Lung Sound (LS) using the Advanced Signal Processing Toolkit of Lab VIEW 8.2. Multiresolution analysis of the wavelet approximation coefficients of the original signal is performed to identify the heart sound segments. After identification, HS segments are removed from the wavelet coefficients and created gaps are estimated by performing TSA ARMA modelling and prediction [6].
II. PROPOSED SCHEME
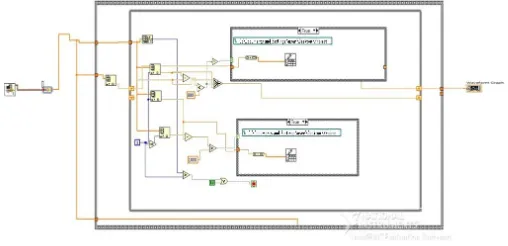
The VI is implemented using Advanced Signal Processing toolkit of Lab VIEW 2011 version. RS is separated from HS recordings using wavelet analysis tools and time series analysis tools. The Discrete Wavelet Transform (DWT) is applied to the recorded RS signal and locates the HS segments automatically and accurately using multiscale products.
[image:3.612.60.303.375.452.2]The segments are removed at each level of wavelet co-efficient. The created gaps are estimated by ARMA modelling of previous data segments.
Fig. 2.1 Block Diagram for Separation of Respiratory Sound from heart sound
III. SYSTEM DESIGN
The system design describes about the various processes involved in separating respiratory sound from heart sounds using LabVIEW software. In diagnosing a lung disorder like asthma, the parameters like mean, variance and standard deviation of heart sound separated respiratory disorder waveform is compared with normal patient data waveform. The diseased patient data is checked with normal patient data.
A. DATA ACQUISITION
The Electronic stethoscope is used to acquire the samples. The recorded sound samples comprise both respiratory sound and heart sound. The recorded sound samples are fed as input to VI. These inputs are in .wav format, read using Sound File Read Simple VI.
B.WAVELET ANALYSIS
Initially, detection, localization and cancellation of HS included segments are performed using wavelet analysis tools. Time series analysis tools are used in modelling and predicting the HS removed portions of original RS. Signal decomposition is done by wavelet functions. For each wavelet, wavelet transform calculates the inner products of the analyzed signal and localized in both time and frequency domains, so non-stationary signals are processed only using wavelet signal processing. Based on adaptive time frequency resolution of wavelet signal processing, multi resolution analysis on non-stationary signals is carried out. Simultaneous long term and short term variations can be studied using wavelet transform-based multiscale analysis.
C. HEART SOUND DETECTION
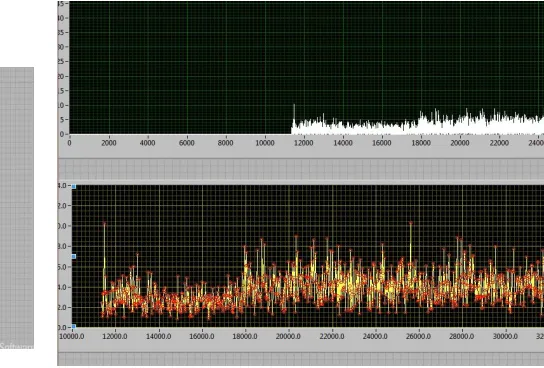
Multiscale product of wavelet approximation coefficients is computed in detecting the heart sounds. In wavelet decomposition three scales were used by considering fifth-order Symlet wavelet as the mother wavelet. The behaviour of signal and noise is totally different in the wavelet domain. Concept of Lipschitz regularity is used in analyzing the behaviour of signal and noise.
The singularities are identified by multiplication of the DWT coefficients between the decomposition levels. In HS segment detection in RS signal is done by obtaining the multiscale product of the wavelet coefficients. The specified level of the signal is decomposed by Multiresolution Analysis VI and signal reconstruction is performed for the selected frequency bands.
[image:3.612.317.568.511.650.2]D.HEART SOUND CANCELLATION
Due to propagation of respiratory sounds in the respiratory tissue, sound can be heard over the chest wall while breathing. A pathological change makes the tissue acts as a frequency filter with special characteristics. So, primary diagnostic assessments for respiratory diseases are accomplished by auscultation and acoustical analysis of respiratory sounds. The problem in interpretation of respiratory sounds is due to the heartbeat, producing an intrusive quasi periodic interference. This heart sound masks the low frequency components.
The frequency components of heart sounds (HS) are in the range of 20–100 Hz, respiratory sound are the major components. High Pass Filtering (HPF) filters the signal with the cut-off frequency between 70 and 100 Hz, so not suitable for lung sounds. Successful removal of noise in respiratory sounds helps in accurate diagnosis.
[image:4.612.322.512.203.300.2]The various methods employed for filtering respiratory sound from heart sounds namely linear adaptive filters and filters applying time-frequency based methods respectively.
Fig. 3.2 Heart Sound Cancellation.
E. LOCALIZATION OF HEART SOUND LOCATIONS
The next step proposed is the HS localization. This approach relies on the different behaviours presented by the
[image:4.612.58.276.397.562.2]HS and RS across the wavelet scales. It uses the multi scale product at level 3 as a measure to detect singularities that in our case represent HS-included segments within the RS record. It is important to mention that the segment size that includes HS and is removed in this HS cancellation method is variable instead of being fixed sized blocks.
Fig. 3.3Heart sound Localization
Wavelets functions are used in signal decomposition. The inner products of the analyzed signal and a family of wavelets are computed using wavelet transform. In time and frequency domain, wavelets are localized. So wavelet signal processing is best suited for non-stationary signals.
F. GROUPING OF HEART SOUND LOCATIONS
The heart sound segments are localized and then grouped in this block. Analyze the localized heart sound locations and the predicted series are replaced for original respiratory sounds.
Fig. 3.4 Grouping of Heart Sound Locations
[image:4.612.315.569.496.619.2]After localization of HS segments, HS segments are removed from the set of wavelet coefficients, the removed data is estimated. The length of the removed segment is based on the detected HS segment.
The past or future values of a time-limited signal is predicted using AR and MA models, common signal processing tools. The weighted linear combinations of the signal known values are the predicted samples.
There are four major components to a linear adaptive filter: input signal, the output of the adaptive filter, the desired filter response, and the estimation error.
During the iteration recursive algorithm within the adaptive filter updates filter parameters to minimize the estimation error. A linear adaptive filter performs two operations, Noise cancellation and linear prediction for lung sound recordings in reducing heart sounds.
[image:5.612.319.570.105.252.2]In the input signal noise is represented as the reference signal. The adaptive filter filters the noise in the input signal, finally signal of interest is determined by obtaining the difference between the filter output and primary input.
Fig. 3.5 Modelling and Prediction
I. A NALYSIS OF THE RESPIRATORY SOUND WAVEFORM FOR ASTHMA
The separated respiratory sound is analyzed for Asthma condition. The parameters analyzed in the waveforms are mean, variance and standard deviation of the output signal for diagnosis of Asthma at the primary stage. The analysis is done for 6 normal and 10 abnormal samples.
Fig. 3.6 .Analysis of waveform
IV.RESULTS AND DISCUSSION
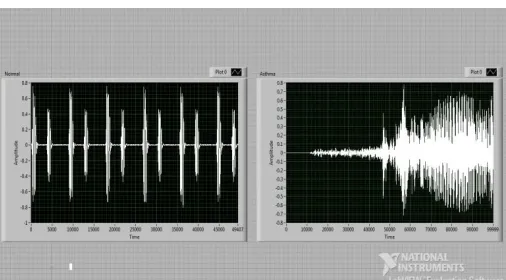
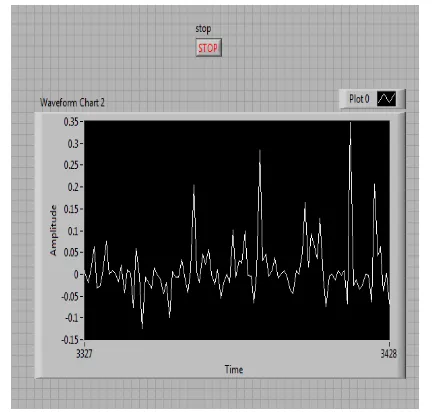
[image:5.612.58.293.411.503.2]The input waveform of normal and abnormal recorded sample is shown in figure 4.1 is used in detecting the heart sounds by obtaining the multiscale product of wavelet approximation coefficients as shown in figure 4.2. Figure 4.3 and figure 4.4 shows the cancellation of heart sounds from respiratory sounds is performed for normal and abnormal sample by using linear adaptive filter. Localization of heart sound in normal signal and abnormal signal by detecting the singularities in the HS segments, shown in figure 4.5 and figure 4.6. Grouping of heart sound locations in figure 4.7 and figure 4.8 is performed by linear prediction and modelling. Thus the separated respiratory signal output for normal and abnormal sample is obtained as shown in figure 4.9 and figure 4.10. Finally the separated respiratory signal is analysed using parameters like mean, variance and standard deviation.
A.HEART SOUND DETECTION
[image:5.612.321.574.507.647.2]Fig. 4.2 Heart sound detection output for normal and abnormal sample
[image:6.612.42.306.104.249.2]B. HEART SOUND CANCELLATION
Fig.4.3 Heart sound cancellation output for normal sample
Fig. 4.4 Heart sound cancellation output for abnormal sample
[image:6.612.292.564.280.464.2]C.HEART SOUND SEGMENT LOCALIZATIONS
[image:6.612.56.317.309.454.2]Fig.4.5 Localization output for normal signal
Fig.4.6 Localization output for abnormal signal
D. GROUPING OF HEART SOUND LOCATIONS
[image:6.612.56.301.481.629.2] [image:6.612.331.547.501.642.2]Fig. 4.8 Grouping of Heart sound segments for abnormal signal
E. MODELLING AND PREDICTION
[image:7.612.332.548.104.310.2]Fig. 4.9 Separated Respiration signal output for normal sample
Fig.4.10 Separated Respiration signal output for abnormal sample
F. ANALYSIS OF WAVEFORMS PATTERNS
Fig.4.11 Analysis of Normal and Abnormal signal
[image:7.612.351.530.354.584.2] [image:7.612.63.289.354.570.2]Table 4.1Mean, Variance and Standard Deviation of Normal Samples
NORMAL SOUND SAMPLE
MEAN VARIANCE STANDARD DEVIATION
Normal
Breath
sound1
0.254299 0.251552 0.213833
Normal
Breath sound
2
0.134069 0.2929787 0.264774
Normal
Breath sound
3
0.130495 0.2967075 0.226414
Normal
Breath sound
4
0.15838 0.2358171 0.379391
Normal
Breath sound
5
0.258951 0.2467112 0.218412
Normal
Breath sound
6
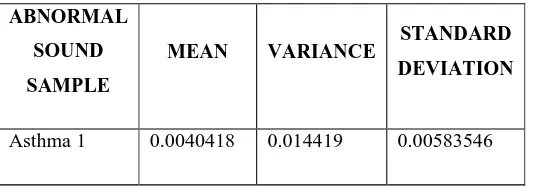
[image:8.612.51.567.104.677.2]0.103221 0.2311018 0.220963
Table 4.2 Mean, Variance and Standard Deviation of Abnormal Samples
ABNORMAL
SOUND
SAMPLE
MEAN VARIANCE STANDARD
DEVIATION
Asthma 1 0.0040418 0.014419 0.00583546
Asthma 2 0.00424063 0.025080 0.00583989
Asthma 3 0.00278573 0.0185709 0.00538790
Asthma 4 0.0014401 0.014782 0.0051574
Asthma 5 0.0025835 0.0149506 0.00521871
Asthma 6 0.0059987 0.01430774 0.00578796
Asthma 7 0.00435653 0.0286213 0.0066537
Asthma 8 0.00318459 0.0216969 0.00642661
Asthma 9 0.00248426 0.0195195 0.00710523
Asthma 10 0.0049837 0.034201 0.00600468
0 0.1 0.2 0.3
No. of Sa mples
Normal Mean Abnormal Mean
Fig. 4.12 Comparison of Normal and Abnormal Mean 0 0.1 0.2 0.3 0.4
No. of sa mples
[image:8.612.37.305.586.680.2]Normal Variance Abnormal Variance
0 0.1 0.2 0.3 0.4
No. of sa mples
Normal SD
[image:9.612.57.293.106.245.2]Abnormal SD
Fig. 4.14 Comparison of Normal and Abnormal SD
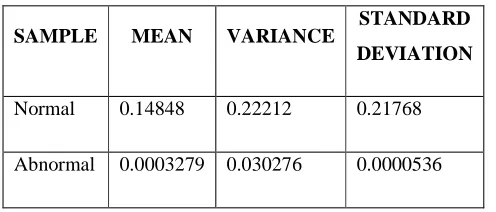
With the help of the above table and graphs the results are obtained. The average Mean, Variance and Standard Deviation of normal and abnormal sound samples are tabulated below:
Table 4.3 Average Mean, Variance and Standard Deviation for Normal and Abnormal Samples.
SAMPLE MEAN VARIANCE STANDARD
DEVIATION
Normal 0.14848 0.22212 0.21768
Abnormal 0.0003279 0.030276 0.0000536
These results were obtained for a set of 10 abnormal and 7 normal samples. Respiratory sound is separated analyzed for various parameters in identifying the diseased condition. From the above table we concluded that, the Average Mean, Variance and Standard Deviation values of abnormal signal is less, when compared to the normal signal value.
V. CONCLUSION
There are two main sections discussed, analyzing the parameters for diagnosis of Asthma by separating the respiratory Sound from heart sound. In account of separating the respiratory sound from heart sound phase, the heart sounds are detected and cancelled in the normal and abnormal sample. The detected heart sound segments are localized, modelled and predicted for signal separation.
From the resultant waveform, the separated respiratory sound is further analyzed for the presence of Asthma by calculating the mean, variance and standard deviation. These values are calculated for both normal and abnormal sound samples and are compared. From our observation over 6 normal and 10 abnormal signals, the Average Mean, Variance and Standard Deviation of abnormal signal is less when compared with Normal signals. And the future scope is to develop a Neural Network and is trained for easy computational analysis of various respiratory diseases such as Asthma for a real time clinical diagnosis.
ACKNOWLEDGMENT
We would like to express our gratitude to Ms.Rely.R.V., Rajaprika.R, Bharani.R., for all their hard work in completion of this work. We also extend our gratitude towards our head of the department for his valuable guidance in all hard times. Finally we thank our institution for providing a platform for new innovations.
REFERENCES
[1] J.Gnitecki, Z. Moussavi,(2007) “Separating heart sounds from lung sounds,”IEEE in Engineering in Medicine and Biology Magazine, pp
20-29.
[2] Z.Moussavi (2007), “Respiratory sound analysis,” IEEE in
Engineering in medicine and Biology Magazine, pp15.
[3] R. M. Potdar, Nishi ShahnajHaider,(2012) “Removal of Heart Sound from Lung Sound using LabVIEW 8.6”International Journal of
Engineering Research and Applications (IJERA) ISSN: 2248-9622 Vol. 2, Issue 3, pp.1313-1319 1313.
[4] K.Sathesh, Dr.N.J.R. Muniraj, (2010) “Survey on Separation of Heart
Sounds From Lung Sounds by Adaptive Filtering”.
[5] Tiago H. Falk and Wai-Yip Chan“Modulation Filtering for Heart and
Lung Sound Separation from Breath Sound Recordings”, University of
Canada.
[6] T E Ayoob Khan, Dr. P Vijayakumar,(2010) “Separating Heart Sound
from Lung Sound using LabVIEW”International Journal of Computer
and Electrical Engineering, Vol. 2, No. 3.
[7] H.Pasterkamp, S.S.Kraman, and G.R.Wodicka,(1997),“Respiratory
[image:9.612.46.294.367.473.2]
