Comparison of Whole-Genome
Sequencing Methods for Analysis of
Three Methicillin-Resistant
Staphylococcus aureus
Outbreaks
Scott A. Cunningham,
aNicholas Chia,
bPatricio R. Jeraldo,
bDaniel J. Quest,
cJulie A. Johnson,
dDave J. Boxrud,
eAngela J. Taylor,
eJun Chen,
fGregory D. Jenkins,
fTravis M. Drucker,
dHeidi Nelson,
bRobin Patel
a,gDivision of Clinical Microbiology, Department of Laboratory Medicine and Pathology, Mayo Clinic, Rochester, Minnesota, USAa; Department of Surgery, Mayo Clinic, Rochester, Minnesota, USAb; Advanced Analytics and Information Support, Information Technology, Mayo Clinic, Rochester, Minnesota, USAc; Bioinformatics Systems, Information Technology, Mayo Clinic, Rochester, Minnesota, USAd; Minnesota Department of Health, Saint Paul, Minnesota, USAe; Department of Health Sciences Research, Mayo Clinic, Rochester, Minnesota, USAf; Division of Infectious Diseases, Department of Medicine, Mayo Clinic, Rochester, Minnesota, USAg
ABSTRACT
Whole-genome sequencing (WGS) can provide excellent resolution in
global and local epidemiological investigations of
Staphylococcus aureus
outbreaks. A
variety of sequencing approaches and analytical tools have been used; it is not clear
which is ideal. We compared two WGS strategies and two analytical approaches to
the standard method of SmaI restriction digestion pulsed-field gel electrophoresis
(PFGE) for typing
S. aureus
. Forty-two
S. aureus
isolates from three outbreaks and 12
reference isolates were studied. Near-complete genomes, assembled
de novo
with
paired-end and long-mate-pair (8 kb) libraries were first assembled and analyzed
uti-lizing an in-house assembly and analytical informatics pipeline. In addition,
paired-end data were assembled and analyzed using a commercial software package.
Sin-gle nucleotide variant (SNP) analysis was performed using the in-house pipeline.
Two assembly strategies were used to generate core genome multilocus sequence
typing (cgMLST) data. First, the near-complete genome data generated with the
in-house pipeline were imported into the commercial software and used to perform
cgMLST analysis. Second, the commercial software was used to assemble paired-end
data, and resolved assemblies were used to perform cgMLST. Similar isolate
cluster-ing was observed uscluster-ing SNP callcluster-ing and cgMLST, regardless of data assembly
strat-egy. All methods provided more discrimination between outbreaks than did PFGE.
Overall, all of the evaluated WGS strategies yielded statistically similar results for
S.
aureus
typing.
KEYWORDS
MRSA, PFGE,
Staphylococcus aureus
, molecular typing, whole-genome
sequencing
M
ethicillin-resistant
Staphylococcus aureus
(MRSA) infections are associated with
high morbidity and mortality. MRSA transmission poses a challenge to hospital
infection prevention and control practitioners and public health professionals. The
Centers for Disease Control and Prevention’s
Active Bacterial Surveillance Report
esti-mated that there were 72,444 cases of invasive MRSA infection in 2014, the majority of
which were health care associated (HCA) (1). Proactive screening strategies (molecular
and culture based) are emphasized in many institutions and are mandatory in some
states. Despite these measures, HCA-MRSA outbreaks continue to occur. Thorough
investigation of outbreaks is essential for confirming that an outbreak is occurring,
understanding transmission patterns and reservoirs, and intervening to interrupt
out-Received9 January 2017Returned for modification4 February 2017 Accepted5 April 2017
Accepted manuscript posted online12 April 2017
CitationCunningham SA, Chia N, Jeraldo PR, Quest DJ, Johnson JA, Boxrud DJ, Taylor AJ, Chen J, Jenkins GD, Drucker TM, Nelson H, Patel R. 2017. Comparison of whole-genome sequencing methods for analysis of three methicillin-resistantStaphylococcus aureus outbreaks. J Clin Microbiol 55:1946 –1953.
https://doi.org/10.1128/JCM.00029-17.
EditorDaniel J. Diekema, University of Iowa College of Medicine
Copyright© 2017 American Society for Microbiology.All Rights Reserved. Address correspondence to Robin Patel, [email protected].
crossm
on May 16, 2020 by guest
http://jcm.asm.org/
breaks. For example, identification of colonized health care workers and other
reser-voirs can inform strategies such as furlough/decolonization and heightened
environ-mental services, respectively. Such interventions can terminate outbreaks and in doing
so mitigate costs associated with HCA-MRSA.
The literature surrounding MRSA typing and outbreak investigation is expansive.
Within such studies, two strategies of investigation are exercised: global (large
geo-graphical areas and extended time frames) and local (small areas and short time
frames). Multilocus sequence typing (MLST) and staphylococcal cassette chromosome
mec
element (SCC
mec
) typing have been widely used to describe global complex
groupings of MRSA (2). However, these methods do not possess the discriminatory
power needed to study outbreaks at the local level. For local investigations,
laborato-rians, infection prevention and control practitioners, and public health professionals
have traditionally relied on pulsed-field gel electrophoresis (PFGE). PFGE was rigorously
evaluated and standardized in several well-known studies and has cross-utility in global
classifications (e.g., USA PFGE clonal groups) (3). More recently, higher-resolution
molecular-based typing examining a repetitive region in
spa
was shown to be equally
discriminatory to PFGE and was proposed as an alternative method for typing and
studying local outbreaks of MRSA (4).
With the advent of benchtop next-generation (or “second-generation”) sequencing
platforms and advances in microbial bioinformatics, performance of whole-genome
sequencing (WGS)-based typing is attracting increased interest in clinical microbiology
arenas. The data rendered from these experiments allow for comparison to global
typing schemes, higher-resolution typing than previously possible, and the prospect of
further data mining activities, such as resistance and virulence profiling (5–9).
From a clinical microbiology perspective, there is not a standard method for typing
of
S. aureus
using WGS, as various sequencing methods and analytic strategies are used.
Several benchtop sequencers suitable for use in the clinical microbiology laboratory are
now available, of which the MiSeq system (Illumina, Inc., San Diego, CA) is the most
widely used at the current time. Sequences may be generated with paired-end and/or
mate-pair approaches and either aligned against a reference strain or assembled
de
novo
with subsequent analytic strategies, including single nucleotide polymorphism
(SNP) analysis and core genome multilocus sequence typing (cgMLST), among others.
However, exactly which overall strategy is ideal for the clinical microbiology laboratory
remains to be determined, with turnaround time, cost, technical difficulty, and accuracy
being the prime considerations.
To address these questions, we studied, in a blinded fashion, a collection of isolates
from three MRSA outbreaks. In addition to being typed via WGS in this study, the
isolates had been previously typed using PFGE. One strategy studied used combined
reads from paired-end and long-mate-pair (8 kb) libraries that were assembled and
analyzed utilizing an in-house assembly and analytical informatics pipeline. The second
used the analytical pipeline assemblies but analyzed them using a commercial software
package, SeqSphere
⫹
(Ridom, Münster, Germany), or assembled and analyzed
paired-end data with the commercial software package.
RESULTS
Pulsed-field gel electrophoresis.
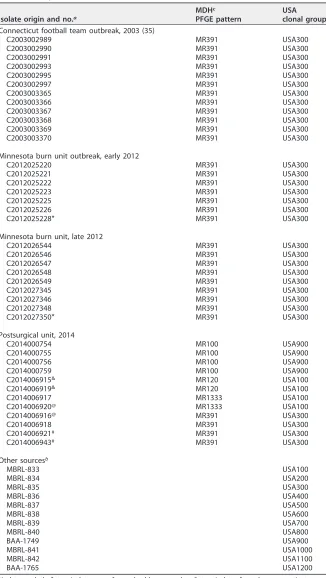
PFGE results are shown in Table 1. The 2003
Connecticut football team outbreak as well as the 2012 outbreaks from a burn unit all
were PFGE pattern MN391, clonal group USA300. The same PFGE pattern was observed
in some isolates in a 2014 postsurgical unit outbreak, although the postsurgical unit
outbreak involved several PFGE patterns and clonal groups.
In-house MAVIS (MLST, average nucleotide identity, variant, isolate similarity)
pipeline.
The Minnesota burn unit outbreak isolates demonstrated “indistinguishable”
results among 13 of 16 isolates by SNP analysis (see Table S1 in the supplemental
material). Two isolates (C2012027346 and C2012025223) were considered closely
re-lated to the larger group, while a single isolate (C2012026546) was considered possibly
closely related to the larger group based on our SNP cutoff values. Within the
on May 16, 2020 by guest
http://jcm.asm.org/
TABLE 1Study isolates
Isolate origin and no.a
MDHc PFGE pattern
USA clonal group Connecticut football team outbreak, 2003 (35)
C2003002989 MR391 USA300
C2003002990 MR391 USA300
C2003002991 MR391 USA300
C2003002993 MR391 USA300
C2003002995 MR391 USA300
C2003002997 MR391 USA300
C2003003365 MR391 USA300
C2003003366 MR391 USA300
C2003003367 MR391 USA300
C2003003368 MR391 USA300
C2003003369 MR391 USA300
C2003003370 MR391 USA300
Minnesota burn unit outbreak, early 2012
C2012025220 MR391 USA300
C2012025221 MR391 USA300
C2012025222 MR391 USA300
C2012025223 MR391 USA300
C2012025225 MR391 USA300
C2012025226 MR391 USA300
C2012025228* MR391 USA300
Minnesota burn unit, late 2012
C2012026544 MR391 USA300
C2012026546 MR391 USA300
C2012026547 MR391 USA300
C2012026548 MR391 USA300
C2012026549 MR391 USA300
C2012027345 MR391 USA300
C2012027346 MR391 USA300
C2012027348 MR391 USA300
C2012027350* MR391 USA300
Postsurgical unit, 2014
C2014000754 MR100 USA900
C2014000755 MR100 USA900
C2014000756 MR100 USA900
C2014000759 MR100 USA900
C2014006915& MR120 USA100
C2014006919& MR120 USA100
C2014006917 MR1333 USA100
C2014006920@ MR1333 USA100
C2014006916@ MR391 USA300
C2014006918 MR391 USA300
C2014006921# MR391 USA300
C2014006943# MR391 USA300
Other sourcesb
MBRL-833 USA100
MBRL-834 USA200
MBRL-835 USA300
MBRL-836 USA400
MBRL-837 USA500
MBRL-838 USA600
MBRL-839 USA700
MBRL-840 USA800
BAA-1749 USA900
MBRL-841 USA1000
MBRL-842 USA1100
BAA-1765 USA1200
aIsolate symbols:*, two isolates were from a health care worker; &, two isolates from the same patient
(blood and tissue); @, two isolates from the same patient (nasal swab and chest fluid); #, two isolates from the same patient (nasal swab and chest wound).
bOther sources included isolates obtained courtesy of Henry F. Chambers, Mayo Bacteriology Research
Laboratory (isolate designations that start with the letters MBRL), and isolates from the American Type Culture Collection (isolate designations that start with the letters BAA).
cMDH, Minnesota Department of Health.
on May 16, 2020 by guest
http://jcm.asm.org/
postsurgical unit outbreak collection, 2 isolates met the criteria for indistinguishable, 8
were closely related, and 4 were possibly closely related (Table S2). All isolates among
the Connecticut football team collection were indistinguishable (Table S3). In all three
outbreak collections, we noted a relationship to PFGE USA clonal groups.
SeqSphere
ⴙ
cgMLST.
Overall, results of cgMLST analysis using combined
long-mate-pair and paired-end assemblies or the paired-end assembly alone were similar.
Allelic distances were identical between the two approaches for all three outbreak
isolate sets (Fig. S1 to S6).
The Connecticut football team isolates demonstrated a single, highly clonal cluster
that was most closely related (58 allelic differences in total) to PFGE USA300 (Fig. S1 and
S4). The 12 involved isolates differed from the most closely related isolate by a
maximum of 8 allelic differences.
Fifteen of the 16 isolates from the 2012 burn unit outbreak formed a single cluster
of isolates with a maximum of 8 allelic differences from the most closely related isolate.
These isolates were most closely related (74 allelic differences total) to PFGE USA300
(Fig. S2 and S5). There was a single isolate (C2012026546) recovered during this event
which appeared nonclonal and unrelated to the cluster of 15 isolates but was also
closely related (84 allelic differences in total) to USA300.
The 12 postsurgical unit isolates were more diverse. There were four clusters of
related isolates, and 2 isolates were unrelated. Two clonal clusters, comprised of 2
isolates each, were most closely related (137 and 95 allelic differences, respectively) to
PFGE USA100; a third cluster of 4 isolates was most closely related (228 allelic
differ-ences) to PFGE USA800; the third clonal cluster was highly related (7 allelic differdiffer-ences)
to PFGE USA300. Two unrelated isolates independently grouped closest to PFGE
USA300 (Fig. S3 and S6).
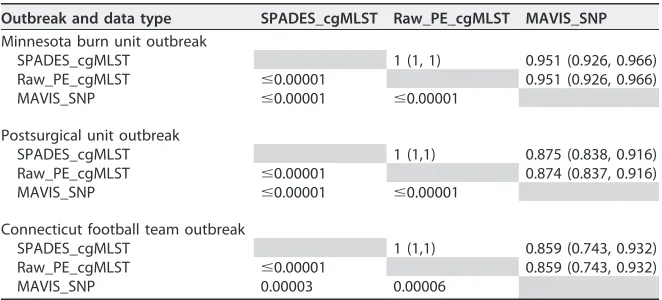
Statistical comparison of SNP and cgMLST data.
Mantel correlation and
associ-ated
P
values for comparisons of SNP and cgMLST data are shown in Table 2. These
results suggest that findings were similar for all three methods studied.
DISCUSSION
As previous studies have demonstrated, the results of our study provide strong
evidence and support for the utility of WGS-based typing for
S. aureus
. The results
[image:4.585.41.372.81.231.2]generated not only correlated with those of PFGE, but also were more discriminating.
We examined multiple methodological approaches by comparing sequencing
li-brary preparation methods, assembly tools, and comparison methods. We developed
our own typing pipeline with SNP capabilities and statistically defined SNP cutoffs for
TABLE 2Statistical comparison matrices for the three outbreaksa
Outbreak and data type SPADES_cgMLST Raw_PE_cgMLST MAVIS_SNP
Minnesota burn unit outbreak
SPADES_cgMLST 1 (1, 1) 0.951 (0.926, 0.966) Raw_PE_cgMLST ⱕ0.00001 0.951 (0.926, 0.966) MAVIS_SNP ⱕ0.00001 ⱕ0.00001
Postsurgical unit outbreak
SPADES_cgMLST 1 (1,1) 0.875 (0.838, 0.916) Raw_PE_cgMLST ⱕ0.00001 0.874 (0.837, 0.916) MAVIS_SNP ⱕ0.00001 ⱕ0.00001
Connecticut football team outbreak
SPADES_cgMLST 1 (1,1) 0.859 (0.743, 0.932) Raw_PE_cgMLST ⱕ0.00001 0.859 (0.743, 0.932) MAVIS_SNP 0.00003 0.00006
aFor each outbreak site, the values above the diagonal line formed by the gray-shaded cells are from the
Mantel correlation (with the 95% confidence interval). Values below are the shaded diagonal line areP values for a test of correlation between the measures. SPADES_cgMLST data are results from analysis using SeqSphere⫹cgMLST with paired-end and long-mate-pair assembly data from the MAVIS pipeline. Raw_PE_cgMLST data are results from analysis using cgMLST with paired-end reads assembled with SeqSphere⫹. MAVIS_SNP data are results from MAVIS single nucleotide variant analysis.
on May 16, 2020 by guest
http://jcm.asm.org/
assigning relatedness, and we compared results to those generated using commercial
software with capabilities of assembly and typing, again benchmarked against PFGE
typing. All WGS methods analyzed yielded statistically equivalent results, suggesting
that factors other than methodology, such as cost and turnaround time, may drive the
decision as to which method to use. That paired-end reads assembled and analyzed
with SeqSphere
⫹
yielded cgMLST results that were able to differentiate the study
isolates as well as SNP analysis did, which, as performed herein, used combined reads
from paired-end and long-mate-pair (8 kb) libraries and used a custom analytic
ap-proach, suggests that SeqSphere
⫹
-based cgMLST is the most practical of the
ap-proaches studied for use with
S. aureus
. While we did not specifically define thresholds
for defining relatedness using cgMSLT, results of this study suggest that
S. aureus
isolates with 0 to 8 allelic differences should be considered related, those with 9 to 29
allelic differences possibly related, and those with 30 or more allelic differences
unrelated. Further studies are needed to confirm these thresholds, alongside the SNP
thresholds we derived.
Several groups have demonstrated the utility of WGS-based typing in local outbreak
prospective and retrospective studies and compared results to PFGE, MLST,
spa
typing,
or other methods (10–14). There have been multiple analytic strategies used for
processing WGS data and determining relationships between isolates. Some WGS
analytic methods have focused on SNP analysis, occasionally with simultaneous
“out-break tracking” via evolutionary modeling, and they also extensively used
command-line-level software tools for execution. Other methods have focused on expanded MLST
approaches (MLST
⫹
or cgMLST), for which developers tout portability, universal
no-menclature, and more user-friendly, graphic-interfaced software juxtaposed to the
command-line-level protocols often found in SNP-oriented literature (6, 15, 16). Overall,
we favor a cgMLST approach, which mitigates the need for additional bioinformatics
resources and favors interlaboratory reproducibility and data portability. However, it
must be acknowledged that SNP analysis has strengths, especially in cases where
isolates are highly related or where evolutionary modeling is desired. In our opinion,
however, such higher-resolution SNP data would only offer academic enhancements
and would likely engender additional costs in a clinical setting.
In conclusion, all processing and analytic methods tested yielded high-quality,
high-resolution WGS results.
MATERIALS AND METHODS
Bacterial isolates.Fifty-four isolates were sequenced, including 42 from three separate outbreaks (Table 1) and 12 USA PFGE clonal group control strains (Table 1). Outbreak-related isolates were from the Minnesota Department of Health’s Molecular Epidemiology Laboratory.
Pulsed-field gel electrophoresis.PFGE was performed by creating a cell suspension in Tris-EDTA buffer to a turbidity of 0.58 to 0.63 using a turbidometer (Dade Behring, Deerfield, IL). A 300-l volume of the suspension was incubated at 37°C for 10 min; 4l of lysostaphin (1 mg/ml) and 300l of agarose were added to prepare a plug. Cell lysis, restriction endonuclease digestion using SmaI, electrophoresis, and determination of clonal groups were performed as previously described (3).
Culture and nucleic acid extraction.Isolates were subcultured from long-term freezer storage (⫺80°C) and passaged twice on tryptic soy agar with 5% sheep blood (Becton, Dickinson, BBL, Franklin Lakes, NJ). Cultures were incubated for 18 to 24 h at 35°C to 37°C in an ambient atmosphere. Using a sterile cotton application swab, culture material was transferred to a 5-ml centrifuge tube containing 500 l of 1⫻Tris-EDTA (TE) buffer, pH 8.0 (Thermo Fisher Scientific, Waltham, MA), to an approximate turbidity of 4 McFarland standard. A 100-l volume of freshly prepared lysostaphin in water (0.5 mg/ml; Sigma-Aldrich, St. Louis, MO) was added to the bacterial suspension, and the mixture was incubated for 3 h at 37°C. At the conclusion of the incubation, 10l of Invitrogen PureLink RNase (20 mg/ml; Thermo Fisher Scientific) was added, and the suspension incubated an additional 15 min at room temperature. The entire suspension was transferred into well 1 of a Maxwell-16 tissue DNA cartridge (Promega, Madison, WI). Extraction was performed on a Maxwell-16 instrument (Promega) with final elution into 300l of elution buffer. To remove contaminating magnetic beads, extracted DNA was further purified on a Zymo genomic DNA clean and concentrate 25 minicolumn following the manufacturer’s protocol (Zymo Research, Irvine, CA). Eluted DNA was measured with a Quantus fluorometer and QuantiuFluor dsDNA system (Promega) and diluted up to 300 l in Qiagen buffer EB (Qiagen, Valencia, CA). A minimum concentration of 20 ng/l was used for WGS library preparation.
Library preparation and Illumina MiSeq sequencing.Sequencing was performed on TruSeq v3 paired-end and Nextera mate-pair libraries (target mate pair insert size of 8 kbp) using a MiSeq
on May 16, 2020 by guest
http://jcm.asm.org/
instrument (Illumina, Inc.) with a 2⫻300-cycle kit, resulting in an average raw genomic coverage of 252⫻per sequenced isolate.
MAVIS pipeline processing.Sequencing reads were processed for library adapter removal and initial filtering using Trimmomatic v0.32 with the parameters Illuminaclip:adapters.fasta:2:20:10 Leading:3 Trailing:3 Maxinfo:220:0.1 Minlen:70 (17). KmerGenie v1.6741 was used to construct a k-mer-based coverage histogram to guarantee a minimum coverage and to normalize the coverage to a standard of 100⫻(18). A multiphased genome assembly process applied with a custom script was used for genome assembly. Velvet v1.2.10 was run multiple times on the same data set, varying the k-mer parameter (31 to 121 in steps of 10) (19). The Velvet assembly from all runs was selected based on the largest continuous contig. SPAdes v3.1.1 was used for guided assembly, with Velvet assembly used as a guide for progressive k-mer assemblies (k⫽21, 33, 55, 77, 99, and 127; the defaults for SPAdes for this read length) (20, 21). Genome quality control was performed as follows (22). Contigs with low coverage (ⱕ10⫻) and⬍250 bp long were removed. Contigs that aligned to quality control sequences (e.g., phiX) and low-complexity contigs (e.g., homopolymers such as CCCC and AAAA) were removed. Paired-end reads were mapped to the generated reference genome by using BWA v0.7.12 to detect bases that were inconsistent with reads in the finished genome (23). SNPs/indels were called using SAMtools v1.1, and ambiguous bases were replaced with via N=(24). SNP calling was performed relative to an annotated genome assembly. The reference assembly was obtained by comparing assembled genomes against the NCBI database and NCBI BLAST. Nearest-neighbor annotated genomes were used as the reference genome for subsequent analyses. Coverage-reduced paired-end data were mapped to the reference genome by using BWA v0.7.12. Differences between isolate and reference assemblies were calculated using variant calling (VarScan v2.3.7; min-coverage of 8, min-reads2 of 8, q 20) (25). VCFtools v0.1.12b was used to construct a single sample variant call format (VCF) across all samples (26). A custom program was used to examine the relative coverage of variants in the VCF, compute a distance matrix, and isolate groupings. cgMLST was also performed. First, orthologues between the annotated and sample genome were identified by predicting genes (using Prodigal v2.6), and the resulting amino acid sequences were compared using BLAST⫹v2.2.26 (27). BioR v2.4.1 was used to annotate the sample genomes and identify orthologous genes (28). These genes were used to assemble the nucleotide version of a given gene for all samples. Muscle v3.8.31 was then used to build a multiple-sequence alignment across orthologues for selected genes (29). FastTree v2.1.7 was used to calculate relatedness across all samples based on the alignment (30). A detailed and comprehensive description of the pipeline code has been deposited in GitHub (https://github.com/pjeraldo/S_aureus_typing_methods).
Statistical determination of SNP cutoffs.To determine the number of SNP differences, in order to classify isolates into different groups (indistinguishable, closely related, different), we cast the data into a model selection problem and performed model selection based on Bayes factors (31). In essence, we compared the likelihood of the observed SNP differences under different models (indistinguishable, closely related, different) and selected the most probable model. We thus needed to estimate the probability distribution of the number of SNP differences for indistinguishable, closely related, and different samples, respectively. A training data set consisting of three isolates of MRSA (MBRL-841, MBRL-1573, and MBRL-1575), with 3 technical replicates of each, was used to estimate the distributions. The number of SNP differences between these isolates, as well as those from the reference strains USA100 though USA1200, was calculated. The observed numbers of SNP differences between technical replicates, between isolates of the same microbial type (e.g., USA1000), and between different types were used to represent the distribution of the number of SNP differences from indistinguishable, closely related, and different isolates, respectively. Due to truncation at 0 for indistinguishable samples, we fitted the data (numbers of SNP differences) by using a scaled chi-square distribution, while the data from the other two groups were fitted using normal distributions. Parameters of the distributions were estimated using the method of moments.
Based on the three estimated probability distributions, the Bayes factor approach was used to determine the cutoff values for classification of isolates. Given a model selection problem in which we had to choose between two models (e.g., indistinguishable versus closely related), on the basis of observed data set D (i.e., the number of SNP differences), the plausibility of the two models, M1 and M2, was assessed by determining the Bayes factor K, as follows: K⫽[P(D|M1)]/[P(D|M2)], where P(D|M) is the probability of the data, given model M, which could be estimated using the fitted probability distribu-tions described above. A Bayes factor of 100 indicates that model M1 is 100 times more likely than model M2, and hence M1 will be chosen over M2 (32). Based on the principle, the following cutoff values (d) were derived: indistinguishable, dⱕ22; possibly closely related, 43ⱕdⱕ450; different, dⱖ600. We filled gaps with the following groupings: closely related, 23ⱕd⬍43; possibly different, 450⬍d⬍600.
SeqSphereⴙcgMLST.Two data sets were examined with SeqSphere⫹software. First, assembled contig (from paired-end and mate-pair data) fasta.gz files were uploaded and processed with theS. aureuscgMLST scheme (6). Final assembly contigs were provided after using SPAdes 3.1.1 and Velvet 1.2.10 (19, 33). Minimum spanning trees (MST) for each of the three outbreak groups were constructed within the SeqSphere⫹software. Next, paired-end reads alone were assembled with the SeqSphere⫹ automated assembly pipeline. Assembled files were processed through theS. aureuscgMLST scheme within SeqSphere⫹, and MSTs were constructed for each of the three outbreak groups.
Statistical comparison of SNP and cgMLST data.The Mantel Spearman correlation was calculated between pairs of the similarity measures within the burn unit outbreak, Connecticut football team outbreak, and postsurgical unit outbreak (34). Jackknife resampling (resampling without replacement and 10% omitted) was used to determine 95% confidence intervals for the correlations, based on 100,000
on May 16, 2020 by guest
http://jcm.asm.org/
jackknife samples. To test for associations, permutation-based Mantel tests were conducted using 100,000 permutations.
SUPPLEMENTAL MATERIAL
Supplemental material for this article may be found at
https://doi.org/10.1128/JCM
.00029-17
.
SUPPLEMENTAL FILE 1,
PDF file, 0.2 MB.
ACKNOWLEDGMENTS
R.P. has received grants from BioFire, Check-Points, Curetis, 3M, Merck, Hutchison
Biofilm Medical Solutions, Accelerate Diagnostics, Allergan, and The Medicines
Com-pany. R.P. is a consultant to Curetis, Roche, Qvella, and Diaxonhit. In addition, R.P. has
a patent on
Bordetella pertussis/parapertussis
PCR with royalties paid by TIB, a patent on
a device/method for sonication with royalties paid by Samsung to Mayo Clinic, and a
patent on an antibiofilm substance. R.P. serves on an Actelion data monitoring board.
R.P. receives travel reimbursement and an editor’s stipend from ASM and IDSA and
honoraria from the USMLE, Up-to-Date, and the Infectious Diseases Board Review
Course.
We thank the Mayo Clinic Center for Individualized Medicine for supporting this
study. We thank John Dekker and Pavel Khil for providing technical advice about DNA
extraction and Henry F. Chambers for providing control strains.
REFERENCES
1. Centers for Disease Control and Prevention. 2014. Active bacterial core surveillance report, Emerging Infections Program Network, Methicillin-resistantStaphylococcus aureus, 2014. CDC, Atlanta, GA.http://www.cdc .gov/abcs/reports-findings/survreports/mrsa14.html.
2. Cookson BD, Robinson DA, Monk AB, Murchan S, Deplano A, de Ryck R, Struelens MJ, Scheel C, Fussing V, Salmenlinna S, Vuopio-Varkila J, Cuny C, Witte W, Tassios PT, Legakis NJ, van Leeuwen W, van Belkum A, Vindel A, Garaizar J, Haeggman S, Olsson-Liljequist B, Ransjo U, Muller-Premru M, Hryniewicz W, Rossney A, O’Connell B, Short BD, Thomas J, O’Hanlon S, Enright MC. 2007. Evaluation of molecular typing methods in charac-terizing a European collection of epidemic methicillin-resistant Staphy-lococcus aureusstrains: the HARMONY collection. J Clin Microbiol 45: 1830 –1837.https://doi.org/10.1128/JCM.02402-06.
3. McDougal LK, Steward CD, Killgore GE, Chaitram JM, McAllister SK, Tenover FC. 2003. Pulsed-field gel electrophoresis typing of oxacillin-resistantStaphylococcus aureusisolates from the United States: estab-lishing a national database. J Clin Microbiol 41:5113–5120.https://doi .org/10.1128/JCM.41.11.5113-5120.2003.
4. Strommenger B, Kettlitz C, Weniger T, Harmsen D, Friedrich AW, Witte W. 2006. Assignment ofStaphylococcusisolates to groups byspatyping, SmaI macrorestriction analysis, and multilocus sequence typing. J Clin Microbiol 44:2533–2540.https://doi.org/10.1128/JCM.00420-06. 5. Reuter S, Ellington MJ, Cartwright EJ, Koser CU, Torok ME, Gouliouris T,
Harris SR, Brown NM, Holden MT, Quail M, Parkhill J, Smith GP, Bentley SD, Peacock SJ. 2013. Rapid bacterial whole-genome sequencing to enhance diagnostic and public health microbiology. JAMA Intern Med 173:1397–1404.https://doi.org/10.1001/jamainternmed.2013.7734. 6. Leopold SR, Goering RV, Witten A, Harmsen D, Mellmann A. 2014.
Bacterial whole-genome sequencing revisited: portable, scalable, and standardized analysis for typing and detection of virulence and antibi-otic resistance genes. J Clin Microbiol 52:2365–2370.https://doi.org/10 .1128/JCM.00262-14.
7. McCarthy N. 2013. An epidemiological view of microbial genomic data. Lancet Infect Dis 13:104 –105. https://doi.org/10.1016/S1473-3099 (12)70324-9.
8. Kupferschmidt K. 2011. Epidemiology. Outbreak detectives embrace the genome era. Science 333:1818 –1819. https://doi.org/10.1126/science .333.6051.1818.
9. Hall BG, Ehrlich GD, Hu FZ. 2010. Pan-genome analysis provides much higher strain typing resolution than multi-locus sequence typing. Micro-biology 156:1060 –1068.https://doi.org/10.1099/mic.0.035188-0. 10. Azarian T, Cook RL, Johnson JA, Guzman N, McCarter YS, Gomez N,
Rathore MH, Morris JG, Salemi M. 2015. Whole-genome sequencing for
outbreak investigations of methicillin-resistantStaphylococcus aureusin the neonatal intensive care unit: time for routine practice? Infect Control Hosp Epidemiol 36:777–785.https://doi.org/10.1017/ice.2015.73. 11. Davis MF, Misic AM, Morris DO, Moss JT, Tolomeo P, Beiting DP,
Nachamkin I, Lautenbach E, Rankin SC. 2015. Genome sequencing reveals strain dynamics of methicillin-resistantStaphylococcus aureus in the same household in the context of clinical disease in a person and a dog. Vet Microbiol 180:304 –307. https://doi.org/10.1016/j .vetmic.2015.09.007.
12. Harris SR, Cartwright EJ, Torok ME, Holden MT, Brown NM, Ogilvy-Stuart AL, Ellington MJ, Quail MA, Bentley SD, Parkhill J, Peacock SJ. 2013. Whole-genome sequencing for analysis of an outbreak of meticillin-resistantStaphylococcus aureus: a descriptive study. Lancet Infect Dis 13:130 –136.https://doi.org/10.1016/S1473-3099(12)70268-2.
13. Koser CU, Holden MT, Ellington MJ, Cartwright EJ, Brown NM, Ogilvy-Stuart AL, Hsu LY, Chewapreecha C, Croucher NJ, Harris SR, Sanders M, Enright MC, Dougan G, Bentley SD, Parkhill J, Fraser LJ, Betley JR, Schulz-Trieglaff OB, Smith GP, Peacock SJ. 2012. Rapid whole-genome sequencing for investigation of a neonatal MRSA outbreak. N Engl J Med 366:2267–2275.https://doi.org/10.1056/NEJMoa1109910.
14. Moore G, Cookson B, Gordon NC, Jackson R, Kearns A, Singleton J, Smyth D, Wilson AP. 2015. Whole-genome sequencing in hierarchy with pulsed-field gel electrophoresis: the utility of this approach to establish possible sources of MRSA cross-transmission. J Hosp Infect 90:38 – 45.
https://doi.org/10.1016/j.jhin.2014.12.014.
15. Bletz S, Mellmann A, Rothganger J, Harmsen D. 2015. Ensuring back-wards compatibility: traditional genotyping efforts in the era of whole genome sequencing. Clin Microbiol Infect 21:347.e1– 4.https://doi.org/ 10.1016/j.cmi.2014.11.005.
16. Mossong J, Decruyenaere F, Moris G, Ragimbeau C, Olinger CM, Johler S, Perrin M, Hau P, Weicherding P. 2015. Investigation of a staphylococcal food poisoning outbreak combining case-control, traditional typing and whole genome sequencing methods, Luxembourg, June 2014. Euro Surveill 20(45):pii⫽30059.https://doi.org/10.2807/1560-7917.ES.2015.20 .45.30059.
17. Bolger AM, Lohse M, Usadel B. 2014. Trimmomatic: a flexible trimmer for Illumina sequence data. Bioinformatics 30:2114 –2120.https://doi.org/10 .1093/bioinformatics/btu170.
18. Chikhi R, Medvedev P. 2014. Informed and automated k-mer size selec-tion for genome assembly. Bioinformatics 30:31–37.https://doi.org/10 .1093/bioinformatics/btt310.
19. Zerbino DR, Birney E. 2008. Velvet: algorithms forde novoshort read
on May 16, 2020 by guest
http://jcm.asm.org/
assembly using de Bruijn graphs. Genome Res 18:821– 829.https://doi .org/10.1101/gr.074492.107.
20. Bankevich A, Nurk S, Antipov D, Gurevich AA, Dvorkin M, Kulikov AS, Lesin VM, Nikolenko SI, Pham S, Prjibelski AD, Pyshkin AV, Sirotkin AV, Vyahhi N, Tesler G, Alekseyev MA, Pevzner PA. 2012. SPAdes: a new genome assembly algorithm and its applications to single-cell sequenc-ing. J Comput Biol 19:455– 477.https://doi.org/10.1089/cmb.2012.0021. 21. Vasilinetc I, Prjibelski AD, Gurevich A, Korobeynikov A, Pevzner PA. 2015. Assembling short reads from jumping libraries with large insert sizes. Bioinformatics 31:3262–3268. https://doi.org/10.1093/bioinformatics/ btv337.
22. Gurevich A, Saveliev V, Vyahhi N, Tesler G. 2013. QUAST: quality assess-ment tool for genome assemblies. Bioinformatics 29:1072–1075.https:// doi.org/10.1093/bioinformatics/btt086.
23. Li H. 2013. Aligning sequence reads, clone sequences and assembly contigs with BWA-MEM. arXiv arXiv:1301.3997v2 [q-bio.GN].http://arXiv .org/abs/1207.3907v2.
24. Li H, Handsaker B, Wysoker A, Fennell T, Ruan J, Homer N, Marth G, Abecasis G, Durbin R. 2009. The sequence alignment/map format and SAMtools. Bioinformatics 25:2078 –2079. https://doi.org/10.1093/ bioinformatics/btp352.
25. Koboldt DC, Zhang Q, Larson DE, Shen D, McLellan MD, Lin L, Miller CA, Mardis ER, Ding L, Wilson RK. 2012. VarScan 2: somatic mutation and copy number alteration discovery in cancer by exome sequencing. Genome Res 22:568 –576.https://doi.org/10.1101/gr.129684.111. 26. Danecek P, Auton A, Abecasis G, Albers CA, Banks E, DePristo MA,
Handsaker RE, Lunter G, Marth GT, Sherry ST, McVean G, Durbin R. 2011. The variant call format and VCFtools. Bioinformatics 27:2156 –2158.
https://doi.org/10.1093/bioinformatics/btr330.
27. Hyatt D, Chen GL, Locascio PF, Land ML, Larimer FW, Hauser LJ. 2010. Prodigal: prokaryotic gene recognition and translation initiation site
identification. BMC Bioinformatics 11:119.https://doi.org/10.1186/1471 -2105-11-119.
28. Kocher JP, Quest DJ, Duffy P, Meiners MA, Moore RM, Rider D, Hossain A, Hart SN, Dinu V. 2014. The Biological Reference Repository (BioR): a rapid and flexible system for genomics annotation. Bioinformatics 30: 1920 –1922.https://doi.org/10.1093/bioinformatics/btu137.
29. Edgar RC. 2004. MUSCLE: multiple sequence alignment with high accu-racy and high throughput. Nucleic Acids Res 32:1792–1797.https://doi .org/10.1093/nar/gkh340.
30. Price MN, Dehal PS, Arkin AP. 2010. FastTree 2: approximately maximum-likelihood trees for large alignments. PLoS One 5:e9490.https://doi.org/ 10.1371/journal.pone.0009490.
31. Goodman SN. 1999. Toward evidence-based medical statistics. 2: the Bayes factor. Ann Intern Med 130:1005–1013.https://doi.org/10.7326/ 0003-4819-130-12-199906150-00019.
32. Jeffrey H. 1961. Theory of probability, 3rd ed. Oxford, New York, NY. 33. Nurk S, Bankevich A, Antipov D, Gurevich AA, Korobeynikov A, Lapidus
A, Prjibelski AD, Pyshkin A, Sirotkin A, Sirotkin Y, Stepanauskas R, Clin-genpeel SR, Woyke T, McLean JS, Lasken R, Tesler G, Alekseyev MA, Pevzner PA. 2013. Assembling single-cell genomes and mini-metagenomes from chimeric MDA products. J Comput Biol 20:714 –737.
https://doi.org/10.1089/cmb.2013.0084.
34. Mantel N. 1967. The detection of disease clustering and a generalized regression approach. Cancer Res 27:209 –220.
35. Begier EM, Frenette K, Barrett NL, Mshar P, Petit S, Boxrud DJ, Watkins-Colwell K, Wheeler S, Cebelinski EA, Glennen A, Nguyen D, Hadler JL. 2004. A high-morbidity outbreak of methicillin-resistantStaphylococcus aureusamong players on a college football team, facilitated by cosmetic body shaving and turf burns. Clin Infect Dis 39:1446 –1453.https://doi .org/10.1086/425313.