Methodology for Prediction of Sliding and Rocking of Rigid Bodies
Using Fast Non-Linear Analysis (FNA) Formulation
Sohrab Esfandiari - ENOVA Engineering Services Robert P. Kennedy- RPK Structural Consulting
Miguel Manrique- Transnuclear West, Inc.
Robert Grubb - Transnuclear West, Inc.
ABSTRACT
Behavior of unanchored rigid bodies under seismic (or other types of dynamic) loading has been thoroughly studied in the past. Rigid bodies are likely to slide, rock, or slide-rock when subject to seismic motion, depending on the magnitude of the input motion versus the coefficient of friction between the two contact surfaces. The extent of sliding and rocking, or combination of both, is dependent on a variety of factors such as the aspect ratio of the cask, the amplitude of seismic motion, friction coefficient, and the coefficient of restitution between the two surfaces. Any computer program capable of modeling the non-linearity of the contact surface (friction, gap, and contact) is capable of predicting the behavior of unanchored rigid bodies subject to seismic motion.
This paper discusses the methodology used by the Computer program SAP2000 for modeling and analyzing rigid blocks under seismic loading. The contact surface is modeled using SAP2000's Nllink element and the code's Fast Non- linear Analysis (FNA) method is utilized for the analysis. The FNA approach proved to be very accurate and extremely fast for the application compared to more traditional non-linear time-history analysis techniques. The behavior of the rigid block under dynamic loading is benchmarked using literature data. This methodology can be adopted to accurately predict the sliding, rocking, or slide-rock behavior of unanchored rigid blocks. Typical applications include prediction of extent of sliding and rocking for any unanchored object in nuclear power plants subject to seismic or any other type of dynamic loading. The accurate prediction of sliding and rocking can be used in the decision process for anchorage or lateral tie-down of temporary structures as well as in System Interaction (II over I) programs.
INTRODUCTION
Determination of sliding and rocking behavior of rigid blocks has been subject of extensive past analysis and testing. There is extensive amount of literature data that document the sliding and rocking behavior of rigid blocks under steady state loading. However, to accurately predict the sliding and rocking behavior of rigid blocks under random dynamic loading (such as earthquake loading), the problem has to be analyzed using a computer program capable of handling geometric non- linearity associated with the contact surface (friction, gap and bounce-back properties). Most computer programs capable of modeling the non-linearity of the contact surface can predict this behavior. However, such analyses typically take a long time depending on the algorithm used by the program to satisfy equilibrium conditions as the contact surface conditions change. The non-linearities associated with modeling the contact surface include modeling the friction between the two surfaces to correctly predict sliding behavior, and modeling the gap/contact surface to predict the rocking behavior. Solution convergence is the key when the geometric conditions at the contact surface change from at-rest to slide (for the case of friction), or from uplift (gap) to slam-down (compression only) for the case of rocking.
This paper discusses various modes of rigid body sliding and rocking behavior under dynamic loading, including modeling and analysis methodology. This problem was modeled and analyzed using the Non-linear version of the SAP2000 Code. This code utilizes a solution technique called the Fast Non-Linear Analysis (FNA) formulation, which yields fairly accurate and fast solutions by treating the non-linearity as local conditions. The solution was benchmarked against available literature data for known steady-state loading. The solution time utilizing the FNA method was much faster than comparable codes utilizing traditional step-by-step direct integration technique to achieve solution.
SLIDING & ROCKING BEHAVIOR OF RIGID BLOCKS
Ref. 1 provides a detailed discussion of criteria for initiation of slide, rock, and slide-rock rigid body modes for a rigid body subject to a piece-wise continuous acceleration pulse, which starts from zero. The paper presents charts for various amplitudes of ground motion Ag versus coefficient of friction ~ for a rigid body having an aspect ratio H/B (Height to width) of 2 and 4. The focus of the paper in Ref. 1 is on the fact that between a pure slide and pure rock mode, there exists a transitional slide-rock mode. Figure 3 of Ref. 1 provides a chart of various zones of initiation of different response mode for H/B=2. This F i g u r e is s h o w n as Figure 1.
As seen from this Figure, there are 4 modes of response, namely 1) at rest, 2) pure slide, 3) pure rock, and 4) slide rock. For a H/B ratio of 2, if peak ground acceleration Ag, is less than coefficient of friction ~t, then the rigid body will remain at rest for Ag values up to 0.5g, at which point rocking will initiate. For peak acceleration Ag > ~ (for range of ~ from 0 < tx < 0.5), the rigid block will undergo pure slide. For ~t > 0.5 and Ag > 0.5, the rigid block will behave in a pure rocking mode. However, from the pure slide to pure rock behavior, there exists a transition zone called the slide-rock, which is schematically shown in Figure 1.
1 . 0
u 0 . 5
R o c k
R e ~ t
S l i d e R o c k
S l i d e
0 0.5 1.0
Ag
F i g u r e 1: B o u n d a r i e s of Rest, Slide, Rock, a n d Slide-Rock Modes for H]B=2
M O D E L I N G
This problem is modeled using two rigid beams, one which models the height of the C.G. above the contact surface (H) and the other, which spans across the width of the block (B). The model is an idealized 2-D representation of the rigid block. The width chosen is the dimension where the anticipated rocking is of interest. Figure 2 shows this model schematically. The contact surface is modeled using SAP2000N Nllink element. The non-linear properties assigned to this NLLink element represent coupled friction properties for the two shear deformations, post-slip stiffness in the shear directions, gap/contact behavior in the axial direction, and linear stiffness properties for the three rotational degrees of freedom (not used in these analyses). The element is capable of inputting different coefficients of friction for fast velocity versus slow velocity conditions. The post slip stiffness is set to zero. The pre-slip stiffness in the shear deformation direction (U2) and the contact stiffness in the down axial direction (-Z) need to be set to some value which is relatively rigid. At the same time these values should be set not too high so that problems with solution convergence due to iteration of non-linear equations of motion are avoided. Discrete vertical dampers are introduced at the base to properly represent the energy absorption due to vertical impact. A rotational discrete damper is introduced at the C.G. to represent the rocking energy absorption behavior.
~ P
C:G f IR o t a ~ o n a l D a m p e r
I t ~i ~
:':°"
i
i
V e r t i c a l t t I I
Damper
B IBENCHMARKING OF THE MODEL
To ensure that the model adequately predicts the behavior of a rigid block, a number of benchmark tests were run:
.
2. 3. 4.
Horizontal sine Pulse tests Vertical sine Pulse tests Vertical drop
Rocking free-vibration
The purpose of the horizontal sine Pulse test is to ensure that the frictional representation of the contact surface behaves as expected. The purpose of the vertical sine Pulse test was to ensure that the gap/contact representation of the contact surface behaves as expected. The purpose of the vertical drop test was to ensure that the bounce back representation of the contact surface behaves as expected. Finally, the purpose of the rocking free-vibration test was to ensure that the energy absorption due to rocking behavior of the model behaves as expected. All analyses were performed using SAP2000N computer code, utilizing the FNA analysis methodology.
Horigontal Sine Pulse Tests
For horizontal sine Pulse test, the model was analyzed subject to a sine Pulse g r o u n d acceleration of v a r y i n g a m p l i t u d e s at an a r b i t r a r y frequency of 5 Hz. a n d v a r y i n g kt to d e t e r m i n e if t h e model can predict various response modes in a g r e e m e n t w i t h the t h e o r y p r e s e n t e d in Ref. 1. F o u r cases were r u n as outlined in Table below:
1
VIax.Ag (g) ~ . . . : A n t i c i p a t e d i n i t i a l r e s p o n s e mod~
0.2 0.4 At rest
2 I 1.5 [ 0.2 P u r e Slide
3 J 1.5 10-~ Slide-Rock
0.8
0.8 P u r e Rocking
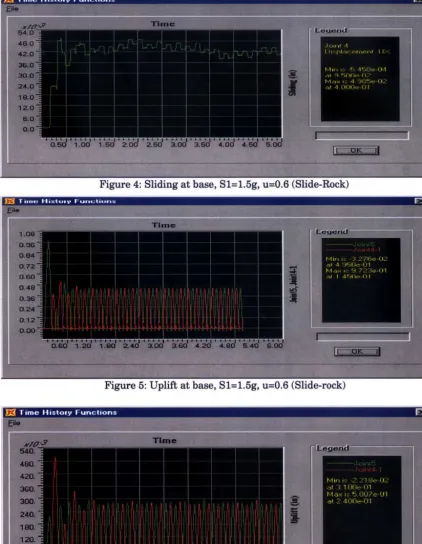
Figures 3 t h r o u g h 6 show the sliding and rocking response of each of t h e s e analyses cases. As seen from these Figures, the model b e h a v e s exactly as expected, i.e. is at r e s t for case 1, p u r e slide for case 2, rock-slide for case 3 a n d p u r e rocking for case 4. P u r e slide case is one w h e r e sliding occurs b u t uplift due to rocking is zero (see F i g u r e 3 for sliding for this case). Slide-rock case is w h e r e some sliding a n d rocking occur s i m u l t a n e o u s l y (see F i g u r e s 4 & 5). P u r e rocking case is w h e r e sliding is practically zero, b u t the model does rock (see Figure 6). As evident from these Figures, t h e response of the model subject to t h e s e sine pulse test cases, it was concluded t h a t the frictional r e p r e s e n t a t i o n of the model contact surface w a s b e h a v i n g as expected, t h u s b e n c h m a r k e d .
Figure 4: Sliding at base, $1=1.5g, u=0.6 (Slide-Rock)
Figure 5: Uplift at base, $1=1.5g, u=0.6 (Slide-rock)
Vertical Sine Pulse Test
Next the model was benchmarked using a vertical sine pulse of varying amplitude and constant frequency of 5 Hz. as input motion. The purpose of this benchmark was to ensure that the gap representation of the contact surface in the model worked as expected. For vertical direction, 2 separate analyses were performed:
1 Amplitude Ag = 0.9g (no uplift expected)
2 Amplitude Ag = 1.5g (free-flight uplift expected)
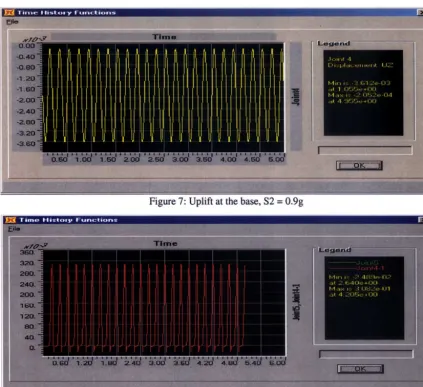
The first analysis should result in no uplift. The second analysis corresponds to the upper bound amplitude for which the ground motion in the vertical direction exceeds gravity, thus resulting in free-flight of the model. Both of these cases should result in no sliding, since the input motion is purely in the vertical direction. All analyses were run for a ~t=0.4. For the first case, the vertical displacements at the base were zero as expected (see Figure 7), thus showing the gap element still in contact. Figures 8 shows the uplift at the base for the second case. Figure 10 shows the base of the model uplifting every time the input motion vertical pulse exceeds gravity. Therefore it was concluded that the gap/contact representation of the contact surface was behaving as expected and thus benchmarked.
Figure 7: Uplift at the base, $2 = 0.9g
Figure 8" Uplift at base, $2= 1.5g
Vertical Drop Test
1. Absorb energy upon impact due to flee-flight mode of response
2. Absorb energy upon impact due to rocking mode of response, when acting as a couple
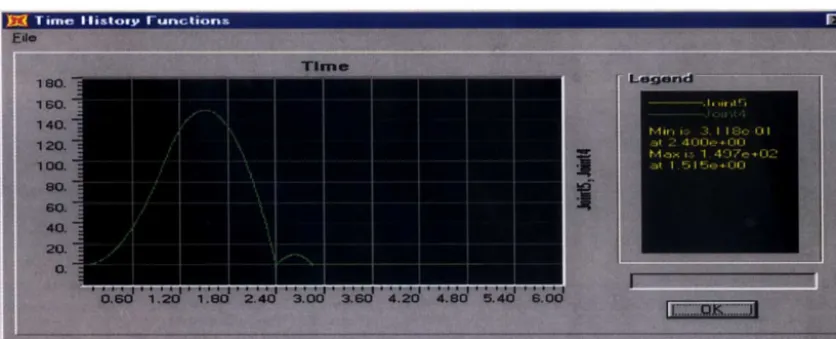
The value of damping associated with these discrete dampers is a function of the coefficient of restitution between the two surfaces, which represents the response characteristics of the contact surface for a free-flight drop. The effect of these dashpots acting as a couple thus absorbing rocking energy is discussed later on in the paper under the following rocking benchmark test. Under this benchmark run, a vertical force pulse equal to 1.5g times mass of the structure was applied to the two base nodes of the model. This pulse was held constant for 1 sec. and then drops to zero and is held at zero for 4 seconds to simulate free-vibration condition. For a C r v = 0.25, meaning that exit velocity upon impact (post-impact velocity) should be 25% of pre-impact velocity, thus the exit displacement (or bounce-back displacement) should be 6.25% of free-fall displacement (energy loss due to impact is proportional to 1-Crv 2 = 0.9375, thus rebound energy equals 6.25% of impact energy). Figures 9 shows the bounce-back displacement under the free-fall condition. As seen from this plot, the bounce back displacement is 9.77"/149.7" = 6.5%. The match is excellent. Therefore the model is considered as benchmarked under a pure free-fall free-vibration test.
Figure 9: Bounce-back under free-fall test
Rocking Free-Vibration Test
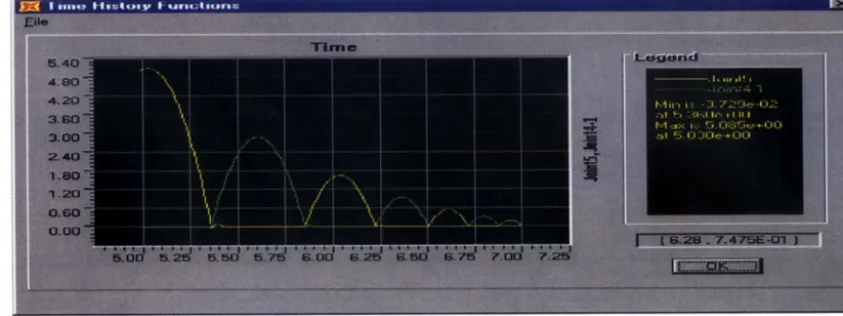
A rigid block in pure rocking mode (meaning if sliding was prevented) would dissipate energy by means of impact of each base node on the ground during the rocking motion. Reference 2 provides more background on rocking response of unanchored rigid bodies. This rocking energy dissipation will need to be properly represented. This energy dissipation mechanism can be either modeled using a rotational dashpot at the CG of the rigid block. To ensure proper benchmarking of the model in the pure rocking mode, a benchmark flee-vibration rocking analysis was performed to determine if an additional rotational dashpot needs to be added to CG of the rigid block, since the couple action of the two vertical dashpots provided at the base nodes, in effect also absorb the energy dissipated due to rocking motion of the rigid body.
~ . ! i l l i t ~ H i ~ | t g n y l - u r l t ~ l i l i u r l ~
~ ... : . . ... : . . .
~ .~ - . . .
",, . . . • . - . :..-... _:~ -
u,., P.:.'lti, ~ i-: _ - 1 . - 5 . - ? , , - 1 , = . _ 1 - 1 - ,
' . . . . . :::k~-~:-:, ~ ~ i -
i .=1 I- ~ o . 17 -~ i - i ~ + i~1 i-I
~ ! ' - - " - - -
, / - " ! ... -.. ! . . .
. . . , . ; - , . . . . . .
~ , . ~ ~ . . . .
Figure 10: Rocking Free-Vibration benchmark response for final Co
FAST N O N L I N E A R ANALSIS M E T H O D O L O G Y
The Fast Non Linear Analysis (FNA) methodology was used for all benchmark analyses as well as any follow-up seismic or other random dynamic analysis. The analysis convergence time was quite fast compared to similar problem solved using more traditional direct integration methodology at each time step in order to converge on system equilibrium. Typical solution convergence time using the FNA approach compared to traditional direct integration approach was approximately a factor of 1000 times faster thus allowing the engineer to experiment with a number of different solution alternatives in a fraction of time.
Generally in civil/structural problems the non-linear behavior of the structure is limited to a small number of predefined locations, as is the case with local non-linear behavior at the contact surface of a rigid block. For such problems, the FNA approach yields a much faster solution time based on using "constant stiffness iteration", a n d "load d e p e n d e n t Ritz vectors" to a c c u r a t e l y c a p t u r e t h e b e h a v i o r of t h e n o n l i n e a r e l e m e n t s a n d t h e r e d u c e d set of modal equations to solve for exactly a linear variation of forces during a small time step. Numerical damping or stiffness and mass proportional damping errors are not typically introduced in this approach. To achieve a stable solution using FNA, the computer model must be structurally stable without the nonlinear elements. The model is made stable by introduction of a dummy elastic element in parallel with the nonlinear element and its stiffness is added to the basic computer model. The forces in this dummy element are then removed during the nonlinear iterative solution phase. This dummy or effective stiffness element eliminates the introduction of long periods into the basic model and improve accuracy and rate of convergence for many nonlinear structures. It should be noted that structures subject to static loads can also be solved by the FNA method.
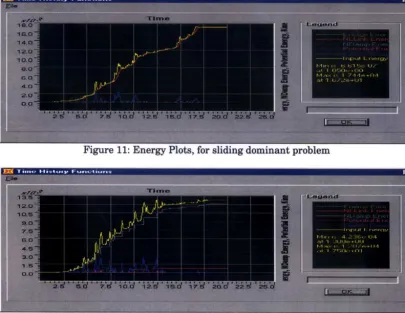
F i g u r e 11: E n e r g y Plots, for sliding d o m i n a n t p r o b l e m
Figure 12: Energy Plots, for rocking dominant problem
CONCLUSIONS
Once the model is established and properly benchmarked, then the model can be subject to any random dynamic loading such as earthquake loading. With the fast solution time of the FNA approach as indicated before, the sliding and rocking response of any rigid block can simply and accurately be predicted. The solution is very stable, even for vertical motions in excess of 1.0g PGA where the model is essentially put into a vertical free-flight mode of response. It should be noted that the model must have some kind of energy dissipation mechanism, such as the vertical and rotational discrete dampers in order to obtain sensible results.
PRACTICAL APPLICATIONS
Sliding and rocking behavior of unanchored bodies under seismic loading is a subject of interest in the nuclear power industry. Particularly during outages, due to temporary nature of various operations, it is desired not to anchor down all objects. However, seismic requirements in nuclear power plants often result in anchoring and tie down of various temporary structures during outages. If sliding and rocking response of unanchored structures and equipment could easily be computed, perhaps the need for anchorage and tie-down could be eliminated thus resulting in significant operational efficiencies. Another very important application in the nuclear power industry is the current and upcoming operations associated with Dry Storage Casks. Placement of Dry Storage Casks on ISFSI pads as well as placement of the cask inside the Fuel Handling Building for the purposes of removal and storage of used fuel involves placement of these fairly large casks. If the seismic response of these large unanchored casks results in acceptable levels of sliding and rocking, then the need for expensive lateral restraint structures, physical anchorage, or tie downs may be eliminated thus resulting in significant operational efficiencies and cost savings.
REFERENCES
[1] - Shenton III, Harry W, Criteria for initiation of Slide, Rock, and Slide-Rock Rigid-Body Modes, Journal of Engineering Mechanics, July 1996.
[2] - Yim, Chik-Sing, Chopra, Anil K. and Penzien, Joseph, Rocking response of rigid blocks to earthquakes, Journal of Earthquake Engineering and Structural Dynamics, Voll 8, pp 565-587 (1980).
![Figure 1: Boundaries of Rest, Slide, Rock, and Slide-Rock Modes for H]B=2](https://thumb-us.123doks.com/thumbv2/123dok_us/1571703.1193272/2.596.115.456.492.652/figure-boundaries-rest-slide-rock-slide-rock-modes.webp)