©IJRASET (UGC Approved Journal): All Rights are Reserved
Named Entity Recognition and Gene Disease
Relationship Extraction Using Relevance Vector
Machine (RVM) Classifier
S. Vijaya1, Dr. R. Radha2
1,2Dept. of Computer Science, S. D. N. B. Vaishnav College for Women, Chennai.
Abstract: Owing to a substantial amount of scientific publications, which cannot be merged manually, a soaring interest has been noticed in text mining methods for automated information capture, particularly in the biomedical field. Such methods yield an efficient way of information search, knowledge discovery and hypothesis generation. Most of the earlier studies have been basically focused over the design and performance enhancement of either known entity recognition or relation extraction. In this research work, Named Entity Recognition (NER) with Relevance Vector Machine (RVM) classification is introduced for gene disease relation extraction. As a first step, in the work, the abstracts are collected from PubMed, suitably pre-processed employing pre-processing techniques and then sent into a representation. In the second step, the dimensionality reduction of document-by-term data is carried out by Latent Semantic Indexing (LSI) along with optimization algorithm. In the third step, an Euclidean distance measure has been selected for the purpose of quantifying the association between genes in clustering algorithm. In the fourth step, the density based clustering algorithm is used over the distance matrix of entities for segregating them into various partitions. At last, using Two-phase RVM method Named Entities (gene names and disease names) are recognized in the first phase and the relationship between gene and disease is extracted in the next phase. The results obtained from the experiments show its potential performance by analyzing it on several corpora and have shown that it exceeds the available systems with an average precision of 94.56% for entity extraction and an average precision of 94.66% for entity classification.
Keywords: Text-mining, Dimensionality Reduction, clustering, Named Entity Recognition (NER), Gene disease relationship extraction, Latent Semantic Indexing(LSI), Relevance Vector Machine (RVM).
I.INTRODUCTION
Text mining assists the biologists in collecting the disease-gene associations automatically from large chunks of biological literature. During the last decade, so much of attention has been showered towards the automatic examination of the biomedical literature, which ranges from moderate techniques like annotation and extraction of keywords from biomedical text to more potential endeavors like Natural Language Processing(NLP), text-based network construction and inference etc. These computational attempts efficiently assist the biologists in identifying the most possible disease candidates for carrying out more experimental verification. At present, the most significant resource used for biomedical text mining applications comprises of the MEDLINE database evolved by the National Center for Biotechnology Information(NCBI) present at the National Library of Medicine(NLM). MEDLINE encompasses all the aspects of biology, chemistry and medicine; there is just no limitation to the kinds of information, which might be recovered through cautious and rigorous mining[1]. In our work we have collected abstracts related to “Breast cancer” and “Adenocarcinoma” diseases from PubMed database. PubMed consists of more than 27 millions citations for biomedical literature from MEDLINE. In order to extract the relevant information from the prolific amount of data and also, to extract resourceful high-level knowledge from the data text mining and machine learning have emerged to be essential tools in the current research.
©IJRASET (UGC Approved Journal): All Rights are Reserved
NER indicates the computational technique for automatically recognizing NE in natural language documents, For ex..associate it to a NE in the specific domain. For the biomedical domain, a NE is described to be a single word term or multi-words phrase, which represents a biomedical object, for example a protein, gene, disease or drug which is associated with a semantic hierarchy.in biomedical text mining is especially a challenge. It is proven by the fact that several aliases, various naming conventions, abbreviations, different organisms might reference to a same protein/gene with diverse terms, or else a term may indicate various biologically diverse entities. For instance, named entity “myc-c” may indicate a gene name in one context, but it may also represent the protein name in other context. In order to deal with those issues, various techniques have been used on NER employing rule based , dictionary matching based and machine learning based methods. With the speeding up growth in biomedical literatures that are published in more than thousands of journals several new terms and spelling variants of the terms that are existing have come up. And for those terms the rule based and dictionary based techniques do not have prediction potential. On the other hand, Machine learning based techniques have been depicted to be the most reliable technique for biomedical NER owing to its ability of dealing with high dimensional discriminative vector features in the text processing andpredicting new terms or variants depending on the patterns learned. In order to have a high performance and robust NER model trained, it is indispensable to completely extract the features that surround the word in the context. In the last few years, biomedical NER systems have been designed making use of the linguistic features of the word(ie., word stemming and lemmatization), the orthographic characteristics (formation of the word like the presence of upper case, symbols, digits etc), the morphological characteristics(ie.suffixes/prefixes, char n-grams and word shape), and local context characteristics(word window and conjuctions)[2]. Few systems also aggregated the exact dictionary matching to identify the named entities in a domain based dictionary. The binary encoding of the feature set is exploited to act as the input for the machine learning algorithm, in order to train the NER model, in addition to the human annotation of NE mentions present in the training dataset[3].The already available NER techniques are employed for extracting the gene-disease entities with no reduction in the dimension of the entities. In case the dimension of the entities tend to become high it is very hard to have the NER step processed. Therefore, in order to enhance the performance of NER, machine learning based NER approach is proposed for gene disease relation identification. The RVM has been employed as supervised machine learning technique for various high-performance NER systems owing to its relaxation over feature independence assumptions and therefore the benefit of dealing with high dimensional arbitrary feature sets in more efficient way over existing machine learning techniques like Hidden Markov Models(HMMs)[4],SupportVector Machines(SVMs)[5] and Maximum Entropy Markov Models(MEMMs)[6].The performance outcomes of the proposed approach has been assessed and then compared with the already available techniques. The rest of the other sections are organized as below: In section 2, the existing NER based gene disease detection approaches are discussed; In section 3, the proposed method RVM is explained; in section 4, the performance results are shown and the conclusion of the work is discussed in section 5.
II.RELATED WORK
©IJRASET (UGC Approved Journal): All Rights are Reserved
random fields(CRF) for the recognition in genes and diseases in free text is implemented. Afterwards, a SVM model that combines lexical features and syntactic features for identifying the associations between genes and diseases is trained. At last, a ranking algorithm for ranking the disease-related genes depending on co-occurrence frequency, paper citations and author information is proposed. The F-score of the NER stage is 87%, that is much higher compared to studies that exist already. The phase of association detection consumed very less time compared to earlier work when keeping up a competitive F-Score of 86%. The training time taken for this process was high. For recognizing disease names from biomedical text, Bhasuran et al.,[10] implemented a stacked ensemble method with fuzzy matching. The basic concept of stacked generalization is to integrate the results of base-level classifiers employing a second-level meta-classifier in an ensemble. Conditional Random Field(CRF) was used as the base classification techniques, which uses a different set of features, mostly dependent on domain specific orthographic and morphologically relevant. Moreover, fuzzy string matching was used for tagging the rare diseases names from the in-house disease dictionary. For the purpose of fuzzy matching , two best fuzzy search algorithms namely Rabin Karp and Tuned Boyer Moore were incorporated. This new technique indicates a result hoped of 94.66%,89.12% and 84.10%,76.71% of F-measure during the evaluation of training and testing set of both NCBI disease and BioCreativeV CDR Corpora.
Korkontzelos et al.,[11] carried out drug NER exploiting either a small gold-standard corpus or with no corpus at all. In this technique , a voting system was developed to integrate several heterogeneous models, depending on dictionary knowledge, gold-standard corpora and silver gold-standard annotations, to improve the performance. In order to boost the recall, genetic programming is employed to develop the 11 regular-expression patterns, which acquire the general drug suffixes and utilized them to be an additional means for recognition. This mechanism makes use of a dictionary of drug names ,ie., DrugBank, which is a small manually annotated corpus and a portion of the UKPMC database, in the form of raw biomedical text. Gold-standard and silver annotated data are brought into use for training the maximum entropy and multinomial logistic regression classifiers. Aggregation of drug NER techniques, dependent on gold-standard annotations, dictionary knowledge and patterns, enhanced the performance on models that are trained on gold-standard annotations, solely, accomplishing a maximum F-Score of 95%.
Song et al.,[12] introduced PKDE4J, an extensive text mining system, which combines dictionary-based entity extraction and rule-based relation extraction in a largely flexible and adaptable framework. Beginning with the Stanford CoreNLP, the system was developed in order to cope up with diverse kinds of entities and relations. Also, the system offers reasonably good performance with regard to accuracy in addition to the ability of configuring the text processing elements. Its comparative performance is demonstrated by assessing it over several corpora and it was observed that it is much superior compared to the other existing systems giving average F-measures of 85% for entity extraction and 81% for relation extraction.
A statistical similarity measurement concept is proposed as pattern matching function by Tohidi et al.,[13]. This method is on the basis of an assumption made that a named entity is identified among a noun set that is captured employing the Brill Part of Speech Tagger. The competitiveness of this new technique for identifying biomedical named entity is dependent on a Statistical Character-Based Syntax Similarity(SCSS) algorithm that measures similarity between all the candidates extracted and the popular biomedical named entities obtained from a corpus. In this work, the GENIA V3.0 corpus, the biggest annotated corpus in the molecular and biology domain has been used. The newly introduced technique is assessed depending on two measures: recall and precision that are useful in calculating a balance F-test. The pattern matching function has been compared with the other techniques and the result is satisfactory with the precision being 98.5% and recall being 96.4%.
©IJRASET (UGC Approved Journal): All Rights are Reserved
III. PROPOSED METHODOLOGY
This section discusses about the newly proposed NER with RVM based gene disease relation detection. The step by step procedure of the proposed approach has been presented in the section given below.
A. System overview
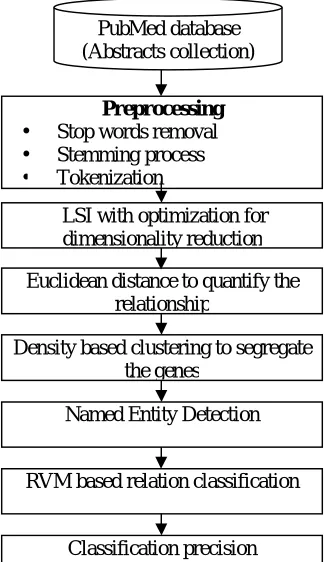
[image:5.612.225.387.231.512.2]The approach of overall process is presented and shown in Fig. 1. In this new system, first, the abstracts are collected and thereafter preprocessed. In order to enhance the precision, the dimensionality reduction of document-by-term data is carried out. Afterwards, to enhance the relation prediction precision among genes, the Euclidean distance is computed. In order to minimize the error rate, the clustering is introduced in this system. Density based clustering algorithm is used on the distance matrix of entities to separate them into various partitions. At last, NER is carried out in the first phase and relation extraction is carried out in the second phase by making use of RVM.
Fig. 1 Overall process of proposed rule based NER with RVM classification
B. Data pre-processing
Preprocessing is most essential task in Text mining and also responsible for the transformation of unstructured data into structured format. First, the relevant abstracts are retrieved from PubMed and used as input for the presented technique. The unstructured raw input is preprocessed to make the further mining process easier. Preprocessing task is mainly done with three major steps which consists of :
1) Stop words removal: This is the first step involved in the preprocessing phase, where stop words removal step just filter out the necessary words against a Stop word list so as to remove the words that are considered to be insignificant for the user’s views and features of a product. The important reason behind the removal of stop words is to protect the system resources by removing those terms containing small value for the mining performance. The general words, which are considered as stop words have the function word sets and more(ie. Articles, conjunctions etc.,). Generally, approximately 400-500 stop words are utilized in English language. The stop words such as ‘a’,’an’,’have’ ,’that’ the’, was’, etc., are eliminated[15].
2)Stemming process: The technique of getting root words from the resultant words from the stop word elimination process is referred to as stemming. Stated otherwise, Stemming involves the task of removal of the morphological and in-flexional ending
PubMed database (Abstracts collection)
Preprocessing
• Stop words removal
• Stemming process
• Tokenization
LSI with optimization for dimensionality reduction
Euclidean distance to quantify the relationship
Density based clustering to segregate the genes
Named Entity Detection
RVM based relation classification
©IJRASET (UGC Approved Journal): All Rights are Reserved
words. The words are modified into their stems by means of the Stemming process[16]. The hypothesis beneath stemming is that the words with similar stem or word root will describe the same or considerably proximate concepts in text and hence the words may be integrated with the help of stems. For example, the words such as ‘user’,’users’,’used’,’using’ all may stem to the word “use”.
3)Tokenization: The data after removing stop words and stemming is taken as input to the Tokenizer. With the NER as a sequential labeling issue, the optimal decision taken by the NER system is dependent on the labels of tokens in the complete sentence[17]. Therefore, the global context that surrounds a candidate term is an essential factor that has to be taken into consideration. For this purpose, the semantic type information in the context of a candidate term was created as a feature by conducting a matching of the concept terms in UMLS.
C. Latent Semantic Indexing with optimization-based dimensionality reduction
The preprocessed data is processed by means of LSI with the help of optimization technique to minimize the number of term features. On one hand, the information described on huge number of terms is mapped onto a lesser number of latent factors such that the unnecessary information is decreased. During this process, the Singular Value Decomposition free based LSI is introduced for the generation of predictions in this system that, in turn, is an extreme influence over the speed and reduces the memory usage, rendering it to be more effective means of enhancing performance and Particle Swarm Optimization(PSO) algorithm in order to resourcefully get the number of decreased dimensions and generate the optimal low dimensional representation of data space. This way, it maximizes the search coverage and enhances the performance of generation of predictions. Even though the PSO algorithm is a potential optimization strategy, it is not used in such a problem earlier. The fundamental principle of PSO is studied in [18].Here, PSO is used over SVD-free LSI method for getting the optimal number of decreased dimensions. Hence, the optimal low-dimensional representation of the actual data will be generated. It is also used on SVD free LSI based recommendation algorithm for generating quicker and more accurate recommendations predictions for the improvement of the relation classification precision. The entire SVD decomposition is an operation that consumes much memory and time, particularly for big problems. Therefore, the recommendations prediction process can be powered very efficiently if the time consuming Singular Value Decomposition of LSI is substituted by the partial symmetric Eigen problem that can be resolved by making use of quick iterative solvers. This improvement focuses on how the matrices S and V are expressed without the complete SVD decomposition. Supposing the popular association
between the SVD of the matrix A and the symmetric Eigenproblem of the symmetric square matrices :
= (1)
( ) = (2)
= ( ) = (3)
Where A indicates the × ratings matrix, ∈ × is adiagonal matrix with nonnegative diagonal elements calledthe singular
values, ∈ ×
and ∈ ×
areorthogonal matrices. The columns of matrices and areknown as the left singular vectors and the right singular vectors, respectively. The decomposition can be computed such that the singular values are sorted in decreasing sequence.
Since the fact that the matrix V is orthogonal, the following matrix identity is true:
= (4)
At last, the matrix U can be expressed in the following manner:
≈ (5)
\Where, denotes the Moore--Penrose pseudoinverse(pinv).Evaluating the LSI procedure keenly, it can be seen that the matrix U
©IJRASET (UGC Approved Journal): All Rights are Reserved D. Feature dimensionality reduction
Using the SVD-free latent semantic indexing to recommendations (i.e. accurate data) prediction algorithm includes the following steps
1) Create the data matrix D.
2) Eliminate the sparsity by filling in the data matrix. This process is carried out for every entity.
3) Normalize the formulated data matrix and obtain .
Factor the matrix and get a low-rank approximation according to the following procedure:
a) Factor employing SVD-free LSI to obtain U, S and V.
b) Decrease the size of the matrix S to dimension k.
c) Calculate the square-root of the reduced matrix to get
d) Calculate two resultant matrices: and ′
Generate the prediction by computing the dot product of the ℎ row of and Pth column of ′, and then denormalize the
output. The optimal selection of the number of minimized dimensions k is essential to the generation of high quality prediction. While using SVD-free LSI, a value of k, which is sufficiently large to acquire all the significant structures in the matrix yet adequately small to prevent over-fitting errors is generated. The hierarchy initialized PSO is used for the SVD-free LSI to get the optimal number of dimensions. The PSO is worked based on the modern heuristic search scheme. It is based on the population of particles (i.e. preprocessed data). In this algorithm, two optimization levels are carried out. In the first level, the search space is
divided into five groups, in every group; the particle position ( ) which is regarded to be the personal best value (pbest) achieving
the minimal prediction error is initialized. Afterwards, this value gets updated based on (6) and (7) till the optimal value (i.e. optimal
dimension data) is attained (gbest).The position and velocity vectors of the ℎparticle of a d- dimensional search space can be
represented as and respectively. On the basis of the objective function, the best position and velocity of each particle for fitness has been evaluated. The position and velocity equations are,
= + × × ( − )
+ × × ( − ) (6)
= +
(7)
Where w is the inertia weight, c1, c2 are cognitive and social coefficients, respectively, and rand1 , rand2 are random numbers
In accordance, in the second level, a swarm is built from all the earlier received global best values of all the partitions and the PSO algorithm is implemented again to obtain the best of the global best values. Depending on the above process, there is a reduction in the data dimensionality. Moreover, the gene disease entities obtained in our approach can also be integrated with biological data and this way, the discovery of disease related genes gets balanced between robustness and novelty.
Algorithm 1: PSO for dimensionality reduction
Input: data matrix D, Number of minimized dimensions k Output: optimal k value
Initialize the population randomly (i.e. preprocessed data) While (Population Size)
{ Loop
Calculate fitness (i.e. optimal dimensional value)
If fitness value is better from the best fitness value (pbest) in history then Update pbest with the new pbest
End loop
Select the particle with the best fitness value from all particles as gbest (i.e. optimal dimensionality data value) While maximum iterations or minimum error criteria is not attained
©IJRASET (UGC Approved Journal): All Rights are Reserved
For each particle
Calculate particle velocity by equation (6) Update particle position according to equation (7) Next
} }
E. Density based clustering
For qualifying the association between genes, the Euclidean distance measure has been employed. The distance value is employed for partitioning the genes depending on clustering for improving the entity relation classification. As stated, the gene-disease relation can be alternately examined by dividing the genes into different categories. The within-grouping and between-grouping of genes provide resourceful proof regarding their functions and processes in the biological end. Clustering analysis is termed as a elementary method for gaining this insight and it has been dependable to machine for an extensive range of applications, like microarray expression data analysis, protein interaction network analysis and several others. Clustering of disease relevant genes is owned by another paradigm rather than prioritization[19].It is assumed that the similarity of genes having relevance to the same disease(within-disease-cluster similarity) is greater compared to the similarity of genes having relevance to various diseases(between-disease-cluster similarity). Therefore, these genes are expected to show few “natural partitions” based on the kind of diseases. Here, the density based clustering algorithm is introduced. Two important steps included in this process are i)Splitting data into smaller region and ii)grouping the small regions to form final region(clustering)[20-22].Splitting data: Splitting is a procedure, where the gene dataset is initially divided into four parts. Segregating the gene dataset into two or three parts might not have pre-determined boundaries and therefore there can be overlapping of clusters. Therefore, it is started with the highest level ie., the entire gene data set and then splitting is started till the homogeneity criteria is not satisfied.
The steps for splitting comprises of
1) Divide the dataset into sub regions by indicating suppose mean point.
2) Compute the Euclidean distance between the main and every one of its probable child region.
( , ) = ( − + ( − +⋯+ ( − ) , (8)
Where = ( … . ), = … . are represented as two n-dimensional data points.
3) Split the region if the distance obtained is greater than threshold value otherwise stays unmodified.
4) By repeating the above process till all regions are obtained homogeneous or they are too small to be splitting.
5) Determine the value of threshold for splitting.
Threshold value should not be too high or too low to maintain good accuracy. Therefore, first select the median point and then divide the gene dataset. Then calculate the Euclidean distance between median and every sample of gene data set and sort the distances obtained.
The average of distances of all samples is considered to be the value of threshold.
6) DBSCAN Algorithm based clustering: DBSCAN requires two input parameters i.e. Eps(i.e. reachability distance) and MinPts (i.e. minimum no of points needed to create the clusters). The low value of Eps and MinPts will be started with and then it is increased slowly on the next iterations. The distance type utilized is Euclidean distance measure. After the clusters are formed, the disease relevant clusters are identified by the named entities recognition system. The DBSCAN algorithm is represented given below
7) Algorithm 2: DBSCAN clustering
a) Input: DBSCAN(D, eps, MinPts)
b) Output: cluster C
Divide the gene abstract dataset into sub regions. Compute the Euclidean distance between regions IF the distance obtained >threshold_value then
©IJRASET (UGC Approved Journal): All Rights are Reserved
d) Else
e) Region stays unmodified
Repeat the above process till all the regions are obtained homogeneous C = 0
for each unvisited point P in dataset D mark P as visited
NeighborPts = region Query(P, eps) if size of (NeighborPts) <MinPts mark P as NOISE
else
C = next cluster
Expand Cluster(P, NeighborPts, C, eps, MinPts) Expand Cluster(P, NeighborPts, C, eps, MinPts) add P to cluster C
for each point P' in NeighborPts if P' is not visited
mark P' as visited
NeighborPts' = regionQuery(P', eps) ifsizeof(NeighborPts') >= MinPts
NeighborPts = NeighborPts joined with NeighborPts' if P' is not yet member of any cluster
add P' to cluster C region Query(P, eps)
return all points within P's eps-neighborhood (including P)
F. Named Entity Recognition (NER)
NER iscarried in Message Understanding Conferences (MUC) for recognition and classification of persons, locations, organizations [24][23]. If used on biomedical domain, NER becomes more challenging compared to the general domains owing to its diverse naming conventions, spelling variants, abbreviation, and synonyms. Generally, the rule based method is used to extract these entities. The clustered outcome is taken as input to this NER to categorize genes associated to specific disease. The gene disease entities are categorized by making use of RVM classification. When compared with the SVM technique, the RVM consumes less training time.
G. RVM based classification
Given the training inputs (i.e. entity rules){x , t } , where x ∈R , t ∈{0,1} and n is the number of entity samples. The RVM
predicts for new inputs x depending on the SVM-like function; the model has the form of a linear combination of elementary
functions modified by means of a logistic sigmoid function,
y(x, w) =σ ωk(x , x) =σ(w K) (9)
Where k(x) = [k(x , x) … k(x , x)] refersto the kernel function vector, w = (ω …ω ) indicates the weight vector, and σ(a) is
the logistic sigmoid function defined by:
σ(a) = 1
1 + exp (−a)
(10)
©IJRASET (UGC Approved Journal): All Rights are Reserved
σ(−a) = 1−σ(a) (11)
Hence, RVM model can be utilized as the posterior probability. For the input x , the posterior probability of class c (i.e. correct
entities) can be expressed as:
p(t=1|x) =y(x,w) (12)
In a similar manner, the posterior probability of class c2(i.e. non-correct entities) can be expressed as:
p(t=0|x) =1−y(x,w) (13)
Since its model can be regarded to be the posterior probability, RVM follows a Bayesian probabilistic framework for training the model. The core feature of RVM is making use of the Automatic Relevance Determination (ARD) before over the weight vector w,
where there is a segregated hyper parameter αi for every one of the weight parametersωi. During the process of inference, several of
the hyper parameters are pushed to huge values, such that the respective weights are at last pushed to zero. This way, the respective
kernel functions can be removed out, leading to a sparse model. The inputs xiwith respect to the rest of the nonzero weights are
referred relevance vectors. The RVM decision model, for an input vectorx , as previously defined by Equation(9), can be rewritten
just on the basis of the wMP and RVs as follows
y(x,wMP) =σ ωik(xi ,x) +
xi∈RVS
ω0
(14)
As it can be observed in Equations (9) and (14), kernel function has a significant role to work in the RVM decision model. Here, the Elliptical Radial Basis Function (ERBF) is employed for kernel function.
(x,z) =exp (− (xi−zi)2/(σi2.r2) D
i 1
)
(15)
Where x and z are D-dimension feature vectors (i.e. = (x1, … ,xD)T,z= (z1, … ,zD)T ), r indicates the scale factor, σi2 variance.
Depending on the above process, the entities are categorized to be its belonging diseases.
IV. RESULTS AND DISCUSSION
This section presents the performance evaluation of the presented NER with RVM system. 250 abstracts related to Breast cancer and Adenocarcinoma diseases are collected from PubMed and integrated in our local database for better and efficient performance. In addition, the performance results of the introduced NER are then compared with already existing Random Forest (RF) algorithm and C4.5 with bagging techniques [24]in addition to the RVM classification results, which are compared with already available HMM and SVM algorithms. The performance results are assessed in terms of precision, recall and F-measure for both the entity detection and classification mechanisms. The approach is also tested on different corpora.
A. Performance metrics
1) Precision value: It is with respect to the document retrieved. This is computed by the total amount of relevant datasets segregated by the total number of resulting datasets.
Precision value = Truepositive
Truepositive falsepositive
(16)
2) Recall value: Recall value is defined to be the relevant datasets, which are related to the other request search.
Recall value = Truepositive
(Falsepositive FalseNegative)
(17)
©IJRASET (UGC Approved Journal): All Rights are Reserved
F measure = 2 X precisionprecision recallXrecall (18)
Where, a recognized entity mention was regarded to be a true-positive when its boundary and type has a match with those of a gold entity mention. An extracted relation type was incorrect, and the boundaries and types of its related entities have a match with those of the entities present in a corpus. A recognized entity or extracted relation was regarded to be false-positive when it was not match with the respective conditions stated above. The number of false-negative instances was calculated by counting over the entities , which had not been recognized by this model.
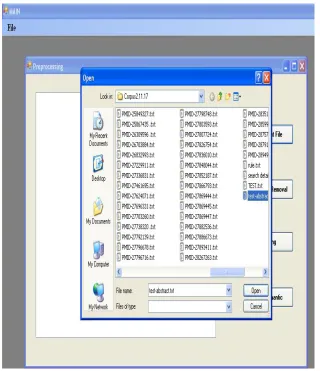
Fig. 3 shows the example of input data(PubMed abstract). Processing of this document directly for NER and relationship extraction becomes very difficult task, so some preprocessing methods are required to make the task in easy way.
[image:11.612.148.468.343.714.2]Approximately 5%–10% of breast cancers are due to genetic predisposition caused by germline mutations; the most commonly tested genes are BRCA1 and BRCA2 mutations. Some mutations are unique to one family and others are recurrent; the spectrum of BRCA1/BRCA2 mutations varies depending on the geographical origins, populations or ethnic groups. We have additionally conducted a literature review to include other Asian countries mainly in Central and Western Asia. We present the current pathogenic mutation spectrum of BRCA1/BRCA2 genes in patients with breast cancer in various Asian populations. Understanding BRCA1/BRCA2 mutations in Asians will help provide better risk assessment and clinical management of breast cancer.PMCID: PMC4681590
Fig. 2 PubMed Abstract( Example Abstract - Before preprocessing)
©IJRASET (UGC Approved Journal): All Rights are Reserved
The preprocessing step consists of two major steps such as stop word removal, and stemming is illustrated in Fig.4 and Fig.5.
Fig.4Tokenized and Stop words removed abstract
©IJRASET (UGC Approved Journal): All Rights are Reserved
Then for dimensionality reduction the document-term matrix formation is completed by using the preprocessed sample is illustrated in Fig.6.
Fig.6 Term frequency caluculation(used for dimensionality reduction)
Then clustering is performed to group similar genes information and illustrated in Fig.7.
Fig.7 Clustering output
©IJRASET (UGC Approved Journal): All Rights are Reserved
Fig. 8 Gene name recognition- output
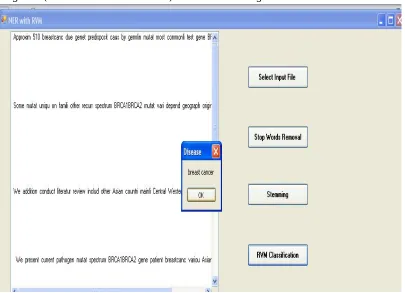
Named Entity Recognition (Disease name- Breast Cancer) result is shown in Fig. 9.
[image:14.612.107.512.415.708.2]©IJRASET (UGC Approved Journal): All Rights are Reserved
[image:15.612.132.483.104.387.2]Finally classification(Relationship between Gene and Disease) is performed and the result(BRCA1 and BRCA2 mutations cause Breast Cancer) is shown in Fig. 10.
Fig. 10 Gene- Disease relationship - output
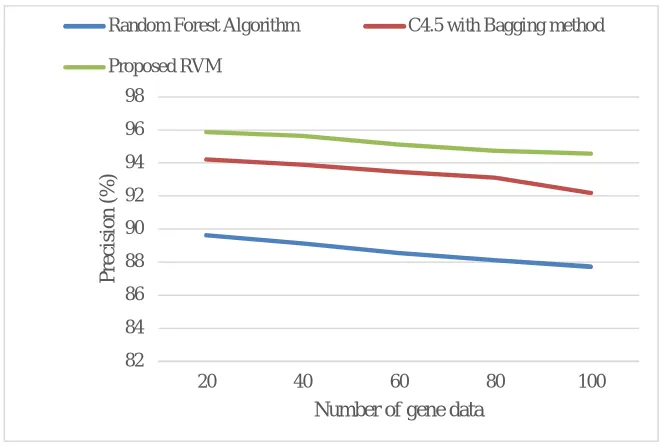
Fig.11 Precision performance comparison
It can be seen from Fig. 11, the precision rate of presented RVM systems hows a 6.84% and 2.37% increase compared to random forest algorithm and C4.5 with bagging algorithm. Owing to the specificity of high true positive rate, the new RVM system achieved high precision resultsin comparison with the rest of the algorithms.
82 84 86 88 90 92 94 96 98
20 40 60 80 100
P
re
ci
si
o
n
(%)
Number of gene data
Random Forest Algorithm C4.5 with Bagging method
[image:15.612.171.503.428.651.2]©IJRASET (UGC Approved Journal): All Rights are Reserved
Fig.12 Recall performance comparison
[image:16.612.164.449.327.496.2]It can be seen from Fig.12, the recall rate of RVM system is 6.25% and 2.69% increase compared to random forest algorithm and C4.5 with Bagging algorithm. Owing to the high precision value, the recall of presented approach achieved high recall, when compared to other available algorithms.
Fig.13 F-measure performance comparison
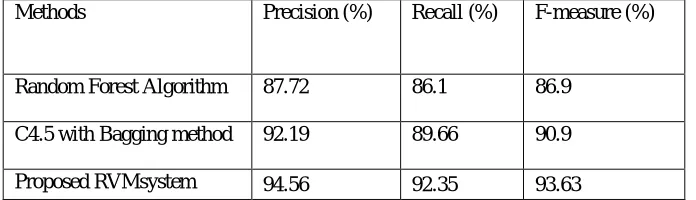
It can be observed from Fig.13 that the F-measure rate of RVM system shows6.73% and 2.73% increase compared to the random forest algorithm and C4.5 with bagging algorithm. Because of the effective precision and recall rate, the new RVM system achieved high F-measure result in comparison with the other algorithms. In the presented RVM system approach, three volume metric results are assessed for gene dataset and the prediction of their numerical assessment values are given in Table 1. It indicates that the results of the new RVM system are high, when compare to the existing Random Forest algorithm and C4.5 with bagging algorithm.
Table I: Numerical Values Of Performance Comparison Among Existing Systems
Methods Precision (%) Recall (%) F-measure (%)
Random Forest Algorithm 87.72 86.1 86.9
C4.5 with Bagging method 92.19 89.66 90.9
Proposed RVMsystem 94.56 92.35 93.63
80 82 84 86 88 90 92 94
20 40 60 80 100
R
ec
a
ll
(%)
Number of gene data
Random Forest Algorithm C4.5 with Bagging method
RVM 80 82 84 86 88 90 92 94 96
20 40 60 80 100
F -m ea sur e (%)
Number of gene data
Random Forest Algorithm C4.5 with Bagging method
[image:16.612.134.482.609.709.2]©IJRASET (UGC Approved Journal): All Rights are Reserved
Fig.14: Precision performance comparison among existing classification schemes
It can be seen from Fig.14, that the precision rate of RVMshows a 5.03% and 2.1% increase compared to HMM and SVM. Due to the specificity of high true positive rate, the new presented RVM attained high precision result in comparison with other algorithms. Less amount of training time of RVM has increased the prediction accuracy by the classification of more number of entities with low error rate.
Fig.15 Recall performance comparison among existing classification schemes
From Fig.15, it can be seen that the recall rate of RVM shows 5.17% and 2.33% increase compared to HMM and SVM. Owing to high precision value, the recall of the new proposed scheme attained high in comparison with the other two existing algorithms.
84 86 88 90 92 94 96
20 40 60 80 100
P
re
ci
si
o
n
(%)
Number of entities
HMM SVM proposed RVM
82 84 86 88 90 92 94 96
20 40 60 80 100
R
ec
a
ll
(%)
Number of entities
©IJRASET (UGC Approved Journal): All Rights are Reserved
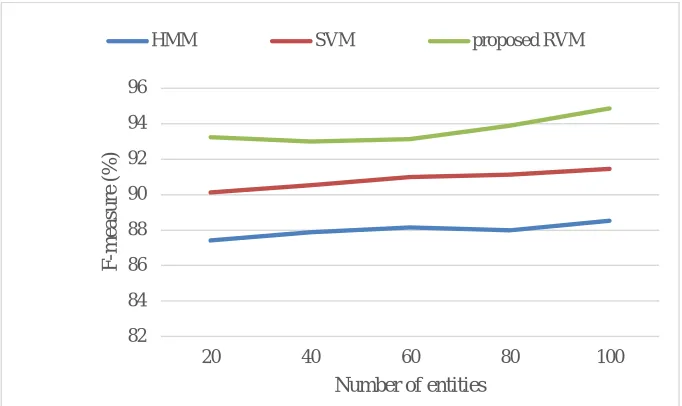
Fig.16F-measure performance comparison among existing classification schemes
It can be seen from Fig.16, the F-measure rate of RVM shows a 6.33% and 3.4% increase compared to HMM and SVM. Due to the efficient precision and recall rate, the new RVMmethod achieved high F-measure result compared with the other available algorithms. In the novel RVM approach, three volume metric results are assessed for PubMed dataset and the prediction of their numerical evaluation values are tabulated in Table 2. It indicates that the performance results of the new RVM are high in comparison with the existing methods SVM and HMM.
Table Ii: Numerical Values Of Overall Performance For Existing Classification Schemes
Methods Precision (%) Recall (%) F-measure (%)
HMM 89.63 87.41 88.52
SVM 92.56 90.25 91.45
Proposed RVM 94.66 92.58 94.85
V.CONCLUSION
In this research paper, to recognize named entities and extract relationship between those entities RVM classification is introduced. It contains five phases including preprocessing, dimensionality reduction, clustering, a NER and classification using RVM. First, the abstracts are collected from PubMed database, then preprocessed by three means such as Stop words removal, Stemming process and Tokenization. Secondly, the dimensionality reduction of individual data source has been combined in the data fusion framework. In order to deal with the very high dimensionality of text mining data, LSI with optimization approach, a well-known reduction method in information retrieval, over document-by-term profiles is applied. Third, density based clustering mechanism is introduced to segregate the same gene disease and diverse gene disease data making use of splitting and distance measures. After wards, the RVM principles are employed for the identification of named entities. The different biological Named Entities have diverse spelling forms and abbreviation for specific named entity class that are connected in the right way. At last, the disease classification is done from Named entities by making use of RVM approach. The results obtained from experiments indicate that the presented RVM NER approach achieved better performance in terms of precision of 94.56% , recall of 92.35% and F-measure of 93.63% in comparison with the other available Random Forest algorithm and C4.5 with bagging techniques.Furthermore, the new RVM disease classification scheme achieved better performance in terms of precision of 94.66%, recall of 92.58% and F measure of 94.85% in comparison with the other available SVM and HMM algorithms, owing to the efficient dimensionality reduction and clustering. As future work, it has been planned to have the extracted entities normalized. Then, a good means of representing named entities and disease classification is to be found .
82 84 86 88 90 92 94 96
20 40 60 80 100
F
-m
ea
sur
e
(%)
Number of entities
[image:18.612.131.482.398.484.2]©IJRASET (UGC Approved Journal): All Rights are Reserved
REFERENCES
[1] Yu, S., Tranchevent, L. C., De Moor, B., & Moreau, Y. (2010). Gene prioritization and clustering by multi-view text mining. BMC bioinformatics, 11(1), 28. [2] J. K. Jong and C. Park, “Named entity recognition,” in Text Mining for Biology and Biomedicine, J. McNaught, Ed. 2006.
[3] J. L. O. D. Campos and S. Matos, “Biomedical named entity recognition: A survey of machine-learning tools,” in Theory and Applications for Advanced Text Mining, S. Sakurai, Ed. InTech, 2012.
[4] G. D. Zhou, “Recognizing names in biomedical texts using mutual information independence model and SVM plus sigmoid.,” Int. J.Med. Inform., vol. 75, no. 6, pp. 456–67, Jun. 2006.
[5] S. Jonnalagadda, T. Cohen, S. Wu, H. Liu, G. Gonzalez, J. Siddhartha,C. Trevor, W. Stephen, H. F. Liu, and G. Graciela, “Using empirically constructed lexical resources for named entity recognition,” Biomed. Inform. Insights, vol. 6, no. Suppl. 1, pp. 17–27, Jan. 2013.
[6] A. McCallum, D. Freitag, and F. C. N. Pereira, “Maximum entropy Markov models for information extraction and segmentation,” pp.591–598, Jun. 2000. [7] Eftimov, T., Seljak, B. K., &Korošec, P. (2017). A rule-based named-entity recognition method for knowledge extraction of evidence-based dietary
recommendations. PloS one, 12(6), e0179488.
[8] Habibi, M., Weber, L., Neves, M., Wiegandt, D. L., &Leser, U. (2017). Deep learning with word embeddings improves biomedical named entity recognition. Bioinformatics, 33(14), i37-i48.
[9] Xu, D., Zhang, M., Xie, Y., Wang, F., Chen, M., Zhu, K. Q., & Wei, J. (2016). DTMiner: identification of potential disease targets through biomedical literature mining. Bioinformatics, 32(23), 3619-3626.
[10] Bhasuran, B., Murugesan, G., Abdulkadhar, S., &Natarajan, J. (2016). Stacked ensemble combined with fuzzy matching for biomedical named entity recognition of diseases. Journal of biomedical informatics, 64, 1-9.
[11] Korkontzelos, I., Piliouras, D., Dowsey, A. W., &Ananiadou, S. (2015). Boosting drug named entity recognition using an aggregate classifier. Artificial intelligence in medicine, Elsevier, 65(2), 145-153.
[12] Song, M., Kim, W. C., Lee, D., Heo, G. E., & Kang, K. Y. (2015). PKDE4J: Entity and relation extraction for public knowledge discovery. Journal of biomedical informatics, 57, 320-332.
[13] Tohidi, H., Ibrahim, H., &Murad, M. A. A. (2014). Improving named entity recognition accuracy for gene and protein in biomedical text literature. International journal of data mining and bioinformatics, 10(3), 239-268.
[14] Huang, Z., & Hu, X. (2013). Disease Named Entity Recognition by Machine Learning Using Semantic Type of Metathesaurus. International Journal of Machine Learning and Computing, 3(6), 494.
[15] Munkova.D.,Munk . M and Vozar.M, 2014, “Influence of stop-words removal on sequence patterns identification within comparable corpora, In ICT Innovations 2013,pp.67-76.
[16] Korenius.T ,Laurikkala,J., Jarvelin,K and Juhola,M, 2004, November,”Stemming and lemmatization in the clustering of finish text documents”, In proceedings of the thirteenth ACM international conference on Information and knowledge management, pp.625-633.
[17] Kao,A and Poteet,S.R, eds.,2007,”Natural language processing and text mining”, Springer Science and Business Media.
[18] Zheng, Y. L., Ma, L. H., Zhang, L. Y., &Qian, J. X. (2003). A unified particle swarm optimization scheme. In Proc. of the IEEE Int. Conf. of Computational Methods in Sciences and Engineering (pp. 221-226).
[19] J. H. Peter, A. Antonysamy, An optimized Density based Clustering Algorithm, International Journal of Computer Applications, Vol. 6, September 2010 [20] A. Moreira, M. Y. Santos and S. Carneiro, Density-based clustering algorithms-DBSCAN and SNN, July 2005
[21] M. Rehman and S. A. Mehdi, Comparision of Density-Based Clustering Algorithms, 2005
[22] LeventErtoz, Michael Steinback, Vipin Kumar, Finding Clusters of Different Sizes, Shapes, and Density in Noisy, High Dimensional Data, Second SIAM International Conference on Data Mining, San Francisco, CA, USA, 2003
[23] Grishman R, Sundheim B (1996) Message Understanding Conference-6. Proc. 16th Conf. Comput.Linguist. -. Association for Computational Linguistics, Morristown, NJ, USA, p 466.