Severe diabetes, age-dependent loss of adipose
tissue, and mild growth deficiency in mice
lacking Akt2/PKB
bb
Robert S. Garofalo, … , John D. McNeish, Kevin G. Coleman
J Clin Invest.
2003;
112(2)
:197-208.
https://doi.org/10.1172/JCI16885
.
The serine/threonine kinase Akt/PKB plays key roles in the regulation of cell growth,
survival, and metabolism. It remains unclear, however, whether the functions of individual
Akt/PKB isoforms are distinct. To investigate the function of Akt2/PKB
b
, mice lacking this
isoform were generated. Both male and female Akt2/PKB
b
-null mice exhibit mild growth
deficiency and an age-dependent loss of adipose tissue or lipoatrophy, with all observed
adipose depots dramatically reduced by 22 weeks of age. Akt2/PKB
b
-deficient mice are
insulin resistant with elevated plasma triglycerides. In addition, Akt2/PKB
b
-deficient mice
exhibit fed and fasting hyperglycemia, hyperinsulinemia, glucose intolerance, and impaired
muscle glucose uptake. In males, insulin resistance progresses to a severe form of diabetes
accompanied by pancreatic
b
cell failure. In contrast, female Akt2/PKB
b
-deficient mice
remain mildly hyperglycemic and hyperinsulinemic until at least one year of age. Thus,
Akt2/PKB
b
-deficient mice exhibit growth deficiency similar to that reported previously for
mice lacking Akt1/PKB
a
, indicating that both Akt2/PKB
b
and Akt1/PKB
a
participate in the
regulation of growth. The marked hyperglycemia and loss of pancreatic
b
cells and adipose
tissue in Akt2/PKB
b
-deficient mice suggest that Akt2/PKB
b
plays critical roles in glucose
metabolism and the development or maintenance of proper adipose tissue and islet mass
for which other Akt/PKB isoforms are unable to fully compensate.
Article
Metabolism
Find the latest version:
Introduction
The serine/threonine kinase Akt/PKB was first identi-fied as an oncogene and as a kinase with properties resembling both PKA and PKC (hence PKB) (1, 2). There are three mammalian isoforms of this enzyme: Akt1 (PKBα), Akt2 (PKBβ), and Akt3 (PKBγ). Akt1 shares 81% and 83% amino acid identity with Akt2 and Akt3, respectively. Although the three isoforms show broad tissue distribution (3), Akt1 is the most ubiqui-tously expressed. Akt2 is expressed at a lower level than Akt1 except in insulin-responsive tissues where it pre-dominates (4, 5). Akt3 is expressed at the lowest level
except in testes and brain (6, 7). Preliminary analysis of the Akt1, Akt2, and Akt3 gene products suggest that the three isoforms have similar biochemical char-acteristics (8) and that phosphorylation of two sites is necessary for full activation of each isoform (9). Translocation of Akt to the plasma membrane through its pleckstrin homology domain is likely required for its activity (10), and constitutive targeting of Akt to the plasma membrane is sufficient to pro-mote its activation (11, 12). Both the upstream acti-vating kinases and the recruitment of Akt to the plas-ma membrane are dependent upon the products of PI3K (13). Some evidence suggests, however, that Akt isoforms are differentially activated in different insulin-responsive tissues following insulin stimula-tion (14). In particular, Akt2 is more abundant and more highly activated than Akt1 in adipocytes (14).
Akt is activated in response to many different growth factors, including insulin and IGF-1 (9). Akt is impor-tant for mediating the effects of these growth factors on the control of mammalian cell cycle progression and cell survival, as well as on the regulation of processes that influence growth, including protein syn-thesis and glucose metabolism. Akt regulates cell size in species as divergent as Drosophila(15) and mice (16, 17), indicating that its growth regulatory function is broadly conserved. Both the expression and transloca-tion of glucose transporters in insulin-responsive cells (18, 19), as well as the activation of glycogen synthesis
Severe diabetes, age-dependent loss of adipose tissue,
and mild growth deficiency in mice lacking Akt2/PKBβ
Robert S. Garofalo, Stephen J. Orena, Kristina Rafidi, Anthony J. Torchia, Jeffrey L. Stock,
Audrey L. Hildebrandt, Timothy Coskran, Shawn C. Black, Dominique J. Brees,
Joan R. Wicks, John D. McNeish, and Kevin G. Coleman
Pfizer Global Research and Development, Groton, Connecticut, USA
The serine/threonine kinase Akt/PKB plays key roles in the regulation of cell growth, survival, and metabolism. It remains unclear, however, whether the functions of individual Akt/PKB isoforms are distinct. To investigate the function of Akt2/PKBβ, mice lacking this isoform were generated. Both male and female Akt2/PKBβ-null mice exhibit mild growth deficiency and an age-dependent loss of adipose tissue or lipoatrophy, with all observed adipose depots dramatically reduced by 22 weeks of age. Akt2/PKBβ-deficient mice are insulin resistant with elevated plasma triglycerides. In addition, Akt2/PKBβ-deficient mice exhibit fed and fasting hyperglycemia, hyperinsulinemia, glu-cose intolerance, and impaired muscle gluglu-cose uptake. In males, insulin resistance progresses to a severe form of diabetes accompanied by pancreatic βcell failure. In contrast, female Akt2/PKBβ -deficient mice remain mildly hyperglycemic and hyperinsulinemic until at least one year of age. Thus, Akt2/PKBβ-deficient mice exhibit growth deficiency similar to that reported previously for mice lacking Akt1/PKBα, indicating that both Akt2/PKBβand Akt1/PKBαparticipate in the regu-lation of growth. The marked hyperglycemia and loss of pancreatic βcells and adipose tissue in Akt2/PKBβ-deficient mice suggest that Akt2/PKBβplays critical roles in glucose metabolism and the development or maintenance of proper adipose tissue and islet mass for which other Akt/PKB isoforms are unable to fully compensate.
This article was published online in advance of the print edition. The date of publication is available from the JCI website, http://www.jci.org. J. Clin. Invest.112:197–208 (2003). doi:10.1172/JCI200316885.
Received for publication September 11, 2002, and accepted in revised form May 6, 2003.
Address correspondence to:Robert S. Garofalo, Pfizer Global Research and Development, MS 8220-3082, Eastern Point Road, Groton, Connecticut 06357, USA.
Phone: (860) 441-1055; Fax: (860) 441-0548; E-mail: [email protected].
Joan R. Wicks’ present address is: Pathology Associates, Frederick, Maryland, USA.
Conflict of interest:The authors have declared that no conflict of interest exists.
Nonstandard abbreviations used:computed tomography (CT); glucose 6-phosphatase (G6Pase); phosphoenolpyruvate carboxykinase (PEPCK); glycogen synthase (GS); GS homogenization buffer (HB); absence of reverse transcriptase (minus RT); G6P-independent synthase activity (GSi); knockout
via inhibition of glycogen synthase kinase-3 (20, 21), are regulated by Akt. Thus, Akt plays a key role in the coordinated regulation of growth and metabolism by the insulin/IGF–signaling pathway. This close coordi-nation reflects the well-conserved role of this pathway in modulating growth in response to environmental changes in nutrient availability (22).
Targeted disruption of individual Akt genes is being used to dissect the functions of Akt isoforms. Recently, analysis of mice lacking the genes encoding either Akt1 or Akt2 has suggested nonredundant functions for the two genes. Both Akt1-null and Akt2-null mice are viable, but Akt1-deficient mice exhibit a growth defi-ciency and normal glucose metabolism (23, 24), where-as Akt2-deficient mice exhibit insulin resistance and mild diabetes with no apparent difference in size (25). The viability and relative subtlety of these phenotypes suggest, however, that for many functions the three Akt isoforms are able to compensate for each other.
The data presented here on another line of Akt2-defi-cient mice confirm the major role of Akt2 in the regu-lation of glucose metabolism. The severe lipoatrophy or decrease in adipose tissue (26) in these Akt2-defi-cient mice, however, suggests an additional critical function for Akt2 in the development or maintenance of proper adipose tissue mass. Lipoatrophy is associat-ed with severe insulin resistance and diabetes (26) and might contribute to the observed diabetic phenotype of these mice. Furthermore, unlike the previously described Akt2-null mice (25), a compensatory increase in pancreatic islet mass and number is not observed, and a large percentage of male Akt2-null mice progress to a severe form of diabetes that includes βcell failure by 5–8 months of age. In addition, in contrast to a pre-vious report (25), the Akt2-null mice described here exhibit a mild growth deficiency that persists through-out life. These data suggest that both Akt1 and Akt2 participate in the regulation of normal growth.
Methods
Construction of Akt2 targeting vector and Akt2–/–animal
generation. Mouse genomic clones containing the Akt2
locus were isolated from a DBA/1lacJ genomic λ-phage library (Stratagene, La Jolla, California, USA) using a murine Akt2 partial cDNA fragment as a probe. A 6.3-kb 5′fragment and a 2-kb 3′fragment were cloned into pJNS2, a plasmid containing neo and PGK-TK cassettes. The Akt2 targeting vector was designed to replace 3.4-kb of the genomic locus with the PGK-neo cassette. Three exons corresponding to bp 788–1047 of the murine cDNA (U22445) are located within this 3.4-kb knockout region. DBA/1lacJ ES cells were grown and transfected using protocols described previously (27). ES cell clones having undergone homologous recombination with the targeting vector were identified using a 1.0-kb BamHI/XbaI 3′probe located external to the targeting vector. Targeted ES cells were microinjected into C57BL/6 blastocysts using established techniques (28). Male chimeras were
backcrossed to DBA/1lacJ females, and germline off-spring were genotyped for the presence of a targeted
Akt2allele by PCR using genomic DNA isolated from tail biopsies. This method of germline transmission does not compromise the genetic background of the inbred strain (27). Brown coat color was used to iden-tify germline offspring that are 100% DBA/1lacJ inbred genetic background. Akt2+/–animals were
inter-crossed, and offspring were genotyped using a two-reaction PCR method. One two-reaction amplifies a 190-bp fragment from a targeted allele using primers neo-833F (5′GCAGGATCTCCTGTCATCTCACC3′) and neo-1023R (5′GATGCTCTTCGTCCAGATCATCC3′). The sec-ond reaction amplifies a 359-bp fragment from an endogenous allele using primers Akt2KO-178F (5′
GAGGTAGAAACAAGAGAATCATGG 3′) and Akt2KO-537R (5′GTTCGCACTGCTGTATGTTGC3′), contained within the 3.4-kb knockout region. Notably, there are no reports of diabetes or obesity linked to the DBA/1lacJ strain, whereas the DBA/2 and related C57BL/KsJ strains (29) exhibit a genetic predisposi-tion to βcell failure that is evident when the obor db
mutations are crossed onto these backgrounds (30, 31). The genetic differences between the DBA/2 and DBA/1 strains, however, are large enough that they should be regarded as different strains rather than substrains of the same strain (32). Thus the lace of a significant genetic relationship between the two DBA strains suggests that the phenotype observed in the DBA/1lacJ Akt2–null mice described here is unrelated to that observed in the DBA/2 strain.
Protein analysis. Whole Akt+/+and Akt–/–brains were
homogenized in 10 vol homogenization buffer (50 mM Tris, pH 8.0, 10 mM β-glycerophosphate, 5 mM EGTA, 50 mM NaCl, 10 mM DTT, 1 µM microcystin, 1 mM NaVO4, 1 mM benzamidine, 1×Calbiochem protease inhibitor cocktail). The tissues were disrupted using a polytron, and cell debris was cleared by centrifugation at 17,000 g(10 minutes at 4°C). Supernatants were recovered and protein concentration was determined by Bradford assay. Twenty-five micrograms of protein extract was analyzed by SDS-PAGE using a 4–12% NuPage gel in 1×Mops SDS running buffer (NP0050; Invitrogen Corp., San Diego, California, USA). Western blot analysis was performed according to manufactur-er’s instructions using Akt1 (no. 06-558) and anti-Akt2 (no. 06-606) Ab’s from Upstate Biotechnology Inc. (Lake Placid, New York, USA).
0.025% heparin in normal saline on ice. Red cells were pelleted by centrifugation at top speed in a Beckman Microfuge 12 for 2 minutes. Glucose was determined in the supernatants using the Roche/Hitachi 912 clin-ical chemistry analyzer (Roche Diagnostics Corp, Indi-anapolis, Indiana, USA).
Plasma insulin measurements. Insulin was measured in whole plasma or in samples prepared for glucose meas-urements (described above) by radioimmunoassay using the rat insulin RIA kit (RI-13K) or the sensitive rat insulin RIA kit (SRI-13K; Linco Research Inc., St. Charles, Missouri, USA).
Morphometric analysis of the pancreatic islets and adipose tissue. Pancreatic tissues and epididymal fat pads were fixed in formalin and embedded in paraffin, and sec-tions were stained by hematoxylin and eosin. For pan-creatic islets in each animal, the area of the whole sec-tion of pancreas and of 12 randomly selected islets in that section were measured using Image-Pro Plus image analysis software. The total numbers of islets per section were manually counted. The percentage of the surface area occupied by the islets compared with the total area of the pancreas section was calculated using the following formula: mean islet area ×total number of islets ×100/total area of the section. The mean number of islets per section of pancreas was cal-culated using the following formula: number of islets
×106per total area of the section. Data were analyzed using a three-factor ANOVA. The main categories were treatment group (control versus knockout), sex, and week of sacrifice (7 or 24 weeks). The model included the three two-way and the three-way interaction terms. Because the 24-week-old male islet area data had an appreciably smaller SD than all other factor combina-tions, the analysis was repeated using the log transfor-mation. For adipose tissue, morphometric analysis was performed using Image-Pro analysis software. The number of adipocytes was determined in six random-ly selected areas from the epididymal fat pads from 9-week-old (n= 3 control; n= 6 Akt2 null) and 11.7-week-old (n= 5 control; n= 5 Akt2 null) male mice.
Insulin and caspase-3 immunohistochemistry. Formalin-fixed paraffin-embedded sections of pancreas were deparaffinized, rehydrated, and incubated with 3% hydrogen peroxide for 10 minutes in order to quench endogenous peroxidase activity. The sections were blocked with DAKO protein block (X0909; DAKO Corp., Carpinteria, California, USA) for 20 minutes. Each of the steps following the application of the pri-mary Ab were preceded by a rinse in BioGenex wash buffer (HK583-5K; BioGenex Laboratories, San Ramon, California, USA). For insulin staining, the sections were then incubated with a guinea pig anti-insulin IgG (A0564; DAKO Corp.) diluted 1:1,000 for 1 hour at room temperature. For caspase-3 staining, the sections were incubated with a rabbit IgG (Cell Signalling Tech-nology, Beverly, Massachusetts, USA) anti-cleaved cas-pase-3 (Asp175 clone) diluted 1:150 for 1 hour at room temperature. The anti-insulin primary Ab was followed
by a 45-minute incubation with a biotin-labeled goat anti–guinea pig IgG diluted at 1:150 (BA-7000; Vector Laboratories, Burlingame, California, USA). The anti– caspase-3 primary Ab was followed by a 45-minute incu-bation with a biotin-labeled goat anti-rabbit IgG dilut-ed at 1:150 (Vector Laboratories). Finally, the sections were incubated with the Elite ABC Kit (PK-6100; Vector Laboratories) for 30 minutes, stained with a DAKO li-quid 3,3-diaminobenzidine (K3468; DAKO Corp.) for 5 minutes according to the manufacturer’s instructions, and counterstained with hematoxylin.
Micro–computed tomography scanning. Images were obtained using a commercially available micro–com-puted tomography (micro-CT) system (MicroCAT; ImTek Inc., Knoxville, Tennessee, USA) with a high-res-olution charge coupled device/phosphor screen detec-tor. The scanner consisted of a cylindrical-diameter/ long-field view of 50 mm by 50 mm with a spatial res-olution of less than 50 µm. The x-ray source was biased at 40 keV with the anode current set to 400 µA. Anes-thetized mice were placed on a radio-transparent mouse bed in a supine position, caudal end closest to the micro-CT with the rostral end held in place against an anesthesia delivery tube. The hind legs were moder-ately extended and held in place with clear tape to ensure that a correct anatomical position was achieved (i.e., straight spine) and that the mouse position did not change once the scan procedure was initiated. An initial radiographic image was acquired at 90 degrees to the plane of the mouse bed to allow correct posi-tioning of the mouse by centering the scan acquisition area at the level of the iliac crest of each mouse.
Image reconstruction and analysis. Image reconstruction, whereby a micro-CT scan of an individual mouse was manipulated to produce two-dimensional cross-sec-tional images, was performed using reconstruction/ visualization software of the MicroCAT instrument (ImTek Inc.). Two sets of reconstructed images per scan were generated for each mouse for the determination of individual fat depot mass. User-defined placement of reconstruction slices was relative to defined anatom-ical sites (i.e., vertebral segments) (33). The first set of reconstructed images, consisting of six slices (interver-tebral segments lumbar 6 and 7 through sacral 4 to caudal 1), provided a montage for the analysis of inguinal and epididymal adipose tissue depots. The second reconstruction set, consisting of nine slices (intervertebral and midvertebral landmarks from lum-bar 2 and 3 through lumlum-bar 6 and 7) was used to define retroperitoneal and mesenteric adipose tissue depot masses. Reconstructed bitmap images were converted to tagged image file format images and subsequently analyzed for fat depot mass using Scion Image for Win-dows (Scion Corp., Frederick, Maryland, USA).
prepared from total RNA using Superscript II reverse transcriptase (Invitrogen Corp., Carlsbad, California, USA). Control reactions were run in the absence of reverse transcriptase (minus RT). Expression of liver glucose 6-phosphatase (G6Pase) and phospho-enolpyruvate carboxykinase (PEPCK) genes was quan-titated by real-time quantitative PCR (TaqMan; Applied Biosystems Inc., Foster City, California, USA) and normalized to 18S rRNA. Minus RT reactions were also amplified in order to confirm that product was not contributed by contaminating genomic DNA. Taq-Man PCR was performed by adding 25 µl 2×PCR Mas-ter Mix (Applied Biosystems Inc.), 5 µl of 2.5 µM probe (see below), 0.5 µl each of 30 µM forward and reverse primers (see below), and 14 µl water to each well of a 96-well plate containing 1 ng of cDNA in a 5-µl volume (final volume 50 µl). Amplification was performed on a 7700 Sequence Detection System (Applied Biosys-tems Inc.) according to a preset protocol: 50°C for 2 minutes, 95°C for 10 minutes, followed by 40 cycles of 95°C for 15 seconds and 60°C for 1 minute. Data were analyzed using the 2–∆∆Ctmethod (34) that had been previously validated to demonstrate equivalent ampli-fication efficiencies of the target genes G6P and PEPCK and the reference gene 18S rRNA (data not shown). Probes were custom made by Applied Biosystems Inc.: G6P, 6FAM-AGTCCCTCTGGCCATGCCATGG-TAMRA; PEPCK, 6FAM-AGGGCAAGATCATCATGCACGACCC -TAMRA. The primers were made by Invitrogen Corp.: G6P forward, CACCTGTGAGACCGGACCA; G6P reverse,
GACCATAACATAGTATACAC-CTGCTGC; PEPCK forward,
GACCATAACATAGTATACACCTGCTGC; PEPCK reverse,
AGAAGGGTCGCATGGCAA. An 18S rRNA probe and primer kit was obtained from Applied Biosystems Inc.
Liver glycogen synthase activity. Liver samples were homogenized in 10 vol glycogen synthase (GS) homogenization buffer (HB; 10 mM TRIS-HCl, pH 7.4, 150 mM KF, 15 mM EDTA, 0.6 M sucrose, 1 mM PMSF, 1 mM benzamidine, 25 µg/ml leupeptin, and 50 mM β-mercaptoethanol) for 30 seconds on ice. Pro-tein concentration of homogenates was determined using Bradford Reagent (Bio-Rad, Hercules, Califor-nia, USA) and IgG as standards. GS activity was meas-ured according to the low/high G6P method (35). A total reaction volume of 90 µl contains 100 µM UDP-[U-14C]-glucose (∼4.5 µCi/µmol), 50 mM Tris-HCl, pH 7.8, 25 mM KF, 12.5 mM EDTA, 7 mg/ml rabbit liver glycogen. In addition, G6P is used at 10 mM to meas-ure total synthase activity (GSd+ GSi, where GSdis the G6P-dependent and GSiis the G6P-independent syn-thase activity) and at 0.1 mM to measure the GSi activ-ity. One hundred fifty micrograms of liver homo-genate protein is included in a 10-minute incubation at 30°C. Reactions are stopped by spotting 65 µl onto 1.5 cm2pieces of Whatman 31 ETCHR (Whatman International Ltd., Maidstone, United Kingdom) chromatography paper, which is dropped into 300 ml ice-cold 50% ethanol and washed for 5 minutes on a rotator. A second wash is done for 1 hour in 700 ml
ice-cold 50% ethanol followed by 1 minute in 100 ml acetone. The squares are dried for 10 minutes in a 60°C oven, placed in scintillation fluid (Ready Safe; Beckman Coulter Inc., Fullerton, California, USA), and counted for 14C-glucose incorporation into glycogen on a liquid scintillation counter (LKB Wallac 1219; PerkinElmer Wallac, Gaithersburg, Maryland, USA). The GSi disin-tegrations per minute are divided by the (GSd+ GSi) activity and expressed as the GS activity ratio.
Isolated muscle glucose-uptake assay. Soleus muscles were isolated from fed, male Akt2-null or control mice, and glucose uptake in the absence or presence of insulin at the indicated concentrations were determined as described previously (36).
Results
Targeted disruption of the Akt2 gene. Disruption of the Akt2
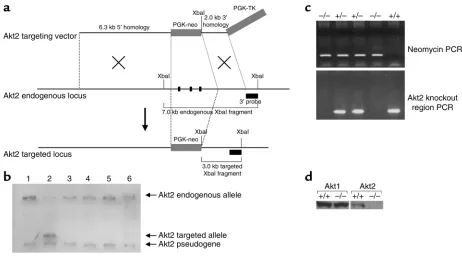
gene was accomplished by homologous recombination and consisted of the replacement of 260 bp of the cat-alytic domain (corresponding to bp 788–1047 of the murine cDNA; U22445) with the neomycin gene (Fig-ure 1a). Southern blot analysis of genomic DNA iso-lated from DBA/1lacJ ES cells confirmed the correct recombination (Figure 1b), and PCR genotyping analy-sis of F2-generation mice confirmed the generation of Akt2-null mice (Figure 1c). Western blot analysis of protein lysates derived from brains isolated from
Akt2+/+and Akt2–/–mice shows no detectable level of
Akt2 protein in Akt2–/–mice (Figure 1d). Thus, the
tar-geted disruption resulted in a functionally null allele.
Phenotype of Akt2 KO mice. The Akt2–/–mice (genetic
background: DBA/1lacJ) are viable, and examination of 49 pups (ten litters) from matings between two Akt2 het-erozygous mice showed a Mendelian ratio among Akt2+/+
(wild-type), Akt2+/–(heterozygous), and Akt2–/–
(homozy-gous) mice. In contrast to a previous report, both male and female Akt2-null mice exhibited a mild growth defi-ciency. At birth, Akt2-null mice were 8% smaller than control mice (1.37 ± 0.03 g versus 1.48 ± 0.03 g, respec-tively; P< 0.05). This decrease in body weight persist-ed throughout life, averaging 13% and 16% for male and female Akt2-null mice, respectively, over 6 months (P< 0.01 for both from 5 to 24 weeks of age; n= 9–13 per group). Akt2-null mice also exhibit a modest but significant (P< 0.01) decrease in length as compared with control mice, with a difference averaging 5% evi-dent from 6 to 11 weeks of age.
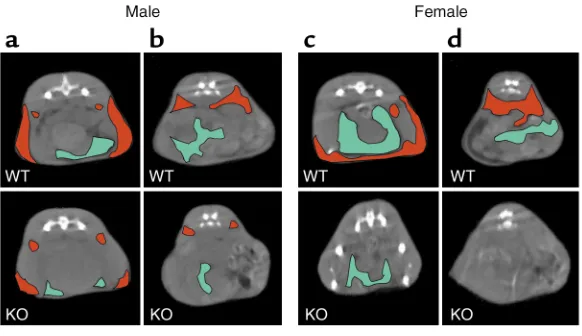
To further explore the observed differences in fat-pad weights, micro-CT scanning was used to assess the size of multiple adipose depots. Akt2-null animals (22 weeks of age) were found to exhibit significant lipoatrophy, with all adipose depots in both males and females being dramatically reduced in size (Figure 2 and Figure 3). The reduction in size of the fat depots in females was 80–90% (Figure 2, c and d, and Figure 3a). In 22-week-old males, which had normal fat pad mass at 7 weeks (Table 1), a reduction of 65–75% in the inguinal-subcutaneous and epididymal depots was observed, and the retroperitoneal and mesenteric depots were almost completely absent (Figure 2, a and b, and Figure 3b). The more significant reduction in size of the gonadal fat pads in both males and females at 22 weeks (Figure 3) relative to 7 weeks (Table 1) suggests that loss of adipose tissue is progressive with age. Consistent with this, the weight of the epididy-mal fat pad was found to be similar in epididy-male control and Akt2-null mice at 9 weeks of age (0.21 ± 0.04 ver-sus 0.18 ± 0.02 g, control and Akt2-null mice, respec-tively; P> 0.05) but was reduced 24% in Akt2-null mice at 12 weeks of age (0.21 ± 0.11 versus 0.158 ± 0.017, control and Akt2-null mice, respectively; P< 0.05). Morphometric analysis of adipose tissue from Akt2-null
and control mice indicated that adipocyte size was not significantly different at either 9 or 12 weeks (9 week: 9.8 ± 1.9 versus 11.0 ± 3.9 adipocytes per unit area; 12 week: 9.0 ± 1.7 versus 11.1 ± 3.4 adipocytes per unit area, control versus Akt2-null, respectively). This indi-cates that the decrease in adipose mass is due to a decrease in cell number. As observed in other lipoat-rophic syndromes, plasma triglycerides were elevated 60% in male Akt2-null mice (248 ± 21 mg/dl versus 154 ± 24 mg/dl, Akt2-null and control, respectively;
P < 0.05). The decrease in adipose tissue was also reflected in a decrease of 30% in plasma leptin con-centration in male Akt2-null mice (2.5 ± 0.1 versus 3.5 ± 0.5 ng/ml for Akt2-null and wild-type, respec-tively; P< 0.05) and a trend toward lower leptin con-centration in females (2.3 ± 0.1 versus 3.1 ± 0.4 ng/ml, Akt2-null and wild-type, respectively; P= 0.09).
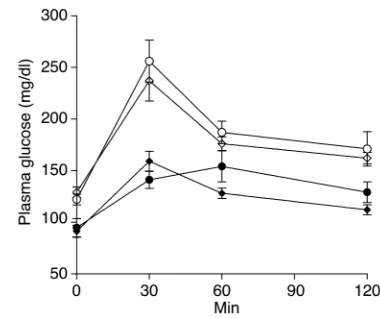
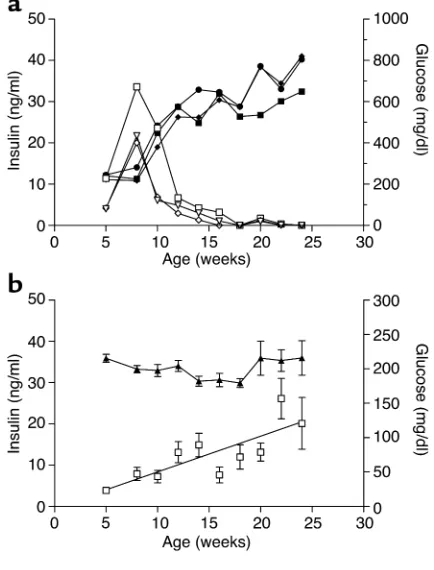
[image:6.576.65.527.47.305.2]Both male and female Akt2-null mice exhibited fast-ing hyperglycemia and glucose intolerance (Figure 4). Fed hyperglycemia was observed in 5-week-old male Akt2-null mice (220 mg/dl versus 170 mg/dl for Akt2 null and wild-type, respectively; P< 0.001) and became more severe with age (Figure 5a). Female mice exhibit-ed a milder fexhibit-ed hyperglycemia that did not become sig-nificantly elevated until 10 weeks of age (Figure 5a;
Figure 1
Generation of Akt2-deficient mice. (a) Illustration depicting strategy for homologous recombination in DBA/1lacJ ES cells. The locations of the 3′probe and XbaIrecognition sites used for Southern blot screening of the ES cells are indicated. The PGK-neocassette was inserted in the same orientation as the Akt2gene. (b) Southern blot analysis of DNA isolated from ES cells transfected with the Akt2targeting vector. Genomic DNA from six ES cell clones was isolated and digested with XbaIrestriction endonuclease and hybridized with the external 1.0-kb BamHI/XbaI 3′probe. This probe will recognize a 7.0-kb endogenous, 3.0-kb targeted, and 2.7-kb Akt2pseudogene XbaI fragment. The probe recognizes the pseudo-gene due to the presence of a 3′exon, also contained in the Akt2pseudogene sequence. Note that only clone 2 contains the targeted allele. (c) PCR genotyping analysis of F2-generation mice. Two PCR reactions are performed on each sample; one is specific for a targeted allele (top panel)
and the other is specific for the Akt2 locus within the knockout region (bottom panel). Taken together, all three genotypes, wild-type, het-erozygous, and homozygous (+/+, +/–, and –/–), can be determined. (d) Western blot analysis of protein extracts from brains isolated from
185 mg/dl versus 160 mg/dl for wild-type, P= 0.001) and remained stable until 1 year of age (182 mg/dl ver-sus 160 mg/dl; P= 0.024). Plasma insulin levels, how-ever, were elevated in both males and females at all ages (Figure 5b). In 5-week-old male and female Akt2-null mice, plasma insulin was elevated 2.6- and 3.6-fold, respectively (males, 4.5 versus 1.7 ng/ml, and females, 5.8 versus 1.6 ng/ml, Akt2-null and control, respectively). While insulin levels in female Akt2-null mice remained stable for the duration of the 6-month-long study (Figure 5b), average insulin levels in male Akt2-null mice increased further with age, suggestive of deteriorating insulin sensitivity. Furthermore, insulin levels in Akt2-null males were
more heterogeneous than in females, due in part to mice exhibiting two distinct patterns of insulinemia and glycemia over the 6-month-period of observation. Three mice (25%) from this group exhibited a transient hyperinsulinemia that peaked at 8 weeks of age, followed by a decline in plasma insulin to undetectable levels by 15–18 weeks of age, suggestive of β
cell failure (Figure 6a). This was accompanied by progression to extreme hyperglycemia (Figure 6a), with blood glucose values greater than 500 mg/dl evident by 12 weeks of age. The remaining mice exhibited a more stable and milder, albeit sig-nificant, hyperglycemia in the face of steadily increasing plasma insulin levels (Figure 6b), consistent with deteriorating insulin sensitivity. Not-ably, in three separate cohorts of male
Akt2-null mice, a high percentage exhibited hypo-insulinemia with accompanying extreme hypergly-cemia: 100% (n= 6) of 8-month-old mice (Figure 7), 80% (n= 5) of 20-week-old mice, and 92% (n= 25) of 7- to 8-month-old mice (data not shown). Thus, 75% of 48 male Akt2-null mice progressed to this extreme diabetic phenotype between 5 and 8 months of age. The two groups of mice depicted in Figure 6 may reflect temporal differences in the progression of the phenotype in the population or, conversely, different susceptibilities to development of more extreme dia-betes, possibly due to differences in prenatal or peri-natal nutrition (37, 38).
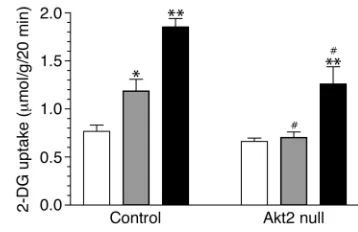
To determine whether impaired glucose disposal into skeletal muscle contributed to the hyperglycemia and insulin resistance of Akt2-null mice, glucose uptake into isolated soleus muscles was examined (Figure 8). No difference was observed in basal glucose uptake into muscles from control and Akt2-null mice. Sub-maximal (1 nM) insulin, however, failed to increase glu-cose uptake above basal level, and uptake in response to maximal (100 nM) insulin was reduced in muscles from Akt2-null mice (Figure 8). Thus, the lack of Akt2 in skeletal muscle decreased both the insulin sensitivi-ty and responsiveness of glucose transport.
[image:7.576.57.287.81.259.2]Regulation of enzymes involved in glucose produc-tion and storage in liver was also abnormal in Akt2-null mice. Expression of PEPCK, the rate-limiting enzyme of gluconeogenesis, was elevated prior to βcell failure in livers of diabetic, 7-week-old, fed Akt2-null mice 1.9-fold relative to control (P< 0.05; Table 2). At 24 weeks of age, the level of PEPCK expression was consistent with the prevailing glycemia, being elevated 4.1-fold (P < 0.01) in the subset of hypoinsulinemic, hyper-glycemic (Figure 6a) Akt2-null mice, although it was not different between control and hyperinsulinemic
Table 1
Body and organ weights in Akt2–/–and Akt2+/+mice
Fold change of Akt2–/–versus Akt2+/+
Males Females
Absolute Relative to Absolute Relative to body weight body weight
Body weight 0.84B NA 0.84B NA
Brain 0.92B 1.09A 0.94A 1.11A
Brown (interscapular)
adipose tissue 0.73B 0.87A 0.67B 0.80A
Kidney 0.70B 0.80B 0.81B 0.96
Liver 0.95 1.12A 0.93 1.09A
White (reproductive)
adipose tissue 0.79 0.93 0.40B 0.47B
Spleen 0.71B 0.85A 0.87 1.03
Thymus 0.76B 0.91 0.94 0.91
Terminal body and selected organ weights were determined for Akt2+/+and Akt2–/–male and female mice. A Student ttest was used to compare
termi-nal body and organ weights between wild-type and knockout mice. AP≤0.05; BP≤0.01; n= 10 each of Akt2–/–and Akt2+/+mice.
Figure 2
[image:7.576.245.536.492.660.2](Figure 6b) Akt2-null mice that exhibited only mild hyperglycemia (Table 2). The G6Pase gene expression was not elevated in Akt2-null mice either at 7 or 24 weeks of age, except in the subset of hypoinsulinemic Akt2-null mice, in which the level of G6Pase mRNA was elevated 2.2-fold (P< 0.05; Table 2). The proportion of liver GS in the active state did not differ between fed control and Akt2-null mice at 21 weeks of age (activity ratio, 0.055 ± 0.009 versus 0.070 ± 0.011, control and Akt2 null, respectively, P= 0.312). Total GS activity meas-ured in the presence of high (10 mM) glucose-6-phos-phate was reduced 46% in severely diabetic Akt2-null mice (P< 0.05), however, suggesting that the absolute amount of active GS was decreased. Nine-week-old Akt2-null mice that were still hyperinsulinemic, did not exhib-it this decrease in total liver GS activexhib-ity.
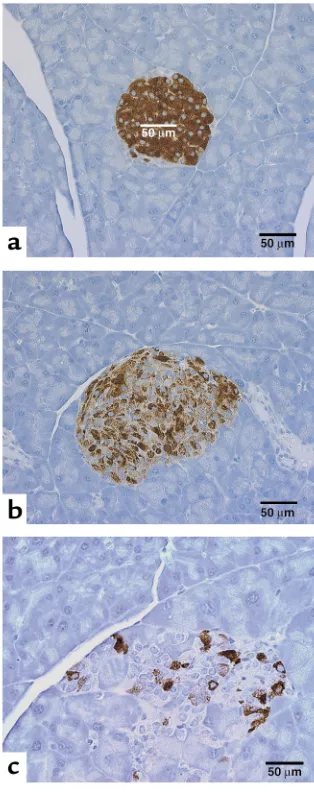
Pancreas morphometry and insulin immunohistochemistry. At 7 and 24 weeks of age, no significant difference in either the number or size of pancreatic islets was observed in either male or female hyperinsulinemic Akt2-null mice relative to control mice (data not shown). Pancreata from the hypoinsulinemic/hyper-glycemic male Akt2-null mice (Figure 6a and Figure 7), however, were characterized by a variable (10–59%) decrease in the total number of islets as compared with their wild-type controls (data not shown). The vast majority of the remaining islets in this cohort of mice were distorted and contained only a few βcells scat-tered within the exocrine pancreas (Figure 9c). The percentage of islets containing apoptotic cells, as indi-cated by caspase-3 staining, was increased in pancrea-ta from 24-week-old, hypoinsulinemic, male Akt2-null mice (37% of the remaining islets or islet remnants from hypoinsulinemic Akt2-null mice contained one or more apoptotic cells versus less than 2% of islets from control or hyperinsulinemic Akt2-null mice).
Occasionally, inflammatory and necrotic cells or mitotic figures were observed within those remaining islets. Islets from wild-type mice had abundant intra-cytoplasmic insulin staining in β cells (Figure 9a). Insulin staining was diffuse and uniform, except for cells at the periphery of the islets, which stained posi-tive for glucagon (data not shown). A decrease, pre-dominantly in males, in the intensity of staining for insulin in the cytoplasm of β cells was observed in islets from Akt2-null mice (Figure 9b). The remaining
βcells contained variable amounts of intracytoplasmic insulin interspersed with areas lacking immunohisto-chemical staining. The decreased staining for insulin in the Akt2–/–mice was already evident at 7 weeks but
[image:8.576.85.257.55.296.2]did not progress in incidence or severity by 24 weeks of age. The islets from the hypoinsulinemic/hyper-glycemic males (Figure 6a and Figure 7) were charac-terized by loss of normal islet architecture and severe loss of insulin staining with only occasional, weak, intracytoplasmic staining of a few remaining cells, consistent with the very low levels of plasma insulin in these animals (Figure 9c).
Figure 3
[image:8.576.320.510.465.624.2]Adipose tissue mass is decreased in Akt2-null mice. Adipose tissue mass of wild-type and Akt2-null mice was determined by micro-CT scanning in four regional depots, the inguinal subcutaneous (Ing), epididymal/gonadal (Epi/Gon), retroperitoneal (RP), and mesenteric (Mes) regions. Adipose tissue mass was significantly (P< 0.05) reduced in both female (a) and male (b) Akt2-null mice. In female Akt2-null mice adipose depot mass was reduced 80–90% in all depots measured. In male Akt2-null mice adipose depot mass was reduced 65–75% in the inguinal and epididymal depots, and more than 95% in the retroperitoneal and mesenteric depots.
Figure 4
receptor or IRS-2–deficient mice (10%; refs. 39, 40). Interestingly, Akt2-deficient mice described in a recent report (25) were diabetic but did not exhibit a growth deficiency. The likely explanation for the difference between the growth phenotype of those mice and the Akt2-null mice described here may lie in the genetic background of the different knockout lines. In fact, genetic background has been observed to have signif-icant modifying effects on the phenotypes of a num-ber of targeted deletions of genes in the insulin path-way (41–43). The previously described Akt2-null mice (25) were on a mixed 129/C57BL/6 genetic back-ground, whereas the mice described here are on an inbred DBA/1lacJ background. Consistent with the previous report, the growth deficiency due to lack of Akt2 is not observed on a hybrid DBA/1lacJ/C57BL/6 background (44). This suggests that the decreased size of Akt2-null mice described here is not due to meta-bolic abnormalities per se, but that the role of Akt2 in growth regulation is more obvious in the presence of modifying genes contributed by the DBA/1LacJ back-ground. A role for Akt2 in growth regulation is further supported by the phenotype of Akt1/Akt2 double-knockout mice, which are much smaller than mice deficient in only Akt1 or Akt2 (44). The apparent increase in size of brain and liver in the generally smaller
Discussion
The data reported here demonstrate that Akt2 regu-lates both growth and glucose metabolism. Akt2-null mice exhibited mild growth deficiency, age-dependent loss of adipose tissue, glucose intolerance, insulin resistance as evidenced by elevated plasma insulin lev-els, dyslipidemia, and hyperglycemia, which progres-sively worsened in a substantial portion of males to a severe form of diabetes that was accompanied by βcell failure and loss. This complex phenotype implicates Akt2 as a key intermediate in signaling from both insulin and IGF-1 receptors and, furthermore, sug-gests specific roles for Akt2 in maintenance of adipose tissue and βcell mass.
[image:9.576.88.267.53.342.2]Similar to Akt1-null mice (23, 24), Akt2-null mice were born smaller and exhibited a 13–15% decrease in body weight relative to their wild-type counterparts at all ages. The body length of Akt2-null mice was also modestly but significantly decreased. Collectively, these findings suggest that the loss of Akt2 confers a growth deficiency that is due in part to a decrease in body size as well as a decrease in body weight. The moderate growth deficiency in Akt2-null mice described here is similar in magnitude to that observed in insulin
Figure 5
Hyperglycemia and hyperinsulinemia in male and female Akt2-null mice. Plasma glucose (a) and insulin (b) levels were determined every 14 days in male wild-type (filled circles, n= 11), male Akt2-null (open circles, n= 12), female wild-type (filled diamonds, n= 9), and female Akt2-null (open diamonds, n= 13) mice.
Figure 6
[image:9.576.313.530.456.741.2]Akt2-null mice (Table 1) suggests that other Akt iso-forms can compensate or might play more significant roles in growth regulation of these tissues.
Akt2-null mice exhibited progressive lipoatrophy with a decrease in adipose tissue mass observed in all depots (Figures 2 and 3). Morphometric analysis of epi-didymal fat pads revealed that the decrease in adipose tissue mass was not due to a decrease in adipocyte size, indicating that it was due to decreased adipocyte num-ber. The loss of adipose tissue cannot completely account for the observed decrease in body weight in Akt2-null mice, since 7-week-old male Akt2-null mice weighed 16% less than wild-type mice despite adipose tissue mass that was proportionally normal (Table 1). The lipoatrophy is unlikely to be due to wasting asso-ciated with a type 1 diabetes–like insulinopenia because it was evident in male Akt2-null mice prior to βcell fail-ure as well as in females with elevated but stable glycemia and insulinemia. The food intake of Akt2-null mice was also not significantly different from control mice (data not shown). These data suggest that the loss of adipose tissue is directly related to the lack of Akt2 activity. The fact that Akt has been implicated in con-trol of both adipocyte differentiation and apoptosis, either of which could contribute to the progressive decrease in adipocyte number, lends support to this hypothesis. Constitutively active Akt will induce spon-taneous adipocyte differentiation (45), and inhibition of Akt activity induces apoptosis of adipocytes (46). Recent data indicate that the differentiation of murine
embryonic fibroblasts from Akt2-null mice into adipocytes in vitro is not significantly impaired (44), suggesting that the lipopatrophy observed in Akt2-null mice is due to either increased adipocyte apoptosis or decreased proliferation of adipocyte precursors. Notably, the abundance of Akt2 as well as its insulin-stimulated activity is twofold higher than that of Akt1 in differentiated adipocytes, and Akt3 activation is barely detectable (14). These data, along with the obser-vation reported here that loss of Akt2 leads to lipoat-rophy, suggest that Akt2 is the primary Akt isoform involved in adipocyte insulin signaling and in the reg-ulation of adipose mass.
Furthermore, among mouse models made insulin resistant by disruption of insulin-signaling pathway genes, only Akt2-null mice, insulin receptor–null mice (39), and mice with loss of insulin receptors specifical-ly in fat (FIRKO mice) exhibit decreased adipose tissue. FIRKO mice maintain normal glucose homeostasis because insulin sensitivity is maintained in other tis-sues (47). Mice with tissue-specific deletion of the insulin receptor in muscle (MIRKO), brain, βcells, or liver (LIRKO), expression of dominant negative insulin receptor in muscle, IRS-2–null mice, or mice with impaired insulin clearance due to expression of a dom-inant negative CEACAM1 in liver all exhibit increased adipose mass (43, 48), however. Except for MIRKO mice, all are also hyperinsulinemic. Thus, the progres-sive lipoatrophy in Akt2-null mice despite hyper-glycemia and hyperinsulinemia is a distinct feature of the Akt2-null phenotype and further supports the hypothesis that Akt2 plays a critical role in the regula-tion of adipocyte mass.
[image:10.576.82.271.52.309.2]The Akt2-null mice described here exhibited impaired insulin-stimulated glucose uptake into skele-tal muscle, similar to that described previously (25), and elevated hepatic PEPCK gene expression, both of which would contribute to the observed hyper-glycemia. The elevated level of PEPCK gene expression in 7-week-old male, Akt2-null mice, despite plasma
Figure 7
[image:10.576.325.504.529.645.2]Male Akt2-null mice become severely hypoinsulinemic and hyper-glycemic by 8 months of age. A group (n= 6) of 8-month-old male Akt2-null (KO) mice were hypoinsulinemic (a) and extremely hyper-glycemic (b) relative to age-matched wild-type males.
Figure 8
Muscle glucose uptake is impaired in Akt2-null mice. The 2-deoxyglu-cose (2-DG) uptake into isolated soleus muscles from male control and Akt2-null mice was determined in the absence of insulin (basal, white bars) or in the presence of a submaximal (1 nM, gray bars) or maximal (100 nM, black bars) concentration of insulin. *P< 0.05 versus corresponding basal; **P< 0.01 versus corresponding basal;
Psammomys obesusdespite a decrease in islet insulin con-tent (53). Furthermore, in male Akt2-null mice increased apoptosis was associated with the eventual loss of βcells, resulting in hypoinsulinemia and extreme hyper-glycemia. Therefore, the βcell phenotype of Akt2-null mice described here resembles most closely that of dia-betic models, such as male ZDF rats, in which islet mass fails to increase sufficiently, leading to hyperglycemia (54), and IRS-2–null mice, which exhibit significantly reduced βcell mass and develop diabetes as a result of insulin levels that were sixfold higher than control
ani-mals (Table 2), is consistent with a high degree of liver insulin resistance. PEPCK expression, however, was not elevated in Akt2-null mice that sustained suffi-cient hyperinsulinemia to maintain a near-normal glycemia (Table 2), suggesting that Akt2 is not an absolute requirement for regulation of this gene. Sim-ilarly, G6Pase expression was not elevated in Akt2-null mice except in those that exhibited pancreatic βcell failure, suggesting that the increase in expression resulted from a more general decrease in insulin sig-naling, rather than a loss of Akt2 specifically.
The normal response of the endocrine pancreas to peripheral insulin resistance is a compensatory increase in βcell mass (49). Mice with heterozygous insulin recep-tor (IR) deletion (IR+/–), double heterozygous deletion of
IR and IRS-1 (IR/IRS-1+/–), IRS-1–/– mice, and LIRKO
[image:11.576.56.537.79.160.2]mice exhibit twofold to tenfold increases in βcell mass and hyperinsulinemia (40, 50–52). Female Zucker dia-betic fatty (ZDF) rats exhibit islet hypertrophy and hyperinsulinemia sufficient to compensate for their insulin resistance and do not develop diabetes (49). Lim-ited data from humans is consistent with that from ani-mal models and suggest that βcell mass is increased in obese, insulin-resistant subjects (49). Thus, a major dis-tinction between the Akt2-null phenotype described here and most insulin-resistant models, including the previously described Akt2-null mice (25), is the failure of pancreatic islet mass to increase in response to periph-eral insulin resistance. This may indicate that prolifera-tion or neogenesis of βcell precursors is impaired in the Akt2-null mice described here. The observation that the insulin content of βcells in hyperinsulinemic male Akt2-null mice appeared lower (Figure 9b) suggests that in the absence of islet hypertrophy, βcells were compensating for the insulin resistance by secreting more insulin per cell. Similarly, hyperinsulinemia is observed in diabetic
Table 2
Expression of gluconeogenic enzymes in liver of male control and Akt2-null mice
Age 7 weeks 24 weeks
Control Akt2 null Control Akt2 null Ins-H Akt2 null Ins-L
Plasma glucose (mg/dl) 233 ± 11 376 ± 19A 175 ± 6 216 ± 25 758 ± 55A
Plasma insulin (ng/ml) 0.85 ± 0.1 5.4 ± 0.8A 2.4 ± 0.6 20.1 ± 6.3A ND
PEPCK mRNAB 2.8 5.3A 4.4 2.3 18.4A
G6Pase mRNAB 1.9 1.2 1.2 0.96 2.6A
Twenty-four–week old Akt2-null mice are separated into hyperinsulinemic and hypoinsulinemic groups. AP< 0.05 versus control. BThe mRNA levels were
deter-mined by quantitative RT-PCR as described in Methods and expressed as arbitrary units. ND, not detectable; Ins-H, hyperinsulinemic; Ins-L, hypoinsulinemic.
Figure 9
[image:11.576.335.492.338.734.2]the failure of islet hyperplasia (40, 42, 55). The βcell phenotype of IRS-2–null mice with peripheral insulin resistance is more severe than that observed in Akt2-null mice, as indicated by the greater than 90% decrease in βcell area in 4-week-old Irs1+/–Irs2–/–mice
(55). This suggests that in Akt2-null mice the other Akt isoforms may allow some signaling downstream of IRS-2 and partially offset the lack of Akt2 in βcells, although Akt1 and Akt3 are apparently unable to sub-stitute for Akt2 in mediating the hypertrophy or hyperplasia that is required to compensate for periph-eral insulin resistance. In contrast to our observations,
βcell mass was reported to increase in mice in which the Akt2 deficiency was generated on the 129/C57BL/6 background (25). The increased βcell mass is likely to contribute to the milder phenotype exhibited by those mice. Notably, the diabetic phenotypes of IRS-2–defi-cient mice (40, 42) as well as ob/obmice (30) also vary in severity depending on the genetic background, with one background exhibiting greater βcell loss than the other. Furthermore, the line of IRS-2–null mice with the more severe islet phenotype also exhibits a 10% growth deficiency (40). It is interesting that two aspects of the Akt2-null phenotype observed in the mice described here but not in those on the hybrid 129/C57BL/6 background, the growth deficiency and failure of βcell mass to increase, are both regulated primarily by IGF-1 receptor signaling (39, 55). This leads one to speculate whether a difference in these genetic backgrounds may lie in genes modifying the strength of signaling through the IGF-1 receptor. Curiously, a number of reports have documented an inverse correlation between height and the incidence of type 2 diabetes, insulin resistance, or glucose intol-erance in humans (56–59). Since IGF-1 receptor sig-naling is the primary determinant of somatic growth, these data, taken together, raise the possibility that sig-naling through the IGF-1 pathway is protective for diabetes and further suggest that the basis of this pro-tective action may lie in the role of IGF-1 signaling in
βcell preservation or adaptation.
The pattern of transient hyperinsulinemia followed by relative hypoinsulinemia and hyperglycemia in male Akt2-null mice resembles closely that observed in dia-betic models such as the ZDF rat (60), IRS-2–null mice (40), the desert gerbil, P. obesus, on a high-energy diet (53), and even human type 2 diabetics (61). Data sug-gest that increased βcell apoptosis contributes to the
βcell failure observed here and in the other rodent models (53–55, 62). The important antiapoptotic role of Akt is well documented (9), and the data reported here suggest that Akt2 may play a uniquely important role downstream of IRS-2 in preventing apoptosis of β
cells in the face of hyperglycemic stress. A recent report suggests that heterozygous deletion of an Akt sub-strate, the Forkhead transcription factor Foxo1, can rescue the loss of βcells in IRS-2–deficient mice (63). Since phosphorylation of Forkhead transcription fac-tors by Akt is part of the mechanism whereby Akt
promotes cell survival (64), the Akt2 isoform may pro-vide the link between IRS-2 and Forkhead transcription factors in mediating survival of βcells.
In summary, the phenotype of Akt2-null mice described here provides insight into unique and shared roles of this Akt isoform. Akt2 and Akt1 participate in the regulation of body size, whereas Akt2 appears to play a primary role in glucose homeostasis through regulation of insulin action in peripheral tissues, adi-pose mass, and β cell growth and/or survival in response to peripheral insulin resistance.
Acknowledgments
We are grateful to Margaret Wilhelms, Catherine Tabor, Kim Kowsz, Anne Brodeur, and William Zava-doski for expert technical assistance and to Janice C. Parker, Walter C. Soeller, and Nissim Hay for critical reading of the manuscript and helpful discussions.
1. Staal, S.P. 1987. Molecular cloning of the akt oncogene and its human homologues AKT1 and AKT2: amplification of AKT1 in a primary human gastric adenocarcinoma. Proc. Natl. Acad. Sci. U. S. A. 84:5034–5037.
2. Staal, S.P., Hartley, J.W., and Rowe, W.P. 1977. Isolation of transforming murine leukemia viruses from mice with a high incidence of sponta-neous lymphoma. Proc. Natl. Acad. Sci. U. S. A.74:3065–3067. 3. Vanhaesebroeck, B., and Alessi, D.R. 2000. The PI3K-PDK1 connection:
more than just a road to PKB. Biochem. J. 346:561–576.
4. Altomare, D.A., et al. 1995. Cloning, chromosomal localization and expression analysis of the mouse Akt2 oncogene. Oncogene. 11:1055–1060.
5. Altomare, D.A., Lyons, G.E., Mitsuuchi, Y., Cheng, J.Q., and Testa, J.R. 1998. Akt2 mRNA is highly expressed in embryonic brown fat and the AKT2 kinase is activated by insulin. Oncogene.16:2407–2411. 6. Brodbeck, D., Cron, P., and Hemmings, B.A. 1999. A human protein
kinase Bγwith regulatory phosphorylation sites in the activation loop and in the C-terminal hydrophobic domain. J. Biol. Chem. 274:9133–9136.
7. Nakatani, K., Sakaue, H., Thompson, D.A., Weigel, R.J., and Roth, R.A. 1999. Identification of a human Akt3 (protein kinase Bγ) which contains the regulatory serine phosphorylation site. Biochem. Biophys. Res. Comm. 257:906–910.
8. Coffer, P.J., Jin, J., and Woodgett, J.R. 1998. Protein kinase B (c-Akt): a multifunctional mediator of phosphatidylinositol 3-kinase activation.
Biochem. J.335:1–13.
9. Brazil, D.P., and Hemmings, B.A. 2001. Ten years of protein kinase B sig-nalling: a hard Akt to follow. Trends Biochem. Sci.26:657–664. 10. Hemmings, B.A. 1997. Akt signaling: linking membrane events to life
and death decisions. Science.275:628–630.
11. Franke, T.F., et al. 1995. The protein kinase encoded by the Akt proto-oncogene is a target of the PDGF-activated phosphatidylinositol 3-kinase. Cell.81:727–736.
12. Burgering, B.M.T., and Coffer, P.J. 1995. Protein kinase B (c-Akt) in phosphatidylinositol-3-OH kinase signal transduction. Nature. 376:599–602.
13. Cohen, P., Alessi, D.R., and Cross, D.A.E. 1997. PDK1, one of the miss-ing links in insulin signal transduction? FEBS Lett.410:3–10. 14. Walker, K., et al. 1998. Activation of protein kinase B βandγisoforms by
insulin in vivo and by 3-phosphoinositide-dependent protein kinase-1 in vitro: comparison with protein kinase B α. Biochem. J.331:299–308. 15. Verdu, J., Buratovich, M.A., Wilder, E.L., and Birnbaum, M.J. 1999.
Cell-autonomous regulation of cell and organ growth in Drosophila by Akt/PKB. Nat. Cell Biol.1:500–506.
16. Tuttle, R.L., et al. 2001. Regulation of pancreatic β-cell growth and sur-vival by the serine/threonine protein kinase Akt1/PKBα. Nat. Med. 7:1133–1137.
17. Bernal-Mizrachi, E., Wen, W., Stahlhut, S., Welling, C.M., and Permutt, M.A. 2001. Islet β-cell expression of constitutively active Akt1/PKBα
induces striking hypertophy, hyperplasia, and hyperinsulinemia. J. Clin. Invest.108:1631–1638. doi:10.1172/JCI200113785.
18. Kohn, A.D., et al. 1998. Construction and characterization of a condi-tionally active version of the serine/threonine kinase Akt. J. Biol. Chem. 273:11937–11943.
type 2 diabetes because of liver insulin resistance and lack of compensa-tory β-cell hyperplasia. Diabetes.49:1880–1889.
43. Mauvais-Jarvis, F., and Kahn, C.R. 2000. Understanding the pathogene-sis and treatment of insulin repathogene-sistance and type 2 diabetes mellitus: what can we learn from knockout mice? Diabetes Metab.26:433–448. 44. Peng, X., et al. 2003. Dwarfism, impaired skin development, delayed
bone development, inhibition of adipogenesis and skeletal muscle atro-phy in mice lacking Akt1 and Akt2. Genes Dev.17:1352–1365. 45. Magun, R., et al. 1996. Expression of a constitutively activated form of
protein kinase B (c-Akt) in 3T3-L1 preadipose cells causes spontaneous differentiation. Endocrinology.137:3590–3593.
46. Reusch, J.E.B., and Klemm, D.J. 2002. Inhibition of cAMP-response ele-ment-binding protein activity decreases protein kinase B/Akt expression in 3T3-L1 adipocytes and induces apoptosis. J. Biol. Chem.277:1426–1432. 47. Bluher, M., et al. 2002. Adipose tissue selective insulin receptor knock-out protects against obesity and obesity-related glucose intolerance.
Dev. Cell.3:25–38.
48. Poy, M.N., et al. 2002. CEACAM1 regulates insulin clearance in liver.
Nat. Genet.30:270–276.
49. Bonner-Weir, S. 2000. Islet growth and development in the adult. J. Mol. Endocrinol.24:297–302.
50. Kido, Y., et al. 2000. Tissue-specific insulin resistance in mice with muta-tions in the insulin receptor, IRS-1 and IRS-2. J. Clin. Invest.105:199–205. 51. Michael, M.D., et al. 2000. Loss of insulin signaling in hepatocytes leads to severe insulin resistance and progressive hepatic dysfunction. Mol. Cell. 6:87–97.
52. Bruning, J.C., et al. 1997. Development of a novel polygenic model of NIDDM in mice heterozygous for IR and IRS-1null alleles. Cell. 88:561–572.
53. Donath, M.Y., Gross, D.J., Cerasi, E., and Kaiser, N. 1999. Hyperglycemia-induced β-cell apoptosis in pancreatic islets of Psammomys obesusduring development of diabetes. Diabetes.48:738–744.
54. Pick, A., et al. 1998. Role of apoptosis in failure of β-cell mass compen-sation for insulin resistance and β-cell defects in the male Zucker dia-betic fatty rat. Diabetes.47:358–364.
55. Withers, D.J., et al. 1999. IRS-2 coordinates IGF-1 receptor-mediated β-cell development and peripheral insulin signalling. Nat. Genet.23:32–40. 56. Lawlor, D.A., Ebrahim, S., and Davey Smith, G. 2002. The association
between components of adult height and type II diabetes and insulin resistance: British Women’s Heart and Health Study. Diabetologia. 45:1097–1106.
57. Riste, L., Khan, F., and Cruickshank, K. 2001. High prevalence of type 2 diabetes in all ethnic groups, including Europeans, in a British inner city.
Diabetes Care.24:1377–1383.
58. Kousta, E., et al. 2000. Women with a history of gestational diabetes of European and South Asian origin are shorter than women with normal glucose tolerance in pregnancy. Diabet. Med.17:792–797.
59. Brown, D.C., et al. 1991. Height and glucose tolerance in adult subjects.
Diabetologia.34:531–533.
60. Etgen, G.J., and Oldham, B.A. 2000. Profiling of Zucker diabetic fatty rats in their progression to the overt diabetic state. Metabolism. 49:684–688.
61. Taylor, S.I. 1999. Deconstructing type 2 diabetes. Cell.97:9–12. 62. Shimabukuro, M., Zhou, Y.-T., Levi, M., and Unger, R.H. 1998. Fatty
acid-induced βcell apoptosis: a link between obesity and diabetes. Proc. Natl. Acad. Sci. U. S. A.95:2498–2502.
63. Kitamura, T., Nakae, J., Biggs, W.H., III, White, M.F., and Accili, D. 2001. The transcription factor FKHR promotes βcell survival in IRS-2 knock-out mice. International Symposium on Insulin Receptors and Insulin Action,
8th.Geneva, Switzerland. (Abstr.)
64. Brunet, A., et al. 1999. Akt promotes cell survival by phosphorylating and inhibiting a Forkhead transcription factor. Cell.96:857–868. 20. Cross, D.A.E., et al. 1997. Insulin activates protein kinase B, inhibits
glycogen synthase kinase-3 and activates glycogen synthase by rapamycin-insensitive pathways in skeletal muscle and adipose tissue.
FEBS Lett.406:211–215.
21. Takata, M., et al. 1999. Requirement for Akt (protein kinase B) in insulin-induced activation of glycogen synthase and phosphorylation of 4E-BP1 (PHAS-1). J. Biol. Chem.274:20611–20618.
22. Garofalo, R. 2002. Genetic analysis of insulin signaling in Drosophila.
Trends Endocrinol. Metab.13:156–162.
23. Chen, W., et al. 2001. Growth retardation and increased apoptosis in mice with homozygous disruption of the akt1gene. Genes Dev. 15:2203–2208.
24. Cho, H., Thorvaldsen, J., Chu, Q., Feng, F., and Birnbaum, M. 2001. Akt1/PKBαis required for normal growth but dispensable for mainte-nance of glucose homeostasis in mice. J. Biol. Chem.276:38349–38352. 25. Cho, H., et al. 2001. Insulin resistance and a diabetes mellitus-like syn-drome in mice lacking the protein kinase Akt2 (PKBβ). Science. 292:1728–1731.
26. Reitman, M., Arioglu, E., Gavrilova, O., and Taylor, S. 2000. Lipoatrophy revisited. Trends Endocrinol. Metab.11:410–416.
27. Roach, M.R., Stock, J.L., Byrum, R., Koller, B.H., and McNeish, J.D. 1995. A new embryonic stem cell line from DBA/1lacJ mice allows genetic modification in a murine model of human inflammation. Exp. Cell Res. 221:520–525.
28. Stewart, C.L. 1993. Production of chimeras between embryonic stem cells and embryos. Methods Enzymol.225:823–854.
29. Naggert, J.K., Mu, J.L., Frankel, W., Bailey, D.W., and Paigen, B. 1995. Genomic analysis of the C57Bl/Ks mouse strain. Mamm. Genome. 6:131–133.
30. Coleman, D.L., and Hummel, K.P. 1973. The influence of genetic back-ground on the expression of the obese (ob) gene in the mouse. Diabetologia. 9:287–293.
31. Chua, S.J., et al. 2002. Differential beta cell responses to hyperglycemia and insulin resistance in two novel congenic strains of diabetes
(FVB-Leprdb) and obese (DBA-Lepob) mice. Diabetologia.45:976–990.
32. www.informatics.jax.org/external/festing/mouse/docs/DBA.shtml. 33. Hildebrandt, A.L., Kelly-Sullivan, D.M., and Black, S.C. 2002. Validation
of a high resolution X-ray computed tomography system to measure murine adipose tissue depot mass in situ and longitudinally. J. Pharma-col. ToxiPharma-col. Methods. 47:99–106.
34. Livak, K.J., and Schmittgen, T.D. 2001. Analysis of relative gene expres-sion data using real-time quantitative PCR and the 2–∆∆Ctmethod. Methods.25:402–408.
35. Guinovart, J.J., et al. 1979. Glycogen synthase: a new activity ratio assay expressing a high sensitivity to the phosphorylation state. FEBS Lett. 106:284–288.
36. Etgen, G.J., Zavadoski, W.J., Holman, G.D., and Gibbs, E.M. 1999. Insulin-sensitive regulation of glucose transport and GLUT4 transloca-tion in skeletal muscle of GLUT1 transgenic mice. Biochem. J.337:51–57. 37. Simmons, R.A., Templeton, L.J., and Gertz, S.J. 2001. Intrauterine growth retardation leads to the development of type 2 diabetes in the rat. Diabetes.50:2279–2286.
38. Garofano, A., Czernichow, P., and Breant, B. 2000. Impaired beta-cell regeneration in perinatally malnourished rats: a study with STZ. FASEB J. 14:2611–2617.
39. Nakae, J., Kido, Y., and Accili, D. 2001. Distinct and overlapping func-tions of insulin and IGF-1 receptors. Endocr. Rev.22:818–835. 40. Withers, D., et al. 1998. Disruption of IRS-2 causes type 2 diabetes in
mice. Nature.391:900–904.