† Corresponding author
DOI: 10.18488/journal.aefr/2015.5.10/102.10.1174.1186 ISSN(e): 2222-6737/ISSN(p): 2305-2147
© 2015 AESS Publications. All Rights Reserved.
1174
EXCHANGE RATE VOLATILITY AND EXPORT PERFORMANCE IN
SOUTH AFRICA: (2000-2014)
Wilson Chamunorwa1 --- Ireen Choga2† 1
Department of Economics, University of Fort Hare, South Africa
2School of Economics and Decisions Sciences, North West University, South Africa
ABSTRACT
This study sought to investigate the relationship between exchange rate volatility and export
performance in South Africa. The main objective of the study was to examine the impact of
exchange rate volatility on export performance in South Africa. This relationship was examined
using GARCH methods. Exports were regressed against real effective exchange rate, trade
openness, and capacity utilisation. The research aimed to establish weather exchange rate
volatility impacts negatively on export performance in the manner suggested by econometric
model. The result obtained showed that exchange rate volatility had a significantly negative effect
of South African exports in the period 2000-2011.
© 2015 AESS Publications. All Rights Reserved.
Keywords:
Exchange rate volatility, Export performance, GARCH, Trade openness, South Africa.Contribution/ Originality
This study contributes in the existing literature that asserts that exchange rate volatility impacts negatively on export performance. GARCH method has been employed to connect the rand volatility to export volumes. It emerged that exchange rate volatility risk reduce gains to international trade. Exporting firms tend to export fewer products to destinations with higher currency volatility. The finding of this research is that exchange rate volatility impacts negatively on the firms exporting behaviour.
1. INTRODUCTION
The exchange rate of a country plays a pivotal role in public debate on trade and trade policy in South Africa. Like many developing countries, South Africa‟s economic success depends on the rest of the world. The level of interdependence has increased from the previous decade as we move towards an era of free trade. This means it is highly influenced by changes in world demand and
Asian Economic and Financial Review
ISSN(e): 2222-6737/ISSN(p): 2305-2147
© 2015 AESS Publications. All Rights Reserved.
1175
currency fluctuations. Widespread calls for depreciation or appreciation of the rand currency were witnessed in South Africa. The Congress of South African Trade Union approached the government about the need for exchange rate depreciation in June 2005. Business around the country also argues that the rand‟s post 2001 strength negatively affected manufacturing production (Business Day, 2003). The Growth Employment and Redistribution (GEAR) macroeconomic policy emphasized the need for a „competitive‟ exchange rate. Moreover the Accelerated and Shared Growth Initiative in South Africa (ASGISA) initiative has identified exchange rate volatility as a significant constraint to growth. Poor export performance in South Africa has been blamed on strong rand by stakeholders. The way the South Africa Reserve Bank monitors exchange rate developments has been blamed for the volatility of the rand. Others argue that the Reserve Bank also does not intervene in the market of foreign exchange to defend any specific level of the rand but rather left it to demand and supply conditions in the foreign exchange market.
Brenton (2007) concluded that exchange rate volatility decreases trade as they believed that this happens because of imperfect markets particularly in developing countries. On the other hand, some studies provide evidence supporting a positive relationship between exchange rate volatility and trade flows. South Africa‟s need for high export growth in an environment of freely floating exchange rates and increased volatility of the rand calls for an understanding of the effect of this highly fluctuating rand on South Africa‟s exports and consequently, its impact on the economy.
The problem of exchange rate volatility has given rise to a broad debate but there is no consensus on whether exchange rate volatility influences trade volumes or on whether any such influence is negative or positive. Aziakpono et al. (2005) has been credited for saying that high exchange rate volatility complements trade if exporters are sufficiently risk averse as a rise in an increase in exchange rate variability leads to an increase in an expected margin of utility of export revenue which act as an incentive for exporters.
The critical question for South African policy makers is to whether managing exchange rate volatility can improve export performance? To what extend does real exchange rate volatility affects export performance? In particular does exchange rate volatility influence export volumes or whether such influence is positive or negative?
© 2015 AESS Publications. All Rights Reserved.
1176
2. AN OVERVIEW OF EXCHANGE RATE AND EXPORTS IN SOUTH AFRICA
South Africa has been using a floating exchange rate as its exchange rate policy. This means that the rand exchange rate is determined by market forces of demand and supply in the foreign exchange rate market. The policy the South African Reserve Bank is to stay out of the market and allow the market forces to determine the exchange rate of the rand to other currencies. In recent, the SARB has been building up foreign exchange reserves and this involves buying of foreign exchange from the market in a bid to control international liquidity. However this activity can somehow influence the exchange rate by increasing the demand of foreign exchange even though the activity is not viewed as foreign exchange policy.
South Africa adopted a floating exchange rate regime despite its exposure to exchange rate volatility which is a threat to the growth of international trade and macroeconomic stability (Lira, 2007). It is commonly believed that high exchange rate volatility leads to high uncertainty which eventually increases trading risks.
The way the South Africa Reserve Bank monitors exchange rate developments has been blamed for the volatility of the rand. “The Reserve Bank also does not intervene in the market of foreign exchange to defend any specific level of the rand. This is rather left to supply and demand conditions in the foreign exchange market” (Van de Merwe and Mollentze, 2009).
© 2015 AESS Publications. All Rights Reserved.
1177
sector. The inability to restructure exports towards these high dynamic technology products is another explanation for these poor export performance of South African manufacturing exports during the 1990s.
Figure-1. Structure of South African Exports from 1995 to 2012
Source: South African Reserve Bank (2013)
Figure 1 show that in real terms exports increased from R180 Billion in 1995 to about R300 Billion in 2011.This was a significant growth in exports which can be attributed to a number of factors. South Africa has succeeded in scoring a positive result despite depressed world market conditions due financial crisis in the world market and it has managed to diversify its export base in terms of products and trading partners. While the sharp depreciation of the rand has made a significant contribution, it does not fully explain the recent trends. Although overall export growth has been comparatively low, some progress has been made in diversifying manufacturing exports towards medium and high technology products. This diversification is mainly due to the strong growth in motor vehicle related exports (medium technology), with some minor diversification towards high technology products.
3. A REVIEW OF SUPPORTING LITERATURE
© 2015 AESS Publications. All Rights Reserved.
1178
of data used. Research conducted in South Africa include the works of Todini and Munyama (2005); Edwards (2005); Bah and Amusa (2003) and Lira (2007). Research conducted in developing countries include the work of Nwidobie (2011); Musonda (2001); Verena (2006). Research conducted in developed countries include the works of Hericout and Poncet (2012); Abdulrahman (1997); Hasan (2001) and Aristotelous (2001).
4. METHODOLOGY USED IN THE STUDY
To estimate the impact of exchange rate on export performance in South Africa, the study shall make use of the Garch Model. The data is first tested for stationarity using the Philips Peron test, Dickey Fuller test and the Augmented Dickey Fuller test.
5. MODEL SPECIFICATIONS
To determine the impact of exchange rate volatility on export performance in South Africa, this study shall modify the Guerin and Lahreche-Revil (2001) methodology. Guerin and Lahreche-Revil (2001) examined the relationship between currency volatility and growth in Europe. This study shall modify the Guerin and Lahreche-Revil (2001) model by putting trade openness measured by exports plus imports divided by GDP, Real Effective Exchange rate, and capacity utilisation. Using GARCH, the model will be represented as a system of equations for export supply (Xs) and export demand (Xd) which simultaneously determine export price and export quantity.
6. EXPORT DEMAND FUNCTION
The study shall use a standard deviation of exports and the export demand function will be modelled as a function of real effective exchange rate, real foreign income, and domestic prices of exports. This can be expressed as follows;
)
2
.
6
...(
...
...
...
...
...
...
3 2 10 t t t t
d
u
GDP
Y
REER
X
All the variables are converted to logarithms. This is done in order to remove trends and obtain elasticity coefficient of these variables. The model in (4.2) above thus assumes the form:
)
3
.
6
...(
...
...
...
...
...
...
3 2 10 t t
t t d
lGDP
lY
lREER
lX
We postulate the following export adjustment mechanism for export demand.
)
4
.
6
...(
...
...
...
...
...
...
...
...
)...
(
1 1
t dt tt
lX
lX
lX
lX
Where
is equal to a coefficient of adjustment 0
1. By substituting (6.3) into (6.4) the following model is derived)
5
.
6
....(
...
...
...
...
)
1
(
1 3 2 10 t t t
t t t d
X
lGDP
lY
lREER
© 2015 AESS Publications. All Rights Reserved.
1179
LREER is the logarithm of the real effective exchange rate of the rand, measured in foreign currency terms. The REER of a country i is normally calculated as a geometric weighted average of weighted bilateral exchange rates.
LGDP is the logarithm of Gross value added at basic prices of manufacturing Gross Domestic Products.
LYis the logarithm for foreign income and is defined as income arising from outside South Africa.
is the error term.6.1. Export Supply Function
On the supply side, the desired level of exports are assumed to be influenced by real exchange rate (REER), price of other inputs apart from labour (PI), and capacity factors(CU). This can be expressed as follows: On the supply side, the desired level of exports are assumed to be influenced by real exchange rate (REER), Trade openness (TO), and capacity utilisation (CU). This can be expressed as follows:
EXs =
0
1REER
2TO
3CU
t
t...
...
...
...
...(
6
.
6
).
The variables above are converted to logarithms to become;
lREER
lTO
lCU
LEX
0 1 2 3 ...(6.7)LEXs= is the logarithm of exports
LREER= is the logarithm of the real effective exchange rate of the rand, measured in foreign currency terms. The REER of a country i is normally calculated as a geometric weighted average of weighted bilateral exchange rates.
LTO = is the logarithm of trade openness.
LCU = is the logarithm of capacity utilisation (infrastructure and the level of technology). This specification assumes that the desired level of exports supplied is equal to the level of exports supplied. To get a disequilibrium export supply function, a partial adjustment mechanism is needed. It is postulated in the following adjustment mechanism for exports:
)
8
.
6
...(
...
...
...
...
...
...
...
)...
(
1
lX
t
lX
tlX
tWhere
is equal to coefficient of adjustment (0
1
)
. By substituting equation (6.9)into equation (4.8) the following general export function is derived.
EXs =
)
11
.
6
...(
...
...
...
)
1
(
13 2
1
0
REER
TO
CU
t
lX
t
u
t© 2015 AESS Publications. All Rights Reserved.
1180
By substituting (5) into (8) then the following general export function for South African exports is derived as follows:
)
12
.
4
...(
...
5 4
3 2
1
0 t t t
t
lREER
lTO
lCU
lGDP
lY
LEX
This will give us potentially important relationships among expected determinants and trade growth on which the estimation will apply
7. DEFINITION OF VARIABLES
LEX is the natural logarithm of exports. Exports are goods and services produced domestically and sold to buyers in another country. LREER is the logarithm of the real effective exchange rate of the rand, measured in foreign currency terms. The REER of a country i is normally calculated as a geometric of weighted bilateral exchange rates. The weighted bilateral exchange rate is calculated as follows:
ij j j
i i j i
i
x
e
P
e
P
REER
1 1
Where
ej
indicates the exchange value of countryj
'
s
currency against the US dollar,xij
isthe country j’s weight in country i’s index and pj is price index of country j. Under this study a rise in REER represents a real depreciation of the rand. LTO is the logarithm of trade openness. Trade openness is associated with positive trade outcomes. More open economies must experience more trade growth. Trade openness can improve exports as there will be limited hindrances to trade between countries. LCU is the logarithm for capacity utilization. Capacity utilization (infrastructure and technology) is the extent to which the productive capacity of plant, firm, country is being utilized in generating goods and services for exports. More capacity utilization by firms would result in more goods and services being produced at a lower cost because fixed costs and total costs decreases as more units are produced. Higher capacity utilization generally results in more output and more exports. LGDP is the logarithm of the country‟s growth domestic product. The GDP measures a country‟s economic growth. It indicates the total output produced per year. Since net export is a component of GDP, this variable has been dropped from the South African export equation because it results in collinearity. LYis the logarithm for foreign income and is defined as income arising from outside South Africa. Since Net foreign income is a component of GDP, the variable has also been dropped out of the equation because it results in collinearity.
8. EXPECTED PRIORI
8.1. Real Effective Exchange Rate
© 2015 AESS Publications. All Rights Reserved.
1181
be positive for countries that expect an improvement in trade balance through depreciation of the real effective exchange rate. The countries that expect a larger gain in trade from depreciating their currency to boost exports and growth can adopt a policy of depreciating their real effective exchange rate. South Africa is likely to benefit from real exchange rate depreciation than a country like Japan since Japan has a higher IIT index.
8.2. Trade Openness
Trade openness affects growth volatility. Trade openness is associated with positive trade outcomes and hence a positive relationship is expected. More open economies are expected to result in increased growth in trade. Trade openness can improve exports as there will be limited hindrances to trade between countries.
8.3. Capacity Utilization
A positive sign is expected on capacity utilization. More capacity utilization by firms would result in more goods and services being produced at a lower cost because fixed costs and total costs decreases as more units are produced. Higher capacity utilization generally results in more output and more exports. As more capacity is utilized, more output is expected and there will be enough output to export to other countries.
9. DATA SOURCES
The study shall use data on exports of goods and services, real effective exchange rate, trade openness and capacity utilisation, prepared from Statistics South Africa and Reserve Bank of South Africa. Nominal figures shall be used for the study. The study employs monthly South African data for the period 2000/01 – 2012/11 so that there will be adequate observations so as to get reliable conclusion. The data shall be test for stationary first or the order of integration of the data series in order to eliminate spurious regression results. This shall be done using the Augmented Dickey Fuller method and the Phillip Peron test.
10. RESEARCH TECHNIQUES
The study uses Dickey Fuller test, Augmented Dickey Fuller test and Phillip Peron unit root tests for stationarity. Variables are tested for stationarity because most economic series are not stationary in their levels which lead to estimations being meaningless. In this section the techniques used to test for stationarity are reviewed.
11. TESTING FOR COLLINEARITY
© 2015 AESS Publications. All Rights Reserved.
1182
multicollinearity among independent variables, a correlation analysis was performed. The closer the r coefficient approaches +-1, regardless of the direction, the stronger is the existing association indicating a more linear relationship between the two variables. However a suggested rule of thumb is that if the pair wise correlation between two regressors is very high, in excess of 0.8 multicollinearity may pose a serious problem. The correlation analysis results are reported below.
Table-1. Matrix of correlation of independent variables.
Variable LEX LREER LTO LCU
LEX 1.000000 0.261826 0.305787 0.270083
LREER 0.261826 1.000000 0.099201 0.391755
LTO 0.305787 0.099201 1.000000 0.135676
LCU 0.270083 0.391755 0.135676 1.000000
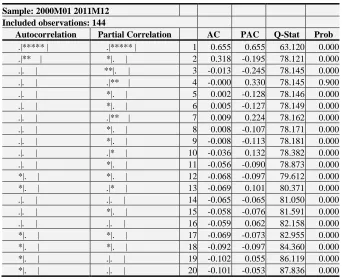
Table 5.1 shows that the highest correlation coefficient value is 0.3912 which is relatively low. It is well below 0.8. Since the highest correlation numbers are lower than 0.8 the results clearly show that none of the independent variables are highly correlated and no multicollinearity amongst independent variables exist. The correlogram of squared residuals was also conducted to complement the ARCH test in detecting heteroscedasticity.
Table-2. Correlogram of squared residuals
Sample: 2000M01 2011M12 Included observations: 144
Autocorrelation Partial Correlation AC PAC Q-Stat Prob
.|***** | .|***** | 1 0.655 0.655 63.120 0.000
.|** | *|. | 2 0.318 -0.195 78.121 0.000
.|. | **|. | 3 -0.013 -0.245 78.145 0.000
.|. | .|** | 4 -0.000 0.330 78.145 0.900
.|. | *|. | 5 0.002 -0.128 78.146 0.000
.|. | *|. | 6 0.005 -0.127 78.149 0.000
.|. | .|** | 7 0.009 0.224 78.162 0.000
.|. | *|. | 8 0.008 -0.107 78.171 0.000
.|. | *|. | 9 -0.008 -0.113 78.181 0.000
.|. | .|* | 10 -0.036 0.132 78.382 0.000
.|. | *|. | 11 -0.056 -0.090 78.873 0.000
*|. | *|. | 12 -0.068 -0.097 79.612 0.000
*|. | .|* | 13 -0.069 0.101 80.371 0.000
.|. | .|. | 14 -0.065 -0.065 81.050 0.000
.|. | *|. | 15 -0.058 -0.076 81.591 0.000
.|. | .|. | 16 -0.059 0.062 82.158 0.000
*|. | *|. | 17 -0.069 -0.073 82.955 0.000
*|. | *|. | 18 -0.092 -0.097 84.360 0.000
*|. | .|. | 19 -0.102 0.055 86.119 0.000
*|. | .|. | 20 -0.101 -0.053 87.836 0.000
© 2015 AESS Publications. All Rights Reserved.
1183
Table-3. Augmented Dickey Fuller unit test
Level First Difference
Variables Constant Constant and
Trend
None Constant Constant
and trend
None
LEX -1.60 -2.28 1.28 -7.35* -7.4* -7.05*
LGDP -0.73 -2.59 1.93*** -4.88* -4.85* -4.23*
LCU -1.95 -1.96 -0.28 -4.33* -4.30* -4.36*
LREER -2.33 -2.23 -2.2** -4.11* -4.18* -4.15*
LTO -1.44 -2.20 -1.41 -9.12* -9.14* -8.97*
CV (1%) -3.53 -4.10 -2.60 -3.54 -4.11 -2.60
CV (5%) -2.91 -3.48 -1.95 -2.91 -3.49 -1.95
CV (10%) -2.59 -3.17 -1.61 -2.60 -3.17 -1.61
Source:http://www.resbank.co.za/Research/Statistics/Pages/OnlineDownloadFacility.aspx
Notes
(1) The Null Hypothesis, Ho= variables have one roots.
(2) *,**and*** represent a stationary variable at 1%, 5% and 10% level of significance respectively.
Table-4.Phillips-Peron (PP) Unit Root Test
Level First Difference
Variables Constant Constant and
Trend
None Constant Constant
and trend
None
LEX -1.78 -3.42 -2.58 -13.97* -21.55* -10.70*
LGDP -0.68 -2.10 2.84 -4.38* -4.33* -4.30*
LCU -1.84 -1.88 -0.49 -6.36* -6.31* -6.39*
LREER -2.48 -2.38 -0.18 -7.73* -7.73* -7.80*
LTO -1.84 -1.88 -0.49 -6.36* -6.31* -6.40*
CV (1%) -3.53 -4.10 -4.10 -3.53 -4.10 -2.60
CV (5%) -2.90 -3.48 -3.48 -2.91 -3.48 -1.95
CV (10%) -2.59 -3.17 -3.67 -2.60 -3.17 -1.61
Source data: http://www.resbank.co.za/Research/Statistics/Pages/OnlineDownloadFacility.aspx
Notes
(1) The Null Hypothesis, Ho= variables have one roots.
(2) *,**and*** represent a stationary variable at 1%, 5% and 10% level of significance respectively.
(3) CV represents Critical value.
Table-5. Presentation of results
Variable Coefficient Standard error z-statistic P-value
C 2.198244 0.573746 3.831389 0.0000
LCU 1.750573 0.182538 9.590184 0.0000
LTO 0.037012 0.006310 5.865599 0.0000
LREER 0.550590 0.063148 8.719043 0.0001
© 2015 AESS Publications. All Rights Reserved.
1184
Table-6. Variance Equation
Variable Coefficient Standard error z-statistic P-value
C 0.064155 0.066387 0.966373 0.3339
RESID(-1)^2 2.419967 0.315017 7.682020 0.0000
GARCH(-1) -0.004952 0.032312 -0.153244 0.8782
LREER -0.006409 0.007305 -0.877374 0.3803
LCU -0.010078 0.023422 -0.430268 0.6670
LTO 0.003315 0.001208 2.744001 0.0061
R-squared 0.145729 Adjusted R-squared 0.127423 Durbin-Watson stat 0.676449
This means that an increase in capacity utilization will result in increase in export volumes. A country‟s capacity utilization is its total possible production capacity that is actually being used. Jessica (2004) noted that capacity utilization promotes exports by inducing firms to export more and therefore uses resources more efficiently by making use of otherwise idle resources. Trade openness has a positive sign. One percent increase in trade openness will result in 0.037% increase in exports. The coefficient of trade openness is positive and it is statistically significant. Trade openness can improve exports as there will be limited hindrances to trade between countries. LREER has a positive coefficient. This is consistent with economic theory. Exchange rates movements affects export competitiveness according to the flow oriented model. When the rand depreciates, the demand for South Africa‟s exports increases. A depreciation of the rand will cause the demand for South African exports to increase as they will become more competitive in terms of lower prices to international buyers. This will result in them gaining competitiveness on the international market.
12. CONCLUSION AND DISCUSSION OF RESULTS
The main aim of this section was to present results of this study. In order to achieve this objective, the chapter began by looking at the descriptive statistics of the two major variables, REER and Exports. The variables also showed excess kurtosis and not normally distributed. This, however, raised questions about the stationary of the variables of the study. Stationary tests were conducted and all the variables were not stationary at levels. However, they were stationary after first differencing.
Furthermore collinearity test was performed to see if there was any correlation between the explanatory variables. The collinearity test denoted that the variables LGDP and LTO were correlated and this resulted in one of the variables with highest p value being dropped from the equation.
© 2015 AESS Publications. All Rights Reserved.
1185
GARCH model reduced the problems of normality in the variables seven times than the non-normal GARCH model. Furthermore non-normal GARCH model eliminated the problem of serial correlation. Diagnostic tests conducted in this study showed that the model was good. The Q-statistic test also showed that there was no serial correlation in the residuals. The GARCH model also eliminated the problems of the ARCH. Trade Openness was shown to have a positive 3, 7 percent but insignificant impact on export performance but the exchange rate has a strong positive impact of 55.5 percent on export performance. Capacity utilisation has a positive impact on export performance of 17.5 percent. Results obtained from this study were all supported by existing empirical studies and by prevailing economic theory
13. POLICY RECOMMENDATIONS
Results in this study show a number of policy implication. A major caution is that exchange rate be carefully managed to ensure a stable non-volatile behaviour of the rand so as not to hamper export growth. If policymakers wish to target exports, it is likely that policies which enhance the level of economic activity for exporters be implemented. Export Marketing Assistance Scheme (EMA), Export Marketing and Investment Assistance Scheme (EMIA) should receive sound funding from government so that such schemes can effectively assist exporters in penetrating new markets.
Fluctuations in exchange rate have a significant negative impact on the performance of exports. Since most South African exporters are risk averse, the government should consider developing hedging facilities and institutions that can protect its exporters against exchange risk.
Furthermore, the current objective of South Africa in ensuring sustainable economic growth through increased exports should be substantiated by a stable and competitive exchange rate, viable fiscal and monetary policies as well as structural reforms that contribute to decline in per unit cost of production and the improvement in international competitiveness of South African exporters.
REFERENCES
Abdulrahman, A.-A., 1997. Saudi non-oil export: The challenges and prospect. Presented at the Annual
Meeting of Middle East Studies Association of North America (MESA), 22-25 November, 1997.
Aristotelous, K., 2001. Exchange-rate volatility, exchange-rate regime, and trade volume: Evidence from the
UK-US export function (1889-1999). Economic Letters, 72(1): 87-94.
Aziakpono, M., T. Tsheole and P. Takaendesa, 2005. Real exchange rate and its effects on trade flows: New
evidence from South Africa. Biennial Conference of Economic Society of South Africa, September
7-9, 2005, Durban.
Bah, I. and H. Amusa, 2003. Real exchange rate volatility: Evidence from South Africa‟s exports to the United
States. The African Finance Journal. In Takaendesa, P. 2005. Real Effective Exchange Rate and
© 2015 AESS Publications. All Rights Reserved.
1186 Bell, T. and R. Cassim, 1999. Competitiveness, international trade and finance in a minerals-rich economy:
The case of South Africa. In J. M. Fanelli and R.Medhora (Eds). Finance and Competitiveness in
Developing Countries. International Development Research Centre.
Brenton, P., 2007. Export diversification: A policy portfolio approach. Available from
www.growthcommission.org [Accessed 5 May 2012].
Business Day, 2003. Rand rally pushes manufacturing deeper into recession raising fears of big job cuts.
Available from
http://business.highbeam.com/3548/article-1G1-108650293/rand-rally-pushes-manufacturing-deeper-into-recession [Accessed 09 October 2003].
Edwards, L., 2005. Determinants of export supply. School of economics. University of Cape Town. Available
from http://www.worldbank.org/afr/wps/wp95.pdf [Accessed 19-10-12].
Guerin, J.L. and A. Lahreche-Revil, 2001. The impact of estimating the fundamental equilibrium exchange
rate of central and Eastern European countries the EMU enlargement perspective. Available from
http://www.cepii.fr/\/anglaisgraph/workpap/pdf/2003/wp03-05.pdf [Accessed 18/10/2012 at 09h00].
Hasan, V., 2001. The impact of exchange rate in Turkey on trade flows. Journal of Economics and Social
Research, 4(1): 83-89.
Hericout, J. and S. Poncet, 2012. Exchange rate volatility, financial constraints, and trade empirical evidence
from Chinese firms. Policy Research Working Paper No. 6638.
Jessica, B., 2004. A firm‟s capacity utilization and its relationship with foreign competition in selected
countries. Available from
https://repository.library.georgetown.edu/bitstream/handle/10822/555969/etd_jb427.pdf?seque.
nce=4 [Accessed 18/10/2014 at 15h00].
Lira, S., 2007. The impact of exchange rate volatility on South African export to the United States. Maseru:
Department of Economics, National University of Lesotho.
Musonda, A., 2001. Exchange rate volatility and non – traditional exports performance: Zambia, (1965 –
1999). A Paper Presented at the AERC Workshop, Nairobi.
Nwidobie, B.M., 2011. An impact analysis of foreign exchange rate volatility on Nigeria‟s export
performance. European Journal of Economics, Finance and Administrative Sciences, 37(1): 52-53.
South African Reserve Bank, 2013. Annual Economic Report. Available from
www.reservebank.co.za/internet [Accessed 20 June 2013].
Todini, R. and T. Munyama, 2005. Exchange rate volatility and exports in South Africa. Annual Forum 2005.
Vaidya, K.A., 2006. Globalisation: International blocks and organisation. USA: ABC-CLIO.
Van de Merwe, E.J. and S.L. Mollentze, 2009. The monetary economics. Monetary Economics in South
Africa. Cape Town ; Oxford: Oxford University Press Southern Africa.
Verena, 2006. Available from http://www.investorwords.com/1808/exchange_rate_risk.html [Accessed
05/07/2013 at 16h52].