P E R S P E C T I V E S
Transfusion Safety: Lessons Learned In
Ibero-America And Considerations For Their
Global Applicability
This article was published in the following Dove Press journal: International Journal of Clinical Transfusion Medicine
Jose Ramiro Cruz
Independent Consultant, Ashburn, VA, USA
Abstract:The safety of blood used for transfusions has historically been the main focus of the international health community. In the Americas, during thefirst decade of the 21st Century, the attention switched to the patients who need transfusions and to the individuals who donate blood, that is, to transfusion safety. Timely and universal access to blood components implied adequate availability to sufficient blood components by patients who require transfusions in every hospital of every country. Clinical conditions and local non-medical factors influence decisions to admit and transfuse ill individuals. Locally-developed pertinent transfusion guidelines contribute to better estimate blood needs. Replacement blood donation hinders access to blood stocked in the hospitals blood banks and results in excessive component expiry andfinancial losses. Focusing on patient transfusion needs and on patient outcomes permits implementing national blood collection, proces-sing and distribution, in consonance with the national health system. Analyses of general health conditions, by using the national Human Health Indexes, and the operational characteristics of blood services, by using the blood center density index, permit identification of locally pertinent interventions to improve transfusion safety. For this article, the analytical approaches used in Ibero-America were applied to blood data from South-East Asian and African countries. Data collection and validation were identified as priorities for Asian countries. Estimating blood component requirements at the local level and adjusting blood collection, processing and distribution systems are important in Africa.
Keywords:blood safety, transfusion safety, blood donors, Human Health Index, Ibero-America
Introduction
The international health community has historically focused on reducing the infec-tious potential of blood for transfusions, that is, on blood safety. The first World Health Assembly (WHA) resolution on blood services, adopted in 1975, sought to curtail commercial blood collection and plasmapheresis in developing countries. The concerns of the WHA were the possible negative consequences of such activities for donors’ health and for the safety of the resulting products.1,2 The 1975 resolution urged countries to instead promote blood services based on volun-tary blood donation (VBD) and to protect the health of both blood donors and recipients. It was not until 1987 that the WHA discussed blood safety issues again, as part of the global strategy for AIDS prevention and control,3 approach that persisted within the World Health Organization (WHO) for two decades.4–6 The strategy for AIDS control laid the groundwork for the Global Safe Blood Initiative and provided the framework for initial actions to strengthen blood services by the
Correspondence: Jose Ramiro Cruz Independent Consultant, 44408 Maltese Falcon Square, Ashburn, VA 20147, USA Tel +1 703 729 0875
Email [email protected]
International Journal of Clinical Transfusion Medicine
Dovepress
open access to scientific and medical research
Open Access Full Text Article
International Journal of Clinical Transfusion Medicine downloaded from https://www.dovepress.com/ by 118.70.13.36 on 22-Aug-2020
WHO African Region7,8 and the Pan American Health Organization9 (PAHO). During the first decade of the 21st century, the WHA established a global plan for uni-versal access to safe blood10 with five components: a) development of nationally coordinated blood transfusion services, b) exclusive collection of blood from VBD, c) quality-assured laboratory testing, d) reduction of inap-propriate transfusions, and e) implementation of quality blood collection and distribution systems.
In the Americas, by contrast, the First Pan American Conference on Blood Safety, held in 2003, developed an innovative plan to improve transfusion safety in the Region by 201011through: a) proper collection and preparation of sufficient blood components, b) timely access to blood com-ponents for patients, c) highest level of safety for blood products, d) appropriate transfusion practices, and e) efficient use of national resources. The strategies were: a) planning and management of the national blood network system, based on local needs b) promotion of VBD, through user-friendly blood collection services, c) quality assurance based on locally pertinent standards, and d) appropriate use of blood and blood components based on hospital-adapted transfusion guidelines. This article reviews lessons learned from the implementation of the Regional Plan for Transfusion Safety in Ibero-American countries and provides insights on how those lessons may be applicable in other regions of the world. The article takes as points of departure the following key concepts:
Global blood safety is not a measure of the risk of transmission of infectious agents through transfusion, but actually the goal of attaining the safest possible blood for every patient in every country of the world. To attain it, blood services are expected to collect blood from volun-tary altruistic donors only, to carry out universal, pertinent and precise laboratory blood testing, and to protect blood components from contamination during their preparation and storage. Local surveillance of transfusion-transmissi-ble infections (TTI), training of blood service staff, national oversight by health authorities and collaboration among stake holders are considered basic in the quest for global blood safety.12
VBD is that which is made with the purpose of con-tributing to the national sufficiency and general timely access to blood, without the intention of benefiting a specific patient. Voluntary donors do not profit by collect-ing either money or other material benefits.13
Replacement blood donation (RBD) is that which is made on behalf of a specific patient in response to a
hospital requirement and prior to that patient being admitted, treated or discharged by the hospital. The patients or their family members are responsible for recruiting replacement donors.14
Transfusion safety is the expression of the pursuit of global blood safety in a given population while ensuring the protection of both the individuals who donate blood and those who receive it, and also making efficient use of local resources. Maximum transfusion safety can be achieved when ethical principles, locally pertinent clinical guidelines, and quality assurance measures are applied.15
Country Data
The 2016 WHO Global Status Report on Blood Safety and Availability16 was used as the source of all country data for 2013. This publication contains information collected from 178 countries as part of the Global Data Base on Blood Safety. The national data are presented in 12 annexes which detail for each nation the numbers of blood centers, of whole blood donations from VBD, RBD and paid donors, and of apheresis donations, meth-ods and coverage of TTI screening, prevalence of TTI markers, numbers of blood components prepared and transfused, and indicators of policy, governance and qual-ity assurance. The IBCO data from the PAHO report on the Supply of Blood for Transfusion in Latin American and Caribbean Countries 2012–2013,17published in 2015, are part of the Global Database and are usually included in the WHO Global Reports. Post-2013 national information for IBCO was obtained from a 2017 report on blood supply for the Americas,18 while that for specific blood services was provided by IBCO national health authorities, as indicated in each corresponding table.19–21
Lessons
National Requirements For Blood
Components Are Determined Locally
And Cannot Be Estimated Using Generic
Global Indicators
Accurate estimates of patient needs are essential if blood services are to provide sufficient components for all who need transfusions22 and to achieve the goal of universal access to blood.23 Indicators that have been proposed for estimating yearly requirements at the national level include (a) 1–5% of the population,23–25 (b) the number of hospital beds multiplied by 5–1526 and (c) 0.40 units/ patient admitted to hospitals.27 Recently, the Lancet
International Journal of Clinical Transfusion Medicine downloaded from https://www.dovepress.com/ by 118.70.13.36 on 22-Aug-2020
Commission on Global Surgery recommended that coun-tries collect at least 15 units/1000 population in order to provide adequate surgical care.28
In 2013, IBCO had 600,304,000 inhabitants and 1,211,353 hospital beds. Based on an annual collection rate equal to 3% of the population—considered sufficient by WHO to cover all needs—the estimated requirement was 18,009,120 units, equivalent to 226% of the actual documented collection of 8,337,141 units. The latterfigure is 98% of the estimate that would be obtained by multi-plying the number of hospital beds by seven, or 8,479,471. The similarity between these two numbers suggests that estimates based on hospital beds might be sufficiently accurate to guide annual collection. Examining the indivi-dual country donation rates proves this conclusion incor-rect: national collection rates based on units/hospital bed were 4.44–13.92 (median= 9.61), and only three countries collected 7 units/bed/year; those with collection rates below 7/bed discarded 10–33% of their red blood cells (RBC), suggesting that hospitals beds do not provide a valid criterion to either estimating needs or assessing
suf-ficiency of blood for transfusion in IBCO.
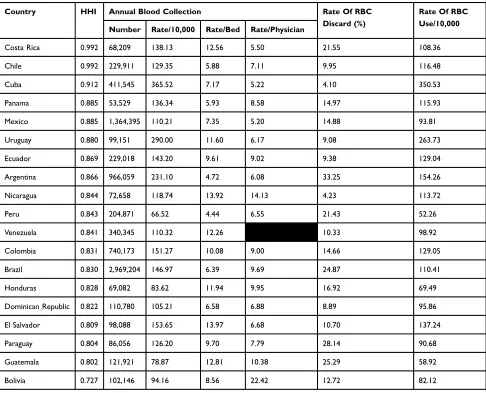
Table 1 lists IBCO according to their Human Health Index (HHI, range 0.727–0.992, median 0.843), which is a composite of life expectancy at birth29 and provides more meaningful context for health issues than national income. Blood collection rates are expressed as units/10,000 inhabi-tants. According to this indicator (range 66.52–365.52, med-ian 129.35), Cuba collected 5.5 times more blood than Peru, three countries had rates above 200, and four had rates below 100. Units collected/physician ranged from 5.20 to 22.42 (median 7.45). The numbers of blood units collected/hospital bed were independent of HHI (rs= −0.294, p=0.221193),
numbers of units/physician were inversely correlated with HHI (rs= −0.594,p=0.009411) and collections per 10,000
inhabitants were directly correlated with HHI (rs=0.4609,p=
0.04751). The proportions of RBC discarded (range 4.10– 33.25, median 14.66) did not correlate with units collected/ population (rs=−0.2179, p =0.3866), indicating that RBC
disposal was not due to excessive collection by those coun-tries with more blood available. Six councoun-tries, including two with collection rates below 100/10,000 population, discarded more than 20% of their RBC. The national rates of RBC used/10,000 population (range 52.26–350.53, median 110.41) not only correlated more strongly with HHI (rs=0.4917,p=0.03238) than the corresponding
collec-tion rates but also demonstrated that only two countries
utilized more than 200 units/10,000 inhabitants and eight used less than 100.
In order to estimate blood needs, it is important to understand how blood is used in clinical settings. In Guatemala, two national high-complexity reference hospi-tals in the capital city transfused 40 and 72 units/1000 admissions, respectively; eight regional reference hospitals transfused 8–51; 16 provincial hospitals used 7–40; and two district hospitals transfused 13 and 16 units/1000 patients.15 Overall, in Guatemala’s 33 national hospitals, 45% of all patients were cared for at the emergency wards. Wide variations, up tofive-fold, were seen in the annual use of RBC among hospitals of the same level of complex-ity when admissions and emergencies combined were used as the denominator.15
Observations in Nicaragua30showed significant monthly variations in hospital admissions, in the proportion of those who receive RBC, and in the numbers of RBC units admi-nistered. In addition to the patients’clinical condition, doc-tors’decisions to admit and/or transfuse patients were also influenced by factors such as distance, travel time and expenses involved in reaching the hospital, and the potential of losing patients to follow-up, indicating that the applica-tion of pertinent locally developed transfusion guidelines facilitates more reliable estimation of blood needs.
The Development Of Blood Services
Depends On The General Development
Of The National Health System
In the Region of the Americas, the national availability of blood for transfusions, expressed as units/10,000 population, is inversely correlated with national mater-nal mortality ratios (MMR).31 National rates of RBC use/10,000 population correlate directly with HHI (rs=0.4917, p =0.032384), and higher utilization of RBC is associated with lower MMR and infant mortality rates15 (IMR). There is a direct correlation between MMR and IMR (rs=0.8064, p =0.000093). National
rates of blood collection per physician are directly cor-related with both national MMR (range: 16.0–229.0, median 61.6; rs=0.5996, p=0.008479) and IMR (range:
4.2–24.8; median 14.6; rs=0.6118, p =0.011874),
sug-gesting that the higher collection rates reflect shortages of physicians in deficient health care facilities rather than augmented blood collection. This would explain why transfusion rates in IBCO tend to be lower in those countries with less access to renal and liver
International Journal of Clinical Transfusion Medicine downloaded from https://www.dovepress.com/ by 118.70.13.36 on 22-Aug-2020
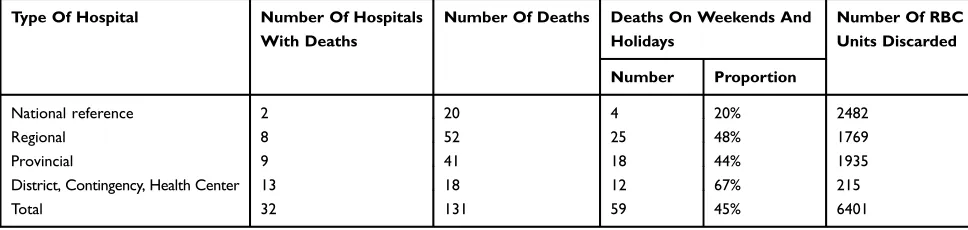
transplants and with lower numbers of diagnosed cases of hemophilia.15 In Guatemala, intra-hospital maternal deaths associated with bleeding commonly occur during weekends and national holidays, and in high-risk remote areas (Table 2). During working days, deaths are more likely to occur between 11 pm and 5 am. In Bolivia, mothers with delivery complications did not have access to blood units stored in the hospitals because they were deposited for specific patients as a requisite for elective surgery (aka, replacement donation).32This phenomenon results not only in poor patient management but also inefficient use of dedicatedly stocked blood. In two consecutive years, 131 mothers died due to peripartum hemorrhage in 32 Guatemalan hospitals where 6401
RBC units, or 49 units per deceased woman, were dis-carded during the same period.19,20 Focusing on patient transfusion needs and patient outcomes is necessary for implementing adequate national blood collection, pro-cessing and distribution processes.
More Blood Banks Do Not Result In
Better Availability Or Access To Blood
Components
In 2015, there were 2254 blood processing centers in IBCO.18 Fifteen countries had fewer than 100 such centers while the four nations with federal-type gov-ernment -Argentina, Venezuela, Brazil and Mexico-had 259, 339, 530 and 572 centers, respectively (Table 3), a
Table 1Blood Collection And Use In Ibero-American Countries, 2013
Country HHI Annual Blood Collection Rate Of RBC
Discard (%)
Rate Of RBC Use/10,000
Number Rate/10,000 Rate/Bed Rate/Physician
Costa Rica 0.992 68,209 138.13 12.56 5.50 21.55 108.36
Chile 0.992 229,911 129.35 5.88 7.11 9.95 116.48
Cuba 0.912 411,545 365.52 7.17 5.22 4.10 350.53
Panama 0.885 53,529 136.34 5.93 8.58 14.97 115.93
Mexico 0.885 1,364,395 110.21 7.35 5.20 14.88 93.81
Uruguay 0.880 99,151 290.00 11.60 6.17 9.08 263.73
Ecuador 0.869 229,018 143.20 9.61 9.02 9.38 129.04
Argentina 0.866 966,059 231.10 4.72 6.08 33.25 154.26
Nicaragua 0.844 72,658 118.74 13.92 14.13 4.23 113.72
Peru 0.843 204,871 66.52 4.44 6.55 21.43 52.26
Venezuela 0.841 340,345 110.32 12.26 10.33 98.92
Colombia 0.831 740,173 151.27 10.08 9.00 14.66 129.05
Brazil 0.830 2,969,204 146.97 6.39 9.69 24.87 110.41
Honduras 0.828 69,082 83.62 11.94 9.95 16.92 69.49
Dominican Republic 0.822 110,780 105.21 6.58 6.88 8.89 95.86
El Salvador 0.809 98,088 153.65 13.97 6.68 10.70 137.24
Paraguay 0.804 86,056 126.20 9.70 7.79 28.14 90.68
Guatemala 0.802 121,921 78.87 12.81 10.38 25.29 58.92
Bolivia 0.727 102,146 94.16 8.56 22.42 12.72 82.12
Notes:Adapted with permission from Cruz JR. Satisfacción de los requerimientos de hemocomponentes [Satisfaction of the requirements for blood components]. In:
Cortes-Buelvas A, Cabezas-Belalcazar AC, García-Castro Gutiérrez M, Urcelay-Uranga S, editors. Promoción de la donación voluntaria de sangre en Iberoamérica.Cali, GCIAMT. 2017:61–70.15
Data obtained from these studies.16,17
: Not available. HHI/Collection rate per 10,000 correlation: rs=0.4609,p=0.04751. HHI/
collection rate per physician correlation: rs=−0.5940,p=0.009411. HHI/RBC use rate correlation: rs=0.4917,p=0.003238.
Abbreviations:HHI, Human Health Index; RBC, red blood cells.
International Journal of Clinical Transfusion Medicine downloaded from https://www.dovepress.com/ by 118.70.13.36 on 22-Aug-2020
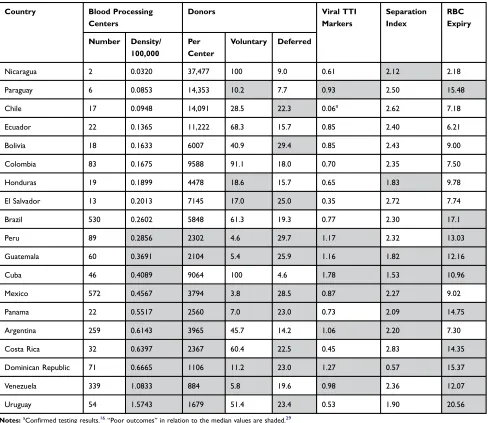
result of the blood services being set up and managed by each autonomous state/province. The mean number of blood units processed annually per center in each country varied from 884 to 37,477 (median 4478,
Table 3). Given that smaller centers are more prone to producing inaccurate laboratory testing results33,34 and to being financially inefficient,35 assessing the availability of blood and the operational efficacy of such processing systems is important. Using the num-ber of blood processing centers/100,000 inhabitants as an indicator, it becomes clear that countries with blood center density indexes (BCDI) higher than the median process fewer units per center, have lower proportions of VBD, defer more prospective donors, have higher prevalence of TTI markers, prepare fewer components per unit, and discard more RBC due to expiry as compared to countries with indexes lower than the median (Table 3, Chi2=14.93, p <0.0001). The BCDI show no correlation with national rates of RBC use (rs=0.0754, p =0.760329), indicating that more blood
processing centers do not result in increased availabil-ity of or access to blood components.
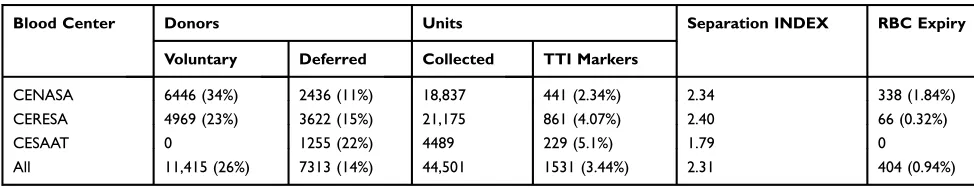
In Guatemala, justfive of the existing 60 blood centers processed 42% of all the units collected in the country (Table 4).20In Honduras, the three blood centers managed by the Red Cross accounted for 50% of national blood collection in 2018. Processes and operational results dif-fered among the three Honduran centers (Table 5), afi nd-ing that led to closure of the smallest center in 2019.21
These data, and the impact of reducing the processing centers from 37 to two in Nicaragua,14 demonstrate that planning and implementing national blood systems with the suitable number of centers can result in optimum availability of blood components and efficient use of national resources, including blood.
Regular Voluntary Donation Is A Major
Contributor To Transfusion Safety
During 2015, there were 4.9 million VBD and 6.7 million RBD in IBCO.18The respective deferral rates were 15.5% and 24.4%, amounting to 2.4 million individuals. Limited-scope observations point to low hemoglobin and risk beha-viors for infectious disease transmission as major causes of deferral in both VBD and RBD. Unjustified deferral reasons include lipemic plasma, inappropriate veins, recent food intake, menstruation and over-stocked blood type.35,36 Despite these common factors, VBD were deferred in lower proportions (range: 4.63–23.57; median: 17.98) than RBD (Range: 7.97–33.01; Median 23.29). Lower deferral rates translate into more blood available and more efficient use of the resources to register and screen donors. With the pre-donation interview lasting 15 mins, the 2,380,501 defer-rals represent 316.5 full-time employees. The 57% excess associated with RBD compared to VBD equals 124 full-time jobs. Once allowed to donate, VBD, especially those who have donated before, are less likely to have adverse reactions to donation37–40 and markers for TTI.41,42 The attributable monetary loss of 323,013 TTI-reactive dona-tions in 2015 is US$40.85 million.
Blood components derived from units that are not deposited for specific patients are available to any person in need of a transfusion. RBD not only limits access to available blood but also deters VBD, as the public is inclined to save their blood for family members or friends who may call on them as RBD.11Eliminating the require-ment for blood replacerequire-ment is the most important inter-vention to achieve universal VBD, as has been shown in Nicaragua and Buenos Aires.12,14
In 2008, PAHO recommended that blood systems managers educate regular blood donors and to have them donate twice a year43 The purpose of the education
Table 2Maternal Deaths Due To Hemorrhage In Public Hospitals Of Guatemala, 2015–2016
Type Of Hospital Number Of Hospitals
With Deaths
Number Of Deaths Deaths On Weekends And
Holidays
Number Of RBC Units Discarded
Number Proportion
National reference 2 20 4 20% 2482
Regional 8 52 25 48% 1769
Provincial 9 41 18 44% 1935
District, Contingency, Health Center 13 18 12 67% 215
Total 32 131 59 45% 6401
Note:Data obtained from these studies.19,20
Abbreviation:RBC, red blood cells.
International Journal of Clinical Transfusion Medicine downloaded from https://www.dovepress.com/ by 118.70.13.36 on 22-Aug-2020
process should be to provide the individuals with the capacity and competences to decide to become blood donors, to protect their health, to understand why their blood donations are important for society, and to donate
blood repeatedly.43 Limiting regular donations to two annually allows groups of females and males to donate together, reduces the risk of draining hemoglobin to unacceptable levels in repeat donors, and facilitates
Table 3Operational Indicators Of Blood Centers, Ibero-American Countries, 2015
Country Blood Processing
Centers
Donors Viral TTI
Markers
Separation Index
RBC Expiry
Number Density/
100,000
Per Center
Voluntary Deferred
Nicaragua 2 0.0320 37,477 100 9.0 0.61 2.12 2.18
Paraguay 6 0.0853 14,353 10.2 7.7 0.93 2.50 15.48
Chile 17 0.0948 14,091 28.5 22.3 0.06a
2.62 7.18
Ecuador 22 0.1365 11,222 68.3 15.7 0.85 2.40 6.21
Bolivia 18 0.1633 6007 40.9 29.4 0.85 2.43 9.00
Colombia 83 0.1675 9588 91.1 18.0 0.70 2.35 7.50
Honduras 19 0.1899 4478 18.6 15.7 0.65 1.83 9.78
El Salvador 13 0.2013 7145 17.0 25.0 0.35 2.72 7.74
Brazil 530 0.2602 5848 61.3 19.3 0.77 2.30 17.1
Peru 89 0.2856 2302 4.6 29.7 1.17 2.32 13.03
Guatemala 60 0.3691 2104 5.4 25.9 1.16 1.82 12.16
Cuba 46 0.4089 9064 100 4.6 1.78 1.53 10.96
Mexico 572 0.4567 3794 3.8 28.5 0.87 2.27 9.02
Panama 22 0.5517 2560 7.0 23.0 0.73 2.09 14.75
Argentina 259 0.6143 3965 45.7 14.2 1.06 2.20 7.30
Costa Rica 32 0.6397 2367 60.4 22.5 0.45 2.83 14.35
Dominican Republic 71 0.6665 1106 11.2 23.0 1.27 0.57 15.37
Venezuela 339 1.0833 884 5.8 19.6 0.98 2.36 12.07
Uruguay 54 1.5743 1679 51.4 23.4 0.53 1.90 20.56
Notes:aConfirmed testing results.16“
Poor outcomes”in relation to the median values are shaded.29 Abbreviations:TTI, transfusion-transmissible infections; RBC, red blood cells.
Table 4Blood Processing In Guatemala, 2016
Institution Larger Centers Smaller Centers Institutional Mean
Number Of Units
Number Total Units Number Total Units
Ministry of Health 2 30,089 (34%) 31 57,353 (66%) 2650
Social Security 2 17,560 (67%) 3 8552 (33%) 5224
Private sector 1 7636 (41%) 21 10,970 (58%) 846
All 5 55,285 (42%) 55 76,875 (58%)
Annual mean 11,057 1398 2203
Note:Data obtained from this study.20
International Journal of Clinical Transfusion Medicine downloaded from https://www.dovepress.com/ by 118.70.13.36 on 22-Aug-2020
programming extramural collections. Additionally, should unforeseen circumstances suddenly deplete the RBC stock, there would be enough eligible regular donors to replenish it. The initiative “Pledge2 save lives” was cre-ated with those considerations in mind.43
National Blood Systems Based On
Consolidated, Stand-Alone Blood
Processing Centers Which Focus On
Serving Blood Donors And Satisfying
Patient Needs Are More Effective And
Contribute To Public Health
Considering that blood components for transfusion are essential medicines and prepared locally using biological materials obtained from multiple individuals, PAHO pro-posed that consolidated processing facilities be responsible for distributing sufficient blood components to predeter-mined hospitals.42 Fewer processing centers are easier to oversee and make it easier to standardize operating proce-dures, implement quality assurance, hire specialized per-sonnel, purchase and maintain equipment, procure consumables, acquire automated technology, manage donor and product information, reduce inequity in access to blood, and interact with public health and plasma frac-tionation institutions.33–35
The lessons described above are likely applicable in other parts of the world.
In 2013, 53 low- and lower-middle-income countries (LLMC) — 41 AFCO, 8 SECO and 4 IBCO — collected only 24% of the global blood supply and discarded the highest proportion of RBC among all income groups.16These nations often fail to provide adequate, equitable, consistent, safe and timely blood supplies to their populations.44,45Lack of govern-ment oversight, inadequate resources and fraggovern-mented national systems are some of the factors identified as responsible for poor access to safe blood,46,47 which in turn leads to poor patient outcomes.48,49Recognizing regional heterogeneities,50
identifying gaps within each country, focusing attention at the local levels, and using successful experiences as models51–54 have been suggested as the basis for improving transfusion safety in LLMC.Table 6summarizes the major health indica-tors for the three geographically distinct groups of countries. HHI (p≤0.0023) is highest in IBCO, while both MMR and IMR are highest (p<0.0001) in AFCO. All values for SECO are intermediate. The general main causes of death are infec-tious in AFCO, a mix of infecinfec-tious and non-infecinfec-tious in SECO, and non-infectious, including violence and road acci-dents, in IBCO. Understanding that the level of development of blood services depends on the general development of the health systems, it is not surprising that blood collection rates are lowest in AFCO, intermediate in SECO and highest in IBCO (p =0.0668); the prevalence of viral TTI markers among donors follows the reverse pattern (p≤0.0588,Table 6).
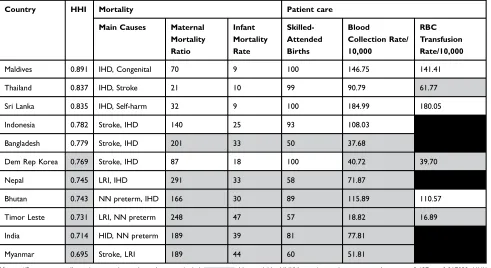
Table 7shows HHI, main causes of death, MMR, IMR, proportion of births attended by skilled personnel, blood collection rates, and the estimated RBC transfusion rates in SECO. Maldives, Thailand, and Sri Lanka have the highest HHI and are also countries with upper-middle income. The Democratic Republic of Korea and Nepal, with low income, fall in the middle of the table. HHI is inversely correlated with both MMR (p=0.008516) and IMR (p=0.000145), confirming that HHI is a more valid reference for health issues than national income. IMR is inversely correlated with skilled attendance at birth (p=000544), and IMR and MMR are positively correlated (p=0.000672), indicating that the level of health care determines both MMR and IMR and affects neonatal preterm mortality.“Poor outcomes”by all measures, including blood collection rates, are more likely to occur in countries with lower HHI. These rates seem to be lower than expected in at leastfive countries and in agreement with the assessment that SECO have an 11% deficit of blood based on the distribution of the global population.16 Reliable RBC transfusion rates could not be estimated for all countries.
Table 5Blood Collection And Processing, Honduran Red Cross National Program, 2018
Blood Center Donors Units Separation INDEX RBC Expiry
Voluntary Deferred Collected TTI Markers
CENASA 6446 (34%) 2436 (11%) 18,837 441 (2.34%) 2.34 338 (1.84%)
CERESA 4969 (23%) 3622 (15%) 21,175 861 (4.07%) 2.40 66 (0.32%)
CESAAT 0 1255 (22%) 4489 229 (5.1%) 1.79 0
All 11,415 (26%) 7313 (14%) 44,501 1531 (3.44%) 2.31 404 (0.94%)
Note:Data obtained from this study.21
International Journal of Clinical Transfusion Medicine downloaded from https://www.dovepress.com/ by 118.70.13.36 on 22-Aug-2020
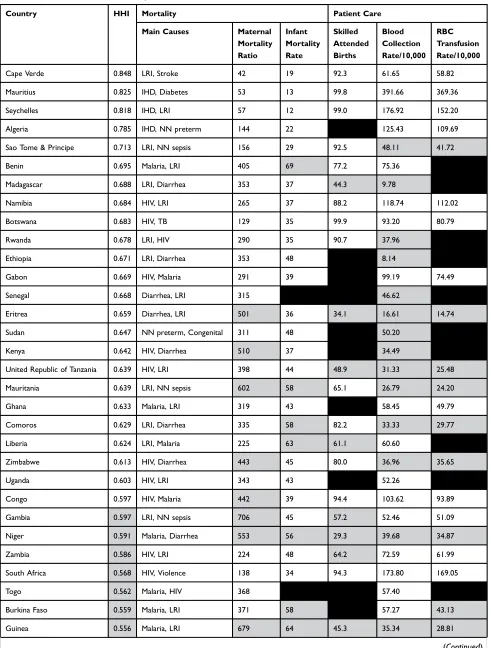
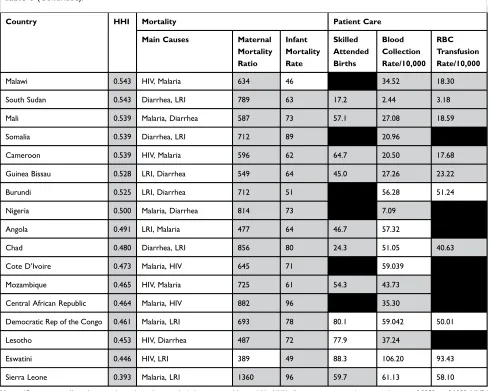
Table 8 shows HHI, main causes of death, MMR, IMR, proportion of births attended by skilled person-nel, blood collection rates, and the estimated RBC transfusion rates in AFCO. Cape Verde, Mauritius, and Seychelles, with HHI above 0.800, have low-med-ium, upper-medium and high income, respectively,
and, together with upper-middle-income Algeria, show the lowest MMR and IMR of all 48 AFCO. There is no correlation between HHI and blood collec-tion rates. The rate of RBC use correlates directly with HHI (p =0.03108) and inversely with both MMR (p
=0.00031) and IMR (p =0.00067), supporting the idea
Table 7Human Health Index, Mortality, And Patient Care, South-East Asian Countries, 2013
Country HHI Mortality Patient care
Main Causes Maternal
Mortality Ratio
Infant Mortality Rate
Skilled-Attended Births
Blood
Collection Rate/ 10,000
RBC Transfusion Rate/10,000
Maldives 0.891 IHD, Congenital 70 9 100 146.75 141.41
Thailand 0.837 IHD, Stroke 21 10 99 90.79 61.77
Sri Lanka 0.835 IHD, Self-harm 32 9 100 184.99 180.05
Indonesia 0.782 Stroke, IHD 140 25 93 108.03
Bangladesh 0.779 Stroke, IHD 201 33 50 37.68
Dem Rep Korea 0.769 Stroke, IHD 87 18 100 40.72 39.70
Nepal 0.745 LRI, IHD 291 33 58 71.87
Bhutan 0.743 NN preterm, IHD 166 30 89 115.89 110.57
Timor Leste 0.731 LRI, NN preterm 248 47 57 18.82 16.89
India 0.714 HID, NN preterm 189 39 81 77.81
Myanmar 0.695 Stroke, LRI 189 44 60 51.81
Notes:“Poor outcomes”in relation to the median values are shaded. : Not available. HHI/Maternal mortality ratio correlation: rs=−0.697,p=0.017032. HHI/
Infant mortality rate correlation: rs=−0.8859,p=0.000283. Maternal mortality ratio/Infant mortality rate correlation: rs=0.8604,p=0.000672. Infant mortality
rate/skilled-attended births correlation: rs=−0.8664,p=0.000544. HHI/collection rate correlation: rs=0.5364,p=0.04423.
Abbreviations:HHI, Human Health Index; RBC, red blood cells; IHD, ischemic heart disease; NN, neonatal; LRI, lower respiratory infections. Table 6Major Health Indicators Of Ibero-American, African And South-East Asian Countries, 2013
Countries Main causes of
death
Indicator
Measure HHI Maternal
Mortality Ratio
Infant Mortality Rate
Blood Collection/ 10,000
Viral TTI Makers (%)
RBC Use/ 10,000
African LRI, malaria, HIV, diarrhea
Median 0.597 492 48.5 50.64 7.800 49.79
Range 0.393 42 12 2.44 0.35 3.18
0.848 1360 96 391.66 22.62 369.36
South-East Asian IHD, stroke, neonatal conditions, LRI
Median 0.769 166 30 90.79 0.980 86.17
Range 0.695 21 9 18.82 0.32 16.89
0.891 291 47 184.99 6.82 180.05
Ibero-American IHD, violence, stroke, road accidents
Median 0.843 66.6 14.6 129.35 0.835 110.40
Range 0.727 16 4.2 66.52 0.34 52.26
0.992 229 24.8 365.52 1.82 350.53
Abbreviations:HHI, Human Health Index; TTI, transfusion-transmissible infections; RBC, red blood cells; LRI, lower respiratory infections; IHD, ischemic heart disease.
International Journal of Clinical Transfusion Medicine downloaded from https://www.dovepress.com/ by 118.70.13.36 on 22-Aug-2020
Table 8Human Health Index, Mortality, And Patient Care, African Countries, 2013
Country HHI Mortality Patient Care
Main Causes Maternal
Mortality Ratio
Infant Mortality Rate
Skilled Attended Births
Blood Collection Rate/10,000
RBC Transfusion Rate/10,000
Cape Verde 0.848 LRI, Stroke 42 19 92.3 61.65 58.82
Mauritius 0.825 IHD, Diabetes 53 13 99.8 391.66 369.36
Seychelles 0.818 IHD, LRI 57 12 99.0 176.92 152.20
Algeria 0.785 IHD, NN preterm 144 22 125.43 109.69
Sao Tome & Principe 0.713 LRI, NN sepsis 156 29 92.5 48.11 41.72
Benin 0.695 Malaria, LRI 405 69 77.2 75.36
Madagascar 0.688 LRI, Diarrhea 353 37 44.3 9.78
Namibia 0.684 HIV, LRI 265 37 88.2 118.74 112.02
Botswana 0.683 HIV, TB 129 35 99.9 93.20 80.79
Rwanda 0.678 LRI, HIV 290 35 90.7 37.96
Ethiopia 0.671 LRI, Diarrhea 353 48 8.14
Gabon 0.669 HIV, Malaria 291 39 99.19 74.49
Senegal 0.668 Diarrhea, LRI 315 46.62
Eritrea 0.659 Diarrhea, LRI 501 36 34.1 16.61 14.74
Sudan 0.647 NN preterm, Congenital 311 48 50.20
Kenya 0.642 HIV, Diarrhea 510 37 34.49
United Republic of Tanzania 0.639 HIV, LRI 398 44 48.9 31.33 25.48
Mauritania 0.639 LRI, NN sepsis 602 58 65.1 26.79 24.20
Ghana 0.633 Malaria, LRI 319 43 58.45 49.79
Comoros 0.629 LRI, Diarrhea 335 58 82.2 33.33 29.77
Liberia 0.624 LRI, Malaria 225 63 61.1 60.60
Zimbabwe 0.613 HIV, Diarrhea 443 45 80.0 36.96 35.65
Uganda 0.603 HIV, LRI 343 43 52.26
Congo 0.597 HIV, Malaria 442 39 94.4 103.62 93.89
Gambia 0.597 LRI, NN sepsis 706 45 57.2 52.46 51.09
Niger 0.591 Malaria, Diarrhea 553 56 29.3 39.68 34.87
Zambia 0.586 HIV, LRI 224 48 64.2 72.59 61.99
South Africa 0.568 HIV, Violence 138 34 94.3 173.80 169.05
Togo 0.562 Malaria, HIV 368 57.40
Burkina Faso 0.559 Malaria, LRI 371 58 57.27 43.13
Guinea 0.556 Malaria, LRI 679 64 45.3 35.34 28.81
(Continued)
International Journal of Clinical Transfusion Medicine downloaded from https://www.dovepress.com/ by 118.70.13.36 on 22-Aug-2020
that estimating national needs and assessing sufficiency of blood by using blood transfusion rates is more appropriate than using collection rates. Reliable data on RBC use were available for only 29 AFCO. Skilled attendance at birth correlates inversely with IMR (p
=0.000735), and IMR and MMR are directly correlated (p
<0.000001). In general,“poor outcomes”on all measures are more likely to occur in the 24 countries with lower HHI (p
=0.0001), corroborating that HHI segregates countries in a manner that facilitates understanding the relationships between national health services and local transfusion safety.
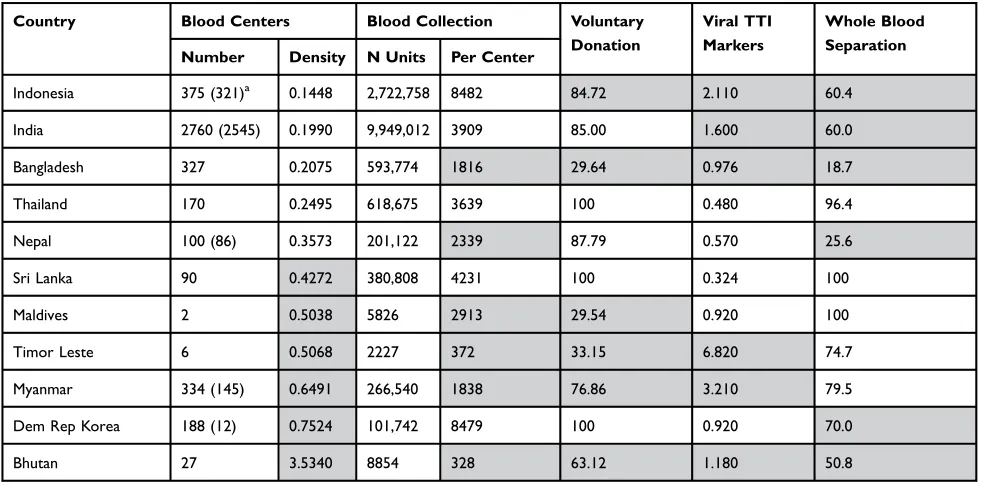
Table 9 shows operational indicators of blood centers in SECO, with a caveat: only 6 of the 11 countries included all their centers in their reports. The BCDI shown were calculated using the number of centers that
exist in the country, while the mean blood collection by center was estimated based on the number of centers included in the WHO report.16 Taking into consideration that lower BCDI regularly result in more units processed by each center, in the case of SECO a better approximation to operational efficiency may be achieved by examining the number of units collected per center in the six coun-tries with complete data. Sri Lanka and Thailand, with the largest number of units collected per center, have 100% VBD, have the lowest prevalence of TTI markers, and separate over 95% of their units into components. Maldives, with only two centers, processes all its units into components and shows the third lowest prevalence of TTI markers despite having only 29.54% VBD. Bangladesh, Timor Leste, and Bhutan reported the highest
Table 8(Continued).
Country HHI Mortality Patient Care
Main Causes Maternal
Mortality Ratio
Infant Mortality Rate
Skilled Attended Births
Blood Collection Rate/10,000
RBC Transfusion Rate/10,000
Malawi 0.543 HIV, Malaria 634 46 34.52 18.30
South Sudan 0.543 Diarrhea, LRI 789 63 17.2 2.44 3.18
Mali 0.539 Malaria, Diarrhea 587 73 57.1 27.08 18.59
Somalia 0.539 Diarrhea, LRI 712 89 20.96
Cameroon 0.539 HIV, Malaria 596 62 64.7 20.50 17.68
Guinea Bissau 0.528 LRI, Diarrhea 549 64 45.0 27.26 23.22
Burundi 0.525 LRI, Diarrhea 712 51 56.28 51.24
Nigeria 0.500 Malaria, Diarrhea 814 73 7.09
Angola 0.491 LRI, Malaria 477 64 46.7 57.32
Chad 0.480 Diarrhea, LRI 856 80 24.3 51.05 40.63
Cote D’Ivoire 0.473 Malaria, HIV 645 71 59.039
Mozambique 0.465 HIV, Malaria 725 61 54.3 43.73
Central African Republic 0.464 Malaria, HIV 882 96 35.30
Democratic Rep of the Congo 0.461 Malaria, LRI 693 78 80.1 59.042 50.01
Lesotho 0.453 HIV, Diarrhea 487 72 77.9 37.24
Eswatini 0.446 HIV, LRI 389 49 88.3 106.20 93.43
Sierra Leone 0.393 Malaria, LRI 1360 96 59.7 61.13 58.10
Notes:“Poor outcomes”in relation to the median values are shaded. : Not available. HHI/collection rate per population correlation: rs=0.2252,p=0.1232. MMR/
IMR correlation: rs=0.8036,p<0.00001. RBC use/MMR correlation: rs=−0.6044p=0.00031. RBC use/IMR correlation: rs=−0.577,p=0.00067. IM/Skilled-attended births
correlation: rs=−0.5655,p=0.000735. Skilled-attended births/RBC use correlation: rs=0.7723,p=0.000001.
Abbreviations:HHI, Human Health Index; RBC, red blood cells; IHD, ischemic heart disease; NN, neonatal; LRI, lower respiratory infections.
International Journal of Clinical Transfusion Medicine downloaded from https://www.dovepress.com/ by 118.70.13.36 on 22-Aug-2020
TTI prevalence rates and the lowest separation of blood into components. Total RBC discard was estimated at 31.2% and, as a consequence, 68% of RBC collected were actually transfused. Implementing universal VBD in SECO would result in improved availability and safety of blood. Nevertheless, in order to better understand the status of transfusion safety in SECO, the first priority should be the systematic local collection, validation, and analysis of data from blood centers and hospitals. Regulation and inclusion of unbanked directed blood transfusion47 and unlicensed blood brokers49 require spe-cial attention by health authorities, since they may manage up to 25% of the blood transfused in SECO.51
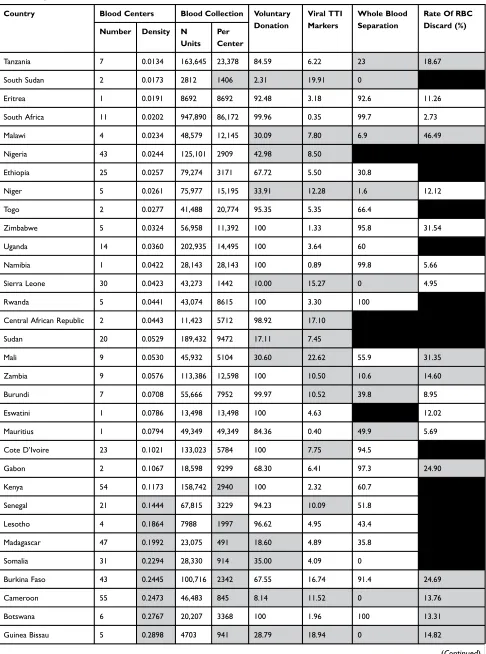
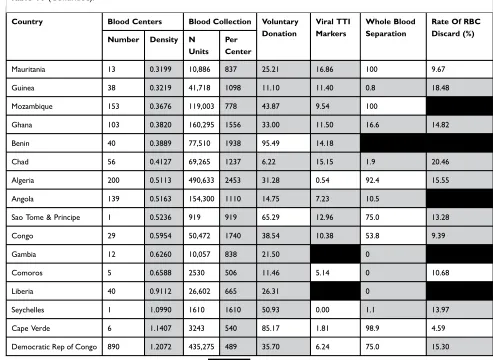
Table 10 shows operational indicators of the blood centers in AFCO. The BCDI fluctuate between 0.0134 and 1.2072 (median 0.1173). The number of blood units processed/center annually varies from 489 in the Democratic Republic of Congo to 86,172 in South Africa. There are 7 AFCO with VBD below 20%; 17 of them collect more than 90% of their units from VBD, with 9 having universal VBD. Prevalence rates of viral TTI markers vary from 0.35 in South Africa to 22.62 in Mali. Seychelles, Mauritius, Namibia, and Algeria report viral TTI prevalence under 1.00; 16 countries find more than 10% of their donations reactive for viral TTI. Twenty-two countries prepare components from less
than 50% of the units collected. Eighteen of 29 AFCO with data discard more than 10% of the RBC they prepare. It was estimated that 11.6% of the collected RBC were discarded and, as a consequence, 88% of the RBC collected during 2013 were transfused. Operational
“poor outcomes” are more likely among the 24 AFCO with BCDI above the median (p =0.0001). Eritrea, Namibia, Eswatini, Mauritius, Sao Tome and Principe, and Seychelles have only one blood center. Countries with two centers may want to keep them both as part of a contingency plan and because of the size of territory and transportation facilities. Independent of the BCDI, understanding where, when, and how many blood com-ponents are needed is essential to plan adequate blood collection, preparation and delivery to hospitals before patients’ medical conditions indicate transfusions. A national plan to avoid excessive discard of RBC will result in considerable financial savings.
Final Remarks
Important lessons were learned from efforts to improve transfusion safety in IBCO during the last 25 years. Initial work focused on prevention of TTI. The systematic com-munication among national blood programs to assure valid data on TTI facilitated the establishment of a quality-con-trolled blood processing information system and solid
Table 9Operational Indicators Of Blood Centers, South-East Asian Countries, 2013
Country Blood Centers Blood Collection Voluntary
Donation
Viral TTI Markers
Whole Blood Separation
Number Density N Units Per Center
Indonesia 375 (321)a 0.1448 2,722,758 8482 84.72 2.110 60.4
India 2760 (2545) 0.1990 9,949,012 3909 85.00 1.600 60.0
Bangladesh 327 0.2075 593,774 1816 29.64 0.976 18.7
Thailand 170 0.2495 618,675 3639 100 0.480 96.4
Nepal 100 (86) 0.3573 201,122 2339 87.79 0.570 25.6
Sri Lanka 90 0.4272 380,808 4231 100 0.324 100
Maldives 2 0.5038 5826 2913 29.54 0.920 100
Timor Leste 6 0.5068 2227 372 33.15 6.820 74.7
Myanmar 334 (145) 0.6491 266,540 1838 76.86 3.210 79.5
Dem Rep Korea 188 (12) 0.7524 101,742 8479 100 0.920 70.0
Bhutan 27 3.5340 8854 328 63.12 1.180 50.8
Notes:a
Numbers of blood centers which provided information.“Poor outcomes”in relation to the median values are shaded.
Abbreviation:TTI, transfusion-transmissible infections.
International Journal of Clinical Transfusion Medicine downloaded from https://www.dovepress.com/ by 118.70.13.36 on 22-Aug-2020
Table 10Operational Indicators Of Blood Centers, African Countries, 2013
Country Blood Centers Blood Collection Voluntary
Donation
Viral TTI Markers
Whole Blood Separation
Rate Of RBC Discard (%)
Number Density N
Units Per Center
Tanzania 7 0.0134 163,645 23,378 84.59 6.22 23 18.67
South Sudan 2 0.0173 2812 1406 2.31 19.91 0
Eritrea 1 0.0191 8692 8692 92.48 3.18 92.6 11.26
South Africa 11 0.0202 947,890 86,172 99.96 0.35 99.7 2.73
Malawi 4 0.0234 48,579 12,145 30.09 7.80 6.9 46.49
Nigeria 43 0.0244 125,101 2909 42.98 8.50
Ethiopia 25 0.0257 79,274 3171 67.72 5.50 30.8
Niger 5 0.0261 75,977 15,195 33.91 12.28 1.6 12.12
Togo 2 0.0277 41,488 20,774 95.35 5.35 66.4
Zimbabwe 5 0.0324 56,958 11,392 100 1.33 95.8 31.54
Uganda 14 0.0360 202,935 14,495 100 3.64 60
Namibia 1 0.0422 28,143 28,143 100 0.89 99.8 5.66
Sierra Leone 30 0.0423 43,273 1442 10.00 15.27 0 4.95
Rwanda 5 0.0441 43,074 8615 100 3.30 100
Central African Republic 2 0.0443 11,423 5712 98.92 17.10
Sudan 20 0.0529 189,432 9472 17.11 7.45
Mali 9 0.0530 45,932 5104 30.60 22.62 55.9 31.35
Zambia 9 0.0576 113,386 12,598 100 10.50 10.6 14.60
Burundi 7 0.0708 55,666 7952 99.97 10.52 39.8 8.95
Eswatini 1 0.0786 13,498 13,498 100 4.63 12.02
Mauritius 1 0.0794 49,349 49,349 84.36 0.40 49.9 5.69
Cote D’Ivoire 23 0.1021 133,023 5784 100 7.75 94.5
Gabon 2 0.1067 18,598 9299 68.30 6.41 97.3 24.90
Kenya 54 0.1173 158,742 2940 100 2.32 60.7
Senegal 21 0.1444 67,815 3229 94.23 10.09 51.8
Lesotho 4 0.1864 7988 1997 96.62 4.95 43.4
Madagascar 47 0.1992 23,075 491 18.60 4.89 35.8
Somalia 31 0.2294 28,330 914 35.00 4.09 0
Burkina Faso 43 0.2445 100,716 2342 67.55 16.74 91.4 24.69
Cameroon 55 0.2473 46,483 845 8.14 11.52 0 13.76
Botswana 6 0.2767 20,207 3368 100 1.96 100 13.31
Guinea Bissau 5 0.2898 4703 941 28.79 18.94 0 14.82
(Continued)
International Journal of Clinical Transfusion Medicine downloaded from https://www.dovepress.com/ by 118.70.13.36 on 22-Aug-2020
collaboration among stakeholders. Delayed, deficient or lack of provision, however, called for securing timely access to blood by patients. The negative consequences of RBD as a requirement for patient treatment at hospitals became obvious. The pursuit of universal VBD was hin-dered by unawareness of time- and space-driven require-ments for blood components at hospitals, and the preference among the public to save their blood for a relative potentially in need of RBD. Review of transfusion practices showed poor record keeping and variable patient management. It was understood that only hospital-based clinical guidelines provide a valid framework for estimat-ing future patterns of blood needs. Blood donors were recognized as vital for achieving blood sufficiency and timely access to transfusions; therefore, nurturing donors became a central strategy. Recognizing that blood transfu-sion services are part of the national health system is indispensable for self-sufficiency and timely access to
blood. The application of lessons learned in IBCO may allow countries of other parts of the world to improve their blood safety in the near future.
Abbreviations
AFCO, African countries; BCDI, blood center density index; HHI, Human Health Index; IBCO, Ibero-American coun-tries; IMR, infant mortality rate; LLMC, low- and lower-middle income countries; MMR, maternal mortality ratio; PAHO, Pan American Health Organization; RBC, red blood cells; RBD, REPLACEMENT blood donation; SECO, South-East Asian countries; TTI, transfusion-transmissible infections; VBD, voluntary blood donation; WHA, World Health Assembly; WHO, World Health Organization.
Data Availability
Pan American Health Organization. Supply of blood for transfusion in Latin American and Caribbean countries
Table 10(Continued).
Country Blood Centers Blood Collection Voluntary
Donation
Viral TTI Markers
Whole Blood Separation
Rate Of RBC Discard (%)
Number Density N
Units Per Center
Mauritania 13 0.3199 10,886 837 25.21 16.86 100 9.67
Guinea 38 0.3219 41,718 1098 11.10 11.40 0.8 18.48
Mozambique 153 0.3676 119,003 778 43.87 9.54 100
Ghana 103 0.3820 160,295 1556 33.00 11.50 16.6 14.82
Benin 40 0.3889 77,510 1938 95.49 14.18
Chad 56 0.4127 69,265 1237 6.22 15.15 1.9 20.46
Algeria 200 0.5113 490,633 2453 31.28 0.54 92.4 15.55
Angola 139 0.5163 154,300 1110 14.75 7.23 10.5
Sao Tome & Principe 1 0.5236 919 919 65.29 12.96 75.0 13.28
Congo 29 0.5954 50,472 1740 38.54 10.38 53.8 9.39
Gambia 12 0.6260 10,057 838 21.50 0
Comoros 5 0.6588 2530 506 11.46 5.14 0 10.68
Liberia 40 0.9112 26,602 665 26.31 0
Seychelles 1 1.0990 1610 1610 50.93 0.00 1.1 13.97
Cape Verde 6 1.1407 3243 540 85.17 1.81 98.9 4.59
Democratic Rep of Congo 890 1.2072 435,275 489 35.70 6.24 75.0 15.30
Notes:“Poor outcomes”in relation to the median values are shaded. : Not available. Prevalence of“poor outcomes”higher in countries with blood center
density > 0.13085; Chi2= 14.42,p=0.0001.
Abbreviations:TTI, transfusion-transmissible infections; RBC, red blood cells.
International Journal of Clinical Transfusion Medicine downloaded from https://www.dovepress.com/ by 118.70.13.36 on 22-Aug-2020
2012 and 2013. https://apps.who.int/iris/handle/10665/
310766?show=ful. World Health Organization. 2016
Global Status Report on Blood Safety and Availability.
https://apps.who.int/iris/bitstream/handle/10665/254987/ 9789241565431-eng.pdf?sequence=1. Pan American Health Organization. Supply of blood for transfusion in Latin American and Caribbean countries 2014 and 2015.https:// apps.who.int/iris/handle/10665/310766?show=ful.
Acknowledgments
The author acknowledges Ms. Donna Eberwine-Villagran for her editorial support.
Funding
The author did not receive any financial support from a third party and covered all expenses associated with the preparation of this manuscript.
Disclosure
The author was Regional Advisor on Laboratory and Blood Services (1994–2011) and Senior Advisor on Health Technologies for Quality of Care (2009–2011), Pan American Health Organization, Regional Office for the Americas, World Health Organization. He was also a mem-ber of AABB Global Standards Committee (2015–2017). He is an honorary member of Grupo Cooperativo Ibero-Americano de Medicina Transfusional (GCIAMT, 2013– present), a member of Education Committee of the African Society for Transfusion Medicine (2017–present). The author reports no other conflicts of interest in this work.
References
1. World Health Organization. Official records. No. 226. 28th World Health Assembly. Annex 14. Utilization and supply of human blood and blood products. A28/WP/6-1. Geneva,1975.
2. Twenty-eighth World Health Assembly. Resolution WHA28.72. Utilization and supply of human blood and blood products. Geneva,1975. 3. Fortieth World Health Assembly. Resolution WHA40.26. Global
strat-egy for the prevention and control of AIDS. Geneva,1987. 4. Forty-fifth World Health Assembly. Resolution WHA45.35. Global
strategy for the prevention and control of AIDS. Geneva,1992. 5. Fifty-third World Health Assembly. Resolution WHA53.14. HIV/
AIDS: confronting the epidemic. Geneva,2000.
6. Fifty-sixth World Health Assembly. Resolution WHA56.30. Global health-sector strategy for HIV/AIDS. Geneva,2003.
7. World Health Organization Regional Office for Africa Regional Committee: Forty-fourth session. Resolution AFR/RC44/R.12: AIDS control: current status of AIDS control activities in the African Region.1994. doi:10.3168/jds.S0022-0302(94)77044-2
8. World Health Organization Regional Office for Africa Regional Committee: Fifty-fifth session. Resolution AFR.RC51/R2. Blood safety: a strategy for the African region. Brazzaville,2001.
9. Pan American Health Organization. 41st Directing Council. Resolution CD41.R15. Strengthening blood banks in the Region of the Americas. San Juan,1999. doi:10.1046/j.1469-1809.1999.6320101.x
10. World Health Organization. Universal access to safe blood transfu-sion. Scaling-up the implementation of the WHO strategy for blood safety and availability for improving patient health and saving lives. Geneva,2007. doi:10.1094/PDIS-91-4-0467B
11. Pan American Health Organization. 46th Directing Council. Document CD46/16. Progress Report on the Global Safe Blood Initiative and Plan of Action for 2005–2010. Washington, DC,2005. 12. Cruz JR, Berrios-Cruz R, Duque-Rodriguez J, Kuperman S. International collaboration for improving global blood safety and for monotring and responding to potential microbial threats. In: Shan H, Dodd RY, editors. Blood Safety. A Guide to Monitoring and Responding to Potential New Threats. Cham: Springer;
2019:225–249.
13. Grupo Cooperativo Iberoamericano de Medicina Transfusional. Estándares de Trabajo para Servicios de Sangre [Work Standards for Blood Services]. Primera Edición. Septiembre2013. Spanish. 14. Berrios R, Gonzalez A, Cruz JR. Achieving self-sufficiency of red
blood cells based on universal voluntary blood donation in Latin America. The case of Nicaragua. Transfus Apher Sci. 2013;49 (3):387–396. doi:10.1016/j.transci.2013.06.013
15. Cruz JR. Satisfacción de los requerimientos de hemocomponentes [Satisfaction of the requirements for blood components]. In: Cortes-Buelvas A, Cabezas-Belalcazar AC, García-Castro Gutiérrez M, Urcelay-Uranga S, editors.Promoción de la donación voluntaria de sangre en Iberoamérica. Cali: GCIAMT;2017:61–70.
16. World Health Organization. 2016 global status report on blood safety and availability. Geneva,2017.
17. Pan American Health Organization. Supply of blood for transfusion in Latin American and Caribbean countries 2012 and 2013. Washington, DC,2015.
18. Pan American Health Organization. Supply of blood for transfusion in Latin American and Caribbean countries 2014 and 2015. Washington, DC,2017.
19. Technical Group for Surveillance of Maternal Mortality. National Epidemiology Center. Cases of Maternal Death Due to Hemorrhage in the Health Services 2015, 2016. Guatemala, Guatemala: Ministry of Health and Social Assistance;2018. 20. National Program of Transfusion Medicine and Blood Banks.Blood
Data 2016. Guatemala, Guatemala: Ministry of Health and Social Assistance;2017.
21. Honduran Red Cross. National Blood Program. Report of the National Blood Program, 2017, 2018. Comayaguela, Honduras,2019
22. Sixty-third World Health Assembly. Availability, safety and quality of blood products. Document WHA63.20. Geneva,2010.
23. World Health Organization. Safe blood and blood components. Module 1. Safe blood donation. Geneva, 1994. doi:10.3168/jds. S0022-0302(94)77044-2
24. Szilasky C. Calculation of present and projected blood needs. In: Holland SR, Wagstaff WW, Leikola J, Lothe F, editors.Management of Blood Transfusion Services. Geneva: World Health Organization;1990:27–30. 25. World Health Organization. Universal access to safe blood
transfu-sion. Geneva,2008.
26. Gibbs WN, Britten AFH.Guidelines for the Organization of a Blood Transfusion Service. Geneva: World Health Organization;1992. 27. Leikola J. How much blood for the world.Vox Sang.1988;54(1):1–5.
doi:10.1111/j.1423-0410.1988.tb01604.x
28. Meara JG, Leather AJM, Hagander L, et al; for The Lancet Commission. Global surgery 2030: evidence and solutions for achieving health, welfare, and economic development. Lancet.
2015;386(9993):569–624. doi:10.1016/S0140-6736(15)60160-X. 29. Human Development Reports [homepage on the internet]. New York:
United Nations Development Programme; 2013. Available from:
http://hdr.undp.org/en/content/health-index. Accessed June 5, 2019.
International Journal of Clinical Transfusion Medicine downloaded from https://www.dovepress.com/ by 118.70.13.36 on 22-Aug-2020
30. Pan American Health Organization. Workshop on Validation of the Methodology. Managua, Nicaragua, December 2009. Presentations. In: Recommendations for Estimating the Need for Blood and Blood Components;2010; Washington, DC.
31. Cruz JR. Reduction of maternal mortality: the need for voluntary blood donors. Int J Gynecol Obstet. 2007;98(3):291–293. doi:10.1016/j. ijgo.2007.01.020
32. Organización Panamericana de la Salud. Salud Materna en Bolivia: Análisis de la Respuesta del Sistema de Salud [Maternal Health in Bolivia: Analysis of the Response of the Health System]. Washington, DC;2011. 33. Beltrán-Duran M, Ayala-Guzmán M. Evaluación externa de los
resul-tados serológicos en los bancos de sangre de Colombia [External evaluation of serology results in blood Banks in Colombia]. Rev Panam Salud Pub. 2003;12(2/3):138–143. Spanish. doi:10.1590/ S1020-49892003000200015
34. Grijalva MJ, Chiriboga RF, Vanhassel H, Arcos-Teran L. Improving the safety of the blood supply in Ecuador through external performance evalua-tion of serological screening tests.J Clin Virol.2005;34(Suppl 2):S47–S52. 35. Organización Panamericana de la Salud. Guía para la estimación de costos de la regionalización de los bancos de sangre [Guide for Estimating the Cost of Regionalizing Blood Banks]. Washington, DC;2005. Spanish. 36. Llovet I, Dinardi G, Llovet D, Berenstein G.Cultura y organización
en la donación de sangre. los casos de Argentina y Canada[Blood Donation Culture and Organization. The Cases of Argentina and Canada]. Buenos Aires, Argentina: Centro de Estudios de Estado y Sociedad;2005. Spanish.
37. HM S-B, Bencomo-Hernandez A, Benet-Rodriguez CM, Lopez-Fernandez R, Valls W, Ballster-Santovenia JM. La hemovigilancia de las reacciones adversas a la donacion [Hemovigilance of side effects of blood donation]. Rev Cubana Hematol Inmunol Hemoter.2013;29(2):154–162. Spanish. 38. Goncalez TT, Sabino EC, Schlumpt KS, et al. Vasovagal reactions in
whole blood donors at 3 REDS-II blood centers in Brazil.Transfusion.
2012;52(5):1070–1078. doi:10.1111/j.1537-2995.2011.03432.x 39. Munera MI, Ramírez BI. Reacciones adversas inmediatas a la donación:
frecuencia y caracterización, Banco de Sangre de la Clínica Cardiovascular Santa María, Medellín [Immediate adverse reactions to blood donation: frequency and characterization, Santa Maria Cardiovascular Clinic Blood Bank, Medellin].Biomédica.2001;21:224–227. Spanish.
40. Chávez-Nieto C, Juárez-Barreto V, Lara-López E. Eventos adversos presentados durante la donación de sangre total [Adverse reactions to whole blood donation]. Resúmenes de Trabajos Libres del IX Congreso de la Asociación Mexicana de Medicina Transfusional, AC.Rev AMMT.2011;4(2):117. Spanish.
41. Patino-Bedoya JA, Cortes-Marquez MM, Cardona-Arias JA. Seroprevalence of markers of transfusion transmissible infections in blood bank in Colombia.Rev Saude Pub. 2012;46:6. doi:10.1590/ S0034-89102012000600004
42. Pan American Health Organization. 48th Directing Council, Document CD48/11. Improving blood availability and transfusion safety in the Americas. Washington, DC,2008.
43. Pan American Health Organization. Eligibility for Blood Donation: Recommendations for Education and Selection of Prospective Blood Donors. Pledge 2 Save Lives. Give Blood Regularly. Washington, DC,2009.
44. Kralievitz KE, Raykar NP, Greenberg SLM, Meara JG. The global blood supply: a literature review. Lancet. 2015;585(Suppl):S28. doi:10.1016/S0140-6736(15)60823-6
45. Custer B, Zou S, Glynn S, et al. Addressing gaps in international blood availability and transfusion safety in Low And Middle Income Countries (LMIC): a NHLBI workshop. Transfusion. 2018;58 (5):1307–1317. doi:10.1111/trf.14598
46. Bloch EM, Vermeulen M, Murphy E. Blood transfusion safety in Africa: a literature review of infectious disease and organizational challenges. Transf Med Rev. 2012;26(2):164–180. doi:10.1016/j. tmrv.2011.07.006
47. Jenny HE, Saluja S, Sood R, et al. Access to safe blood in low-income and middle-low-income countries: lessons from India. BMJ Global Health.2017;2:e000167. doi:10.11/bmjgh-2016-000167 48. Bates I, Chapotera GK, McKew S, van den Broek N. Maternal
mor-tality in sub-Saharan Africa: the contribution of innefective blood transfusion services.BJOG.2008;115:1331–1339. doi:10.1111/j.1471-0528.2008.01866.x
49. Akthter S, Anwar I, Akter, et al. Barriers to timely and safe blood transfusion for PPH patients: evidence from a qualitative study in Dhaka, Bangladesh.PLoS ONE.2016;11(12):e0167399. doi:10.1371/ journal.pone.0167399
50. Loua A, Nikiema JB, Kasilo OMJ, Tagny CT. Blood safety and availability in the WHO African region.Glob Surg.2018;4 (3):1–7.
51. Ramani KV, Mavalankar DV, Govil D. Study of blood-transfusion services in Maharashtra and Gujarat Sates, India.J Health Popul Nutr.2009;27(2):259–270. doi:10.3329/jhpn.v27i2.3368
52. Aneke J, Okocha C. Blood transfusion safety: current status and challenges in Nigeria. Asian J Transf Sci. 2017;11(1):1–5. doi:10.4103/0973-6247.200781
53. Loua A, Sonoo J, Musango L, Nikiema JB, Lapnet-Moustapha T. Blood safety status in WHO African region countries: lessons learnt from mautitius. J Blood Transf. 2017;2017:8. Article ID 1970479.
54. Kyeyune-Byabazaire D, Hume H. Towards a safe and sufficient blood supply in sub-Saharan Africa. ISBT Sci Ser. 2019;14:104– 113. doi:10.1111/voxs.2019.14.issue-1
International Journal of Clinical Transfusion Medicine
Dovepress
Publish your work in this journal
International Journal of Clinical Transfusion Medicine is an interna-tional, peer-reviewed, open access, online journal publishing clin-ical-experimental, policy-making and evidence-based practices of all topics pertaining to clinical transfusion medicine. Original research, short reports, reviews, case reports and commentaries are invited.
The manuscript management system is completely online and includes a very quick and fair peer-review system, which is all easy to use. Visit http://www.dovepress.com/testimonials.php to read real quotes from published authors..
Submit your manuscript here:http://www.dovepress.com/international-journal-of-clinical-transfusion-medicine-journal
International Journal of Clinical Transfusion Medicine downloaded from https://www.dovepress.com/ by 118.70.13.36 on 22-Aug-2020