1
The impact phase of drop punt kicking for maximal distance and accuracy
Running title:
Impact characteristics of drop punt kicking
Abstract
Impact is an important aspect of the kicking skill. This study examined foot and ball motion during impact, and compared distance and accuracy punt kicks. Two-dimensional high-speed video (4000Hz) captured data of the shank, foot and ball through impact of 11 elite
performers kicking for maximal distance and toward a target 20m in distance. Four phases were identified during impact, with an overall reduction in foot velocity of 5.0m/s (± 1.1m/s) and increase in ball velocity of 22.7m/s (± 2.3m/s) from the start to end of contact. Higher foot velocity was found in distance compared to accuracy kicks (22.1 ± 1.6m/s v. 17.7 ± 0.9m/s, p < 0.05), and was considered to produce the significant differences in all impact characteristics excluding foot to ball speed ratio. Ankle motion differed between the kicking tasks; distance kicks were characterised by greater rigidity compared to accuracy kicks evident by larger force (834 ± 107N v. 588 ± 64N) and smaller change in ankle angle (2.2 ± 3.3° v. 7.2 ± 6.4°). Greater rigidity was obtained by altering the position of the ankle at impact start; distance kicks were characterised by greater plantarflexion (130.1 ± 5.8° v. 123.0 ± 7.9°, p < 0.05), indicating rigidity maybe actively controlled for specific tasks.
2
Introduction
Punt kicking is a fundamental skill across the football codes. These kicks vary in purpose from maximising distance to maximising accuracy with kick distances ranging between 15-60 m. The ability to kick for distance and for accuracy are desirable attributes of any elite performer. Kick outcome of drop punt kicking has been mostly attributed to foot velocity prior to impact (Ball, 2008a). However, foot velocity at impact start did not account for all the variance in kick outcome and the author suggested that foot-to-ball impact and ball flight phases, not analysed in the study, might be influential.
Drop punt impact research has compared kicking types, preferred and non-preferred leg kicks, senior and junior kickers and different kick distances. In accordance with basic principles of transfer of energy, increased foot velocity resulted in a greater work applied to the ball, resulting from an increased force applied to the ball over a greater distance (Ball, 2008b; Ball, Smith, & MacMahon, 2010; Smith, Ball, & MacMahon, 2009). Considerations specific to foot-to-ball impact have also been identified that may account for unexplained variance between foot velocity and kick outcome through the impact duration: in addition to foot velocity, muscular force applied through impact duration has been suggested to contribute to kick outcome in both drop punt and soccer kicking (Ball, 2008b; Smith et al., 2009; Tsaousidis & Zatsiorsky, 1996) and; maintaining or increasing foot and ankle rigidity through impact is considered to increase impact efficiency, by increasing the effective mass of the striking limb (Asami & Nolte, 1983; Ball et al., 2010; Plagenhoef, 1971; Sterzing & Hennig, 2008).
To date, all studies analysing punt kicking have been limited to calculating average impact characteristics rather than tracking the foot and ball throughout impact (Ball, 2008b; Ball et al., 2010; Smith et al., 2009). For these studies, average impact characteristics were calculated from the time and position of the foot and ball immediately before and after impact. While average impact
characteristics have provided useful information such as identifying differences between the preferred and non-preferred leg kick, between senior and junior players and between kick distances, impact phase analysis can further be developed to explore the foot and ball motion during impact by tracking through the phase to supplement average characteristics. Analysis of the foot and ball through impact duration in soccer kicking identified two factors that would not be apparent using the average impact approach; 1) that little interaction between the foot and ball occurred in the final fourth (phase 4) of impact duration as there was no change in the velocity of the foot and ball (Shinkai, Nunome,
3 The aims of this study were to analyse the foot and ball through impact of Australian football (AF) drop punt kicking, and to compare impact characteristics in distance and accuracy kicks.
Methods
Eleven elite AF players, who were either currently or recently retired (< 5 years since retirement at elite level and still playing football at a club level) from the Australian Football League (AFL, highest level of AF) and considered elite at the kicking skill by coaches at the time of data collection were recruited for this study (age = 26.8 ± 6.8yrs). All participants signed informed university ethics committee approved consent forms before testing.
After a standardised warm-up including light running, dynamic stretching and 20 kicks, players completed two commonly used drop punt kicking tasks with a standard AF ball (‘Sherrin Match’, Russell Corporation, Scoresby, Australia). The first task was accuracy-based where players kicked toward a sports training mannequin 20m away facing toward the player (1.8 x 0.5m in size, Figure 1). Players were required to start at a designated point facing away from the target, run around a cone 2m away, turn and kick towards the target with the aim to hit it. This task was based on the ‘Buckley’ kicking test developed by the AFL. The second task was a maximal distance kick with a self-selected run up.
*** Insert Figure 1 near here ***
Prior to warm-up, 14mm reflective markers were placed on the kicking limb. A cluster of three markers was placed on the shank with two running parallel with the tibia. Five singular markers were placed on the limb at specific landmarks (knee, ankle, posterior calcaneus, base of the 5th
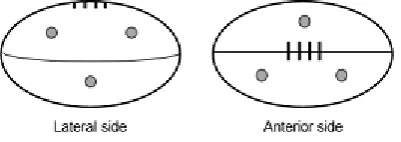
metatarsal and head of the 5th metatarsal). Four 15mm half dome reflective markers made of foam were placed on the ball at specific locations to represent the geometric centre of the ball (GCB) in both two-dimensional and three-dimensional coordinates. Three markers were placed on the lateral side of the ball and the fourth on the medial side (Figure 2).
*** Insert Figure 2 here ***
4 within the camera system’s depth of field. A calibration frame was positioned at multiple depths coinciding with the markers on the ground. For each trial, the calibration image most adjacent to the point of kick was used. Ten infrared cameras (VICON T-40s, Vicon Motion Systems Ltd., Oxford, UK) tracked three-dimensional data of the ball at 500 Hz from the four reflective markers to aid in data collection from the HSV. As data from the two systems were combined, the X-axis was defined as horizontal in the direction of the kick and the y-axis as vertical for both.
Visual inspection of the video files identified that for some trials the ball twisted about its longitudinal axis between release from the hand and contact with the foot. This meant the three markers on the lateral side of the ball would not accurately represent the GCB within the two-dimensional data set. The GCB was, however, able to be calculated from the three-two-dimensional data set from VICON data using all four reflective markers. While in contact with the foot the ball was found not to twist further, enabling the GCB to be calculated at the instant before ball contact and transferred to the two-dimensional data set to represent ball position through impact. A unique algorithm (http://paulbourke.net/geometry/circlesphere/) was adapted to complete this process, where the GCB position was calculated relative to two other reflective markers in the X and Y coordinates of the two-dimensional data set, or Y and Z coordinates of the three-dimensional data set (see equations 1 and 2, respectively). Because only two markers were required to calculate the GCB position, these equations were repeated twice using all combinations of two out of the three ball markers, with the final position calculated from the average of all three combinations.
𝐺𝐺𝐺𝐺𝐺𝐺𝑥𝑥 =𝑃𝑃3𝑥𝑥±�𝑟𝑟12−((𝑟𝑟12− 𝑟𝑟22+𝑑𝑑2)/ 2∗ 𝑑𝑑)∗(𝐺𝐺𝑀𝑀2𝑦𝑦− 𝐺𝐺𝑀𝑀1𝑦𝑦)/𝑑𝑑 (1)
𝐺𝐺𝐺𝐺𝐺𝐺𝑦𝑦=𝑃𝑃3𝑦𝑦±�𝑟𝑟12−((𝑟𝑟12− 𝑟𝑟22+𝑑𝑑2)/ 2∗ 𝑑𝑑)∗(𝐺𝐺𝑀𝑀2𝑥𝑥− 𝐺𝐺𝑀𝑀1𝑥𝑥)/𝑑𝑑 (2)
Where GCB = ‘virtual’ coordinate of the ball’s geometric centre, subscripts x and y represent x and y coordinates, BM = reflective ball marker (1 or 2 indicate marker 1 or 2 out of the 3 in total within the two-dimensional data set), r1 = distance between the GCB and BM2, r2 = distance between the GCB and BM1, d = distance between BM1 and BM2, P3 is defined as equation 3 and 4.
𝑃𝑃3𝑥𝑥 =𝐺𝐺𝑀𝑀1𝑥𝑥+ ((𝑟𝑟12− 𝑟𝑟22+𝑑𝑑2)/ 2∗ 𝑑𝑑)∗(𝐺𝐺𝑀𝑀2𝑥𝑥− 𝐺𝐺𝑀𝑀1𝑥𝑥)/𝑑𝑑 (3)
𝑃𝑃3𝑦𝑦=𝐺𝐺𝑀𝑀1𝑦𝑦+ ((𝑟𝑟12− 𝑟𝑟22+𝑑𝑑2)/ 2∗ 𝑑𝑑)∗(𝐺𝐺𝑀𝑀2𝑦𝑦− 𝐺𝐺𝑀𝑀1𝑦𝑦)/𝑑𝑑 (4)
5 Inc., Maryland, USA) for further analysis. The first and final 15 data points were removed from each individual file, and data were smoothed from five frames before to five frames after impact using a low-pass 4th order Butterworth digital filter with a cut-off frequency of 280Hz with six frames reflected at the beginning and end of the signal. Cut-off frequency was chosen based on four criteria: residual analysis that indicated a range between 170- 260Hz (Winter, 2009); the change in parameter values using different cut-off frequencies (240 – 280 Hz with substantial change in parameter values below 200 Hz); visual inspection of data transformation (240 – 300Hz); and previous literature (200 – 350Hz) (Nunome, Lake, Georgakis, & Stergioulas, 2006; Shinkai et al., 2009).
Smoothed displacement data were then used to evaluate time-based and discrete parameters. To examine foot and ball velocity profiles, time-based data for each were normalised to 100 frames from the instant of ball contact (0%) until the point of separation of foot and ball (100%). For each, velocity was obtained using the derivative of displacement data. To compare ankle motion time-based data between distance and accuracy kicks, a single confidence interval (P = 0.05) was plotted with the single line representing the one tail (Welkowitz, Cohen, & Lea, 2012). Where this line did not
overlap, it was considered to represent a significant difference between the curves. Foot and ball velocity curves were also examined qualitatively to identify if phases as found by Shinkai et al. (2009) were evident in the punt kick.
Nine discrete parameters were also calculated from the smoothed displacement data and velocity calculations. To determine foot and ball velocity immediately before and after impact, five frames before and after impact were averaged, similar to the method used in previous kick impact studies (e.g. Ball, 2008b) to reduce errors associated with dividing by time. Contact distance was calculated by subtracting the GCB at the end of impact from the GCB at the start of impact. Average force was calculated using F = m.a by first evaluating the change in velocity of the ball (immediately after impact – immediately before impact) and dividing by impact duration to obtain average
acceleration, then multiplying this by the ball mass (m = 0.45kg). Peak ball reaction force was calculated from the second derivative of time-displacement data, multiplied by its’ mass. Work was calculated by multiplying the average force by the contact distance (F.d). Ball flight trajectory was calculated from the average velocity vector of the GCB using the five frames immediately after impact, relative to the horizontal. Ankle plantar/dorsal flexion angle was calculated as the difference between the angle of the shank and the angle of the foot at the instant before impact. Change in ankle angle was calculated by subtracting the ankle angle at the instant after impact from the instant before impact.
7
Results
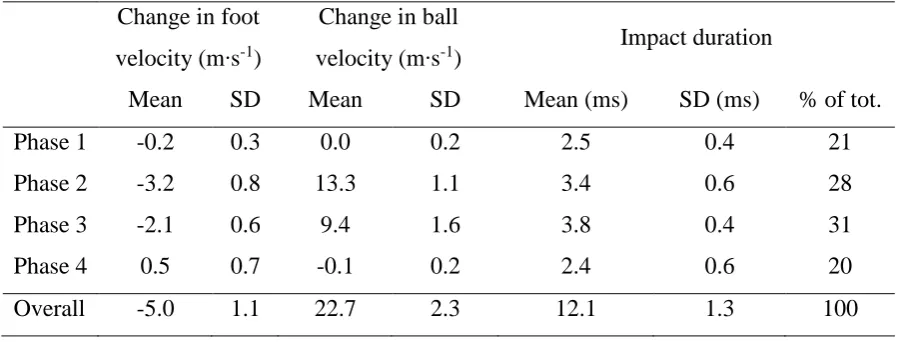
Velocity profiles of the foot and ball during impact of distance kicks are outlined in Figure 3 and Table 1. Accuracy kicks were visually identified to yield a similar profile as distance kicks, and were
removed for the analysis of the foot and ball through impact. For the first 2ms of contact (21% of foot-to-ball impact) the GCB did not change, and visual inspection from HSV identified the ball was mostly deforming (phase 1). In phase 2 the velocity of the foot and ball began to decrease and increase, respectively, until equal at 5.8ms or 49% of impact, marking the point of maximal deformation. In phase 3, ball velocity exceeded foot velocity and continued to increase while foot velocity decreased. Phase 4 began at approximately 9ms, or 80% of impact duration, and was characterised by ball velocity plateauing and little increase in foot velocity.
**** Insert Figure 3 and Table 1 here****
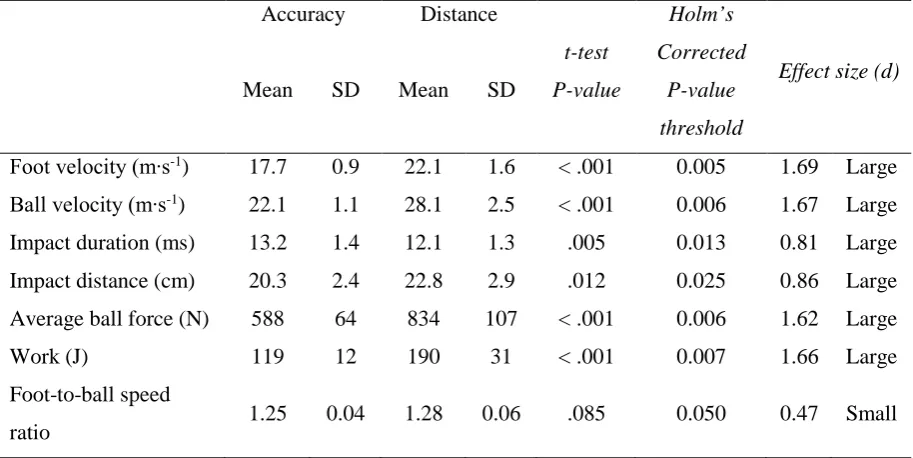
Significant large effects were found between distance and accuracy kicks for all impact characteristics, except foot-to-ball speed ratio (Table 2). Distance kicks produced a significantly larger foot velocity, ball velocity, impact distance, average force, peak force and work. Accuracy kicks were characterised by a significantly longer impact duration.
**** Insert Table 2 here ****
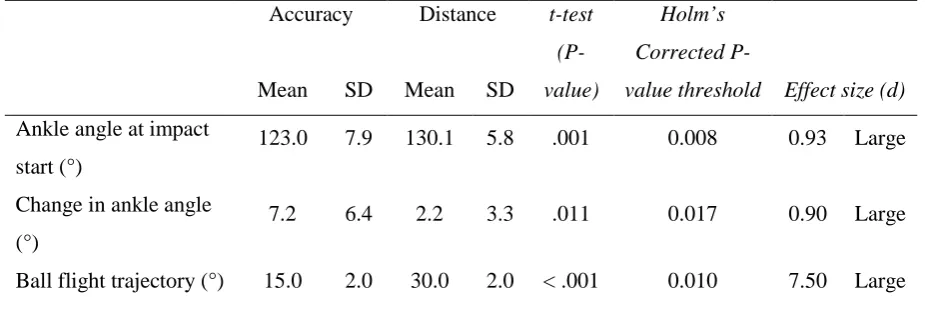
Significant large effects were also found between distance and accuracy kicks for kinematics of the ankle joint and ball flight characteristics (Table 3). Ankle angle (Figure 4) was significantly larger in distance kicks at impact start and up until 66% of impact duration. Both kicks displayed a similar profile of ankle motion through impact; initial dorsiflexion followed by plantarflexion. The total change in ankle angle was significantly less in distance kicks compared to accuracy kicks. Ball flight trajectory was found to be significantly more lofted in distance kicks.
8
Discussion
Previous work on drop punt kicking identified unexplained variance between foot velocity just prior to impact and kick outcome, and suggested the impact phase be analysed. The majority of work on the impact phase in the punt kick has examined impact using average and not instantaneous measurement and has been limited to maximal kicking only. This study examined the motion of the foot and ball through impact, examining average and instantaneous factors, and compared maximal distance and accuracy kicks. The instantaneous velocity profile of the foot and ball through impact duration was characterised. Significant differences in impact characteristics, as well as kinematic parameters of the ankle and ball were found between maximal distance and accuracy kicks.
Foot and ball characteristics during impact
The velocity profiles of both the foot and the ball during impact in the punt kick were similar to previous findings reported for instep soccer kicking. The four phases identified in this study of deformation (phase 1), a decrease in foot velocity and corresponding increase ball velocity (phases 2 and 3), and little interaction (phase 4) (Figure 3) were similar to those identified by Shinkai et al. (2009). The two exceptions were that initial ball velocity was non-zero due to the ball being dropped from the hand prior to impact in the drop punt rather than kicked from the ground while in a stationary position, and an increasing foot velocity during phase 4. This indicated that neither the different shape of the ball (ovoid compared to spherical) nor the type of kick (moving ball compared to stationary ball) influenced foot or ball motion in the first three phases of impact, and did not influence the interaction between foot and ball in phase four.
The underlying impact mechanism suggested by Shinkai et al. (2009) for the soccer kick would also seem to apply to the punt kick. In the first two phases, the foot applied the majority of force to the ball to both deform and accelerate it. In phase three, the force applied by the ball (from the energy stored in its’ deformation) exceeded the force being applied by the foot onto the ball. From this point, the ball began to move faster than the foot. In the final phase, minimal interaction occurred, and is the phase where the majority of energy loss occurred during impact. Commonly referred to the coefficient of restitution, energy is lost through impact and these losses originate from elastic energy that is not transferred to kinetic energy (or ball speed) during the reformation period of impact (Cross, 2013). The individual phase analysis of this study indicates energy losses primarily occurred in the final phase of impact, suggesting that the influence of the kicker on the ball was restricted to the first 80% (8-9 ms) of contact.
9 will remain throughout impact, the fact that foot speed increased in the latter stages of impact
suggested a reduction in ball reaction force and a relatively larger contribution to the system from the leg, as the weight of the foot remains the same. In the soccer toe kick, Tsaousidis & Zatsiorsky (1996) reported ball velocity increased but foot velocity remained constant during the reformation period (equivalent to phases 3 and 4 of the present study). They suggested muscular force was applied to the foot during impact, preventing its expected deceleration, and, the contribution of muscular force was considered substantial to the production of ball velocity. While the foot velocity did not remain constant in this study during phase three, the fact that it increased in phase four indicated a force was likely being applied to the foot during impact. This force may have stemmed from the muscles as identified by Tsaousidis & Zatsiorsky (1996), or, it may be elastic energy stored in the ligaments and/ or other anatomical structures about the knee and ankle joints that were stretched during phases 1 to 3 where a force was being applied between the foot and ball, and the elastic energy consequently being released in phase 4 due to no interaction occurring between the foot and ball. It cannot be concluded whether this external force was substantial to the production of ball velocity but, it certainly seems that the influence was less than that found by Tsaousidis & Zatsiorsky (1996). This difference is possibly due to differences in performers (elite vs. amateur) or impact location (anterior aspect of foot vs. toe). However more work using a controlled testing methodology including a mechanical leg is needed to fully explore this issue of muscular force during impact and what influence it has on the resulting kick.
Distance and accuracy kicks
Greater foot and ball velocity of distance compared to accuracy kicks can be attributed to the performer adapting to the different tasks. The differing distances of the tasks is considered to be one factor players accommodated for, and greater foot velocity has been previously associated with greater ball velocity and distance (Ball, 2010; Ball et al., 2010). Further, the decreased foot and ball velocity of accuracy kicks supports the speed-accuracy trade off, or Fitts’ law. This theory states when the accuracy constraint of a task is increased, the speed it can be completed must decrease (Magill & Anderson, 2007). The present study found ball velocity of accuracy kicks decreased to 80% of that produced by distance kicks, similar to Andersen & Dörge (2011) who reported a decrease to 85% of maximal velocity when the constraint of accuracy was introduced in soccer kicking.
While lower foot and ball speeds were evident for the accuracy compared to distance kicks, these were still substantially larger than that required to simply make the 20m distance and is considered a task specific strategy. Distance kicks were approximately 60m in length, so an
10 with a flatter trajectory, also requiring greater ball speed. The 15 degree lower ball trajectory angle produced in accuracy kicks might support this (Distance, 30 ± 2°, Accuracy, 15 ± 2°). Due to the shape of the flat mannequin target that was tall and wide with very little depth, the relative target area would be maximized with a ball flight trajectory travelling perpendicular to the front of the target, or a ball flight trajectory of 0° when impacting the target (Peacock, 2013) (Figure 5). Participants might have purposely attempted to increase the relative target area by decreasing the ball flight trajectory of accuracy kicks, thus requiring an increase in ball velocity in accuracy kicks to ensure the ball hit the target on the full. The lowest ball flight trajectory would be achievable if the ball travelled at the same velocity of maximal distance kicks, however the constraint of accuracy is likely to have influenced participants to reduce foot velocity and in-turn ball velocity.
****Insert Figure 5 near here****
The difference in foot velocity (and corresponding ball velocity) between the tasks is
considered to be the main cause for the differences in impact characteristics. All impact characteristics excluding foot to ball speed ratio were significantly different between distance and accuracy kicks (Table 2); with greater impact distance, average force and work in distance kicks, and greater impact duration in accuracy kicks. Increased foot velocity has been previously shown to increase impact distance, force and work, and decrease impact duration across AF and soccer instep kicking (Ball, 2010 - impact distance, force, work and impact duration; Ball et al., 2010 - impact distance, work and force; Nunome, Shinkai, & Ikegami, 2012 - impact duration). Further, these patterns are evident in the analysis of inelastic objects (baseball, tennis ball, Cross, 2013), where the influence of performer technique did not exist and the change in velocity of the ball impacting the force plate was the only factor between trials. It can be considered the differences in impact characteristics throughout the present study can be attributed to the mechanical properties of the ball, and occurred in response to the differing foot velocity at impact start.
The combination of a smaller ankle ROM but a larger ball reaction force in distance
11 compared to shod foot kicking by increasing rigidity. Similarly, Tol, Slim, van Soest, & van Dijk (2002) reported hyper plantarflexion could occur during soccer kicking, suggesting anatomical structures within the ankle joint could influence the resulting motion about the ankle. The present study was limited by not calculating maximal plantarflexion within each participant, but it can be stated that the ankle was closer to this maximum in distance compared to accuracy kicks.
Reasons for the ankle strategy in accuracy kicks is unclear from the data but a number of possibilities exist. A comparison of barefoot and shod kicking has shown accuracy to be greater in shod kicking with specific footwear features reduce the uneven pressures across the anterior aspect of the foot (caused by bony prominences) suggested a reason (Hennig, 2011). The results in this study could be explained by a similar mechanism. As the ankle plantarflexed more during the accuracy kick, it might be the players were attempting to even out pressure during the impact phase or apply a more homogenous force to the ball. The strategy might also aid in achieving a flatter trajectory as a rigid ankle for the same starting position would result in a kick that has a more lofted kick than would be evident with the ankle motion found in this study. However further work is required to substantiate this mechanism, examining kicks of difference distance and mechanical-based testing to better understand the mechanism underlying the ankle strategy.
12
Conclusion
13
References
Andersen, T. B., & Dörge, H. C. (2011). The Influence of Speed of Approach and Accuracy Constraint on the Maximal Speed of the Ball in Soccer Kicking. Scandinavian Journal of Medicine & Science in Sports, 21, 79-84. doi: 10.1111/j.1600-0838.2009.01024.x
Andersen, T. B., Kristensen, L. B., & Sorensen, H. (2008). Biomechanical Differences Between Toe and Instep Kicking; Influence of Contact Area on the Coefficient of Restitution. Football Science, 5, 45-50. Retrieved from http://www.scholar.google.com.au
Asami, T., & Nolte, V. (1983). Analysis of Powerful Ball Kicking. In: Biomechanics VIII-B. Eds: Matsui, H. & Kobayashi, K.Champaign IL: Human Kinetics.695-700. Retrieved from http://www.vu.edu.au/library
Ball, K. (2008a). Biomechanical Considerations of Distance Kicking in Australian Rules Football.
Sports Biomechanics, 7, 10-23. doi: 10.1080/14763140701683015
Ball, K. (2008b). Foot Interaction during Kicking in Australian Rules Football. In: Science and Football VI: The Proceedings of the Sixth World Congress on Science and Football, Eds: Reilly, T., & Korkusuz, F. Abingdon: Routledge. 36-40.
Ball, K. (2010). Kick Impact Characteristics for different Rugby League Kicks. In: Proceedings of the 28th International Conference on Biomechanics in Sports, Eds: Jensen, R., Ebben, W., Petushek, E., Richter, C., & Roemer, K. Marquette: Michigan State University, 458–461. Retrieved from http://www.isbs.org/
Ball, K., Ingleton, C., Peacock, J., & Nunome, H. (2013). Ball Impact Dynamics in the Punt Kick. In:
Proceedings of the 31st International Conference on Biomechanics in Sports, Eds: Shiang, T., Ho, W., Huang, P. C., & Tsai, C. Taipei, Taiwan. Retrieved from http://www.isbs.org/
Ball, K., Smith, J., & MacMahon, C. (2010). Kick Impact Characteristics of Junior Kickers. In:
Proceedings of the 28th International Conference on Biomechanics in Sports, Eds: Jensen, R., Ebben, W., Petushek, E., Richter, C., & Roemer, K. Marquette: Michigan State University. Retrieved from http://www.isbs.org/
Cohen, J. (1988). Statistical Power Analysis for the Behavioral Sciences: Lawrence Erlbaum.
Cross, R. (2013). Impact of Sports Balls with Striking Implements. Sports Engineering, 17, 3-22. doi: 10.1007/s12283-013-0132-0
Hennig, E, M. (2011). The Influence of Soccer Shoe Design on Player Performance and Injuries.
Research in Sports Medicine, 19, 186-201. doi: 10.1080/15438627.2011.582823
Holm, S. (1979). A Simple Sequentially Rejective Multiple Test Procedure. Scandinavian Journal of Statistics, 6, 65-70.
Kellis, E., & Katis, A. (2007). Biomechanical Characteristics and Determinants of Instep Soccer Kick.
14 Magill, R. A., & Anderson, D. (2007). Motor Learning and Control: Concepts and Applications. New
York, USA: McGraw-Hill.
Nunome, H., Ball, K., & Shinkai, H. (2014) Myth and fact of ball impact dynamics in football codes.
Footwear Science, 6, 105-118, doi: 10.1080/19424280.2014.886303
Nunome, H., Lake, M., Georgakis, A., & Stergioulas, L. K. (2006). Impact Phase Kinematics of Instep Kicking in Soccer. Journal of Sports Sciences, 24, 11-22. doi:
10.1080/02640410400021450
Nunome, H., Shinkai, H., & Ikegami, Y. (2012). Ball Impact Kinematics and Dynamics in Soccer Kicking. In: Proceedings of the 30th International Conference on Biomechanics in Sports,
Eds: Bradshaw, E. J., Burnett, A., & Hume, P, A. Melbourne, Australia. Retrieved from http://www.isbs.org/
Peacock, J. (2013). Comparison of foot to ball interaction in Australian football in elite males
(Unpublished honours thesis). Institute of Exercise, Sport and Active Living, Victoria University, Melbourne, Australia.
Peacock, J, & Ball, K. (2016). The Impact Phase of Drop Punt Kicking: Validation and Experimental Data of a Mechanical Kicking Limb. Paper presented at the 34th International Conference on Biomechanics in Sports, Tsukuba, Japan.
Plagenhoef, S. (1971). Patterns of Human Motion: A Cinematographic Analysis. Englewood Cliffs, New Jersey: Prentice-Hall Inc.,
Shinkai, H., Nunome, H., Isokawa, M., & Ikegami, Y. (2009). Ball Impact Dynamics of Instep Soccer Kicking. Medicine & Science in Sports & Exercise, 41, 889-897. doi:
10.1249/MSS.0b013e31818e8044
Smith, J., Ball, K., & MacMahon, C. (2009). Foot-to-ball Interaction in Preferred and Non-Preferred Leg Australian Rules Kicking. In: Proceedings of the 30th International Conference on Biomechanics in Sports, Eds: Harrison, A. J., Anderson, R., & Kenny, I. Limerick, Ireland. Retrieved from http://www.isbs.org/
Sterzing, T., & Hennig, E. M. (2008). The Influence of Soccer Shoes on Kicking Velocity in Full-Instep Kicks. Exercise and Sport Sciences Reviews, 36, 91-97. doi:
10.1097/JES.0b013e318168ece7
Tol, J. L., Slim, E., van Soest, A. J., & van Dijk, C. N. (2002). The Relationship of the Kicking Action in Soccer and Anterior Ankle Impingement Syndrome: A Biomechanical Analysis. The American Journal of Sports Medicine, 30, 45-50. doi: 0363-5465/102/3030-0045$02.00/0 Tsaousidis, N., & Zatsiorsky, V. (1996). Two types of ball-effector interaction and their relative
contribution to soccer kicking. Human Movement Science, 15, 861-876.
15 Winter, D. A. (2009). Biomechanics and Motor Control of Human Movement, Fourth Edition,
16
Tables
Table 1. The profile of impact during distance kicks – individual phase analysis
Change in foot
velocity (m
∙s
-1)
Change in ball
velocity (m
∙s
-1)
Impact duration
Mean
SD
Mean
SD
Mean (ms)
SD (ms)
% of tot.
Phase 1
-0.2
0.3
0.0
0.2
2.5
0.4
21
Phase 2
-3.2
0.8
13.3
1.1
3.4
0.6
28
Phase 3
-2.1
0.6
9.4
1.6
3.8
0.4
31
Phase 4
0.5
0.7
-0.1
0.2
2.4
0.6
20
17 Table 2. Impact characteristics of accuracy and distance kicks
Accuracy Distance
t-test
P-value
Holm’s
Corrected
P-value
threshold
Effect size (d)
Mean SD Mean SD
Foot velocity (m∙s-1) 17.7 0.9 22.1 1.6 < .001 0.005 1.69 Large Ball velocity (m∙s-1) 22.1 1.1 28.1 2.5 < .001 0.006 1.67 Large Impact duration (ms) 13.2 1.4 12.1 1.3 .005 0.013 0.81 Large Impact distance (cm) 20.3 2.4 22.8 2.9 .012 0.025 0.86 Large Average ball force (N) 588 64 834 107 < .001 0.006 1.62 Large
Work (J) 119 12 190 31 < .001 0.007 1.66 Large
Foot-to-ball speed
ratio 1.25 0.04 1.28 0.06 .085 0.050 0.47 Small
18 Table 3. Kinematics of the ankle joint and ball flight characteristics of accuracy and distance kicks
Accuracy Distance t-test
(P-value)
Holm’s
Corrected
P-value threshold Effect size (d)
Mean SD Mean SD
Ankle angle at impact start (°)
123.0 7.9 130.1 5.8 .001 0.008 0.93 Large
Change in ankle angle (°)
7.2 6.4 2.2 3.3 .011 0.017 0.90 Large
Ball flight trajectory (°) 15.0 2.0 30.0 2.0 < .001 0.010 7.50 Large
19
Figure captions
Figure 1 – target used for 20 m accuracy kicks.
20 Figure 3 –foot and ball velocity during impact of distance kicks.
Figure 4 – ankle position during impact. Significant differences existed when the 95% confidence interval (CI) separated the two kicks (0 – 66% of impact duration).