Article
Tying together multiscale calculations for charge
transport in P3HT: structural descriptors, morphology,
and tie-chains
Evan D. Miller1 , Matthew L. Jones1 and Eric Jankowski1,*
1 Micron School of Materials Science and Engineering; Boise State University, Boise 83705, United States of
America; [email protected]
* Correspondence: [email protected]; Tel.: +1-208-426-5681
Academic Editor: name
Version November 15, 2018 submitted to Journal Not Specified
Abstract: Evaluating new, promising organic molecules to make next-generation organic
1
optoelectronic devices necessitates the evaluation of charge carrier transport performance through the
2
semi-conducting medium. In this work, we utilize quantum chemical calculations (QCC) and kinetic
3
Monte Carlo (KMC) simulations to predict the zero-field hole mobilities of∼100 morphologies of
4
the benchmark polymer poly(3-hexylthiophene), with varying simulation volume, structural order,
5
and chain-length polydispersity. Morphologies with monodisperse chains were generated previously
6
using an optimized molecular dynamics force-field and represent a spectrum of nanostructured order.
7
We discover that a combined consideration of backbone clustering and system-wide disorder arising
8
from side-chain conformations are correlated with hole mobility. Furthermore, we show that strongly
9
interconnected thiophene backbones are required for efficient charge transport. This definitively
10
shows the role “tie-chains” play in enabling mobile charges in P3HT. By marrying QCC and KMC
11
over multiple length- and time-scales, we demonstrate that it is now possible to routinely probe the
12
relationship between molecular nanostructure and device performance.
13
Keywords:organic photovoltaics, charge transport, semi-empirical, kinetic Monte Carlo
14
1. Introduction
15
Organic photovoltaics (OPVs)—solar panels built with carbon-based compounds—are
16
advantageous due to low-cost, scalable manufacturing methods [1,2]. OPVs have the potential to
17
inexpensively meet growing energy demand with energy pay-back times in as little as one day with
18
estimated 15% photoconversion efficiencies [3], a goal that has recently been surpassed by laboratory
19
tandem devices [4]. The challenge in achieving mass-produced devices with similar efficiencies is
20
controlling the spontaneous formation of nanostructures with thermodynamic self-assembly [5,6].
21
Obtaining favorable morphologies is complicated because the choice of ingredients, solvents [7],
22
annealing methods [8–10], and processing temperatures [11] all affect self-assembly. Furthermore,
23
it is challenging to predict which morphologies will exhibit the most favorable charge transport
24
properties. To engineer better OPVs and ameliorate global climate change it is necessary to answer (1)
25
“Which nanostructures are required for high device efficiency?”, and (2) “What processing protocols
26
are required to obtain these structures?” In this article, we address the first question by identifying
27
structure-performance relationships for the benchmark donor material poly-(3-hexylthiophene) (P3HT).
28
The second issue is investigated for P3HT in a companion work [12].
29
In order to successfully evaluate structure-performance relationship, we require a performance
30
descriptor that can quantifiably describe morphologies. One such property is the charge-carrier
31
S
S
A BA B
a
b
Figure 1.(a) The chemical structure of a poly-alkylthiophene chain. If the aliphatic side chains are consistently located only at the A sites or the B sites along the backbone, then the polymer is regioregular. In regiorandom chains, the placement of the aliphatic side chain is randomly placed at an A or B site on each thiophene. (b) P3HT united-atom model used in previous work. Sulfur, aromatic carbons, and aliphatic carbons are represented by yellow, dark blue, and cyan beads respectively. The rigid bonds are shown with thick red lines and flexible bonds are shown in light blue. (Figure replicated from [12] with authors’ permission.)
mobility,µ, which describes the speed that electrons and holes conduct through the semiconducting 32
layer. Generally speaking, OPVs with faster carrier mobilities exhibit faster response times and
33
better overall performance (although other properties such as optical absorption also ultimately affect
34
performance) [1]. However, a key advantage of selecting the hole mobility as the performance metric
35
is that it is widely applicable to all organic electronic devices - such as transistors and diodes. In this
36
investigation, we therefore measure the hole mobility of P3HT in the absence of an electric field,µ0,
37
which is similar to time-of-flight mobilities that are measured experimentally, and allows us to explore
38
charge movement free of any electric field [13].
39
P3HT is the benchmark donor material in organic electronics, largely due to reasonable hole
40
mobilities, ideal energy level placement and bandgap, excellent optical absorption, and good solution
41
processability [14]. It is also widely studied experimentally—especially in the context of P3HT:fullerene
42
OPVs where device power conversion efficiencies as high as 6.5% have been obtained [15]. In neat
43
P3HT field effect transistors, high mobilities of 0.1-0.4 cm2/Vs have been measured for devices which
44
contained microcrystalline domains surrounded by an amorphous matrix [16,17]. Time-of-flight
45
mobilities for P3HT tend to be lower,µ = 1×10⁻⁵ to 1×10⁻³ cm2/Vs, due to the lower charge 46
density and absence of an electric field to drive the movement of charges [18–21]. These experiments
47
have made excellent progress in linking the nanoscale polymer structure to device performance. For
48
instance, high regioregularity [18,19,21] (i.e. a large proportion of the monomers in each chain have a
49
consistent placement of the aliphatic side chain attached to the thiophene ring (seeFigure 1a)) and
50
shorter polymer chains are both expected to result in advantageous molecular packing resulting in
51
a high degree of crystalline order [20]. However, comprehensive experimental investigation of the
52
relationship between morphology and charge motion is prohibited by time, expense, and difficulty.
53
Computational modeling provides insight into morphology and mobility that is inaccessible in
54
experiments, and can more efficiently be used to evaluate how changes to processing parameters
55
(temperature, solvent quality) tune performance. Techniques such as drift-diffusion [22,23], master
56
equation [24,25], and kinetic Monte Carlo (KMC) [26–29] have all been successfully employed to
57
investigate charge transport of model OPV morphologies. Drift-diffusion and lattice-based “mesoscale”
58
KMC [30] can investigate device performance properties, but lose important details at molecular
59
length-scales. Conversely, master equation and “molecular” KMC maintain the molecular resolution
60
but require approximations such as periodic boundary conditions to investigate charge motion over
61
distances relevant for devices [25,28,29]. Such methods have been used to investigate time-of-flight
62
mobilities, some reporting values a few orders of magnitude higher than expected (1×100to 1×10³
63
cm2/Vs) [28,31,32], and others focusing on transfer integrals and inferred mobility without predicting
64
mobility values[26,33]. For this investigation, we implement molecular KMC simulations, which are
more computationally expensive than master equation techniques, but offer explicit spatial resolution
66
of charges within the morphology [28,29]. Molecular KMC uses the positions, orientations, and
67
energetics of electronically active portions of the molecules (chromophores), to determine the rates at
68
which carriers can perform quantized “hops” between chromophore pairs. The hopping rates between
69
every pair of chromophores in the system can be calculated in order to predict the expected motion
70
of carriers through the system and the overallµ0(subscript “0” signifies that there is no electric field,
71
similar to time-of-flight experiments).
72
In this work we utilize morphologies generated in previous work using a model that provides
73
state-of-the-art prediction accuracy validated by experiments, while still providing sufficient
74
computational efficiency to facilitate the investigation of a large number of processing parameter
75
combinations [12]. With these morphologies, we perform semi-empirical QCCs to obtain the
76
chromophore energy levels and molecular KMC simulations to obtain hole mobilities for pristine
77
P3HT thin films at ∼ 100 different state-points. We find that the structural order parameter
78
developed previously,ψ, does not satisfactorily predict the observed charge carrier mobility in the 79
thin films. Modifying the descriptor by including the variation of aliphatic bond lengths as a proxy
80
for system-wide disorder,ψ0, provides much better quantitative agreement between order parameter 81
and charge mobility for the small “parameter sweep” systems. That said, we show thatψ0 is less 82
predictive of mobility for larger monodisperse systems (10×the number of chains) at experimentally
83
interesting state-points. We propose that this is due toψ0 not taking into account the difficulty in 84
charges hopping between crystallite grains of different orientations, effectively trapping carriers in
85
the ordered crystallites. We therefore investigate the effect of a polydisperse distribution of chain
86
lengths on mobility. We show that the longest chains in these distributions can span multiple clusters
87
as “tie-chains” and mitigate the carrier trapping within crystals, bringing mobilities back in line with
88
the predictions offered byψ0. This allows us to predict the processing conditions that result in the 89
highest performing devices. Our finding that highly ordered structures may have low mobilities if
90
connecting paths between ordered domains are absent paves the way for new analytical techniques to
91
help link structure to device performance [31].
92
This article is structured as follows: in Section2we cover the important details of previous
93
molecular dynamics (MD) work and discuss the methodology in using the MorphCT simulation
94
package [34] to conduct KMC simulations and obtain zero-field mobilities. In Section3.1we then
95
explore charge transport properties for a large set of morphologies generated using an optimized
96
molecular model, and in Section3.2identify structural features important for charge transport in larger
97
systems.
98
2. Methods
99
2.1. Molecular Dynamics Simulations
100
The P3HT morphologies studied here were previously predicted using MD simulations, and so
101
only salient information will be covered here [12]. We investigate∼100 morphologies generated from
102
simulations using an adapted Optimized Performance for Liquid Simulations - United Atom forcefield
103
to govern the non-bonded pair interactions (seeFigure 1b). The united-atom model consists of three
104
species of simulation beads: sulfur-S, aliphatic carbons-CT, and aromatic carbons-CA. The bonded
105
constraints (bonds, angles, and dihedrals) are derived from the atomistic works of Huang and Bhatta
106
[35,36], with modifications made to account for the reduced number of distinct atomic species utilized
107
in the united-atom model. In the interest of computational performance, we make several additional
108
modeling choices: solvent and electrostatic interactions are considered implicitly and thiophene rings
109
are considered as rigid bodies (bonded constraints are held constant). The optimized model is shown to
110
have excellent agreement with experimental results while accessing sufficient computational efficiency
111
to explore a wide parameter space, with each simulation reaching equilibrium in tenable wall-clock
112
simulation times [12].
In our previous work, we simulate cubic simulation volumes of side 7 nm containing 100×15
114
oligomer long chains at a variety of temperaturesT, densitiesρ, and implicit solvent solubilityεs.εs
115
is a reciprocal measure of solubility, with low values corresponding to solvents that easily solvate
116
P3HT. Here, all systems are at experimentally measured thin-film density,ρ= 1.11 g/cm3. However, 117
we still consider a wide range of temperatures (80 ≤ T ≤ 1300 K in steps of 80 K) and solvents
118
(0.2 ≤ εs ≤ 1.2 in steps of 0.2). We find that the highest degrees of order are observed in a band
119
located from low temperatures and “good” solvents (T ∼ 250 K, εs = 0.2) to high temperatures
120
and “poor” solvents (T∼750 K,εs = 1.2). We note that theTdefined here corresponds only to the
121
temperatures of the MD simulation, which affects the energetic disorder of the polymer chains but not
122
subsequent charge transport calculations. We also curate larger systems (cubic simulation volumes
123
of side 15 nm containing 1,000 chains with degree of polymerization 15 - 15mers) with differing
124
degrees of order: “amorphous”, “semi-crystalline”, and “crystalline” by terminating the evolution of
125
an experimentally relevant state-point at different degrees of equilibration. This ensures that different
126
degrees of structural order can be obtained without changing the energetic disorder arising from
127
thermal vibrations, allowing us to divorce the effects of structure and energetic disorder on the charge
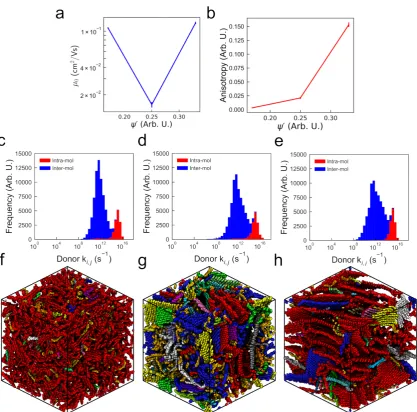
128
transport properties.
129
To quantify the structural order of these systems, we develop an order parameterψ, which 130
is defined as the fraction of thiophene rings comprising “large” clusters containing more than six
131
thiophene rings out of the total number of thiophene rings in the system. Two thiophenes are
132
considered clustered if their centroids are within 6.6 Å, and if the normal vectors of the thiophene rings
133
are oriented within 20◦of each other. These criteria were selected from a combination of the observed
134
radial distribution functions, and other works which have shown such values produce a high degree
135
of molecular orbital overlap between rings. A key aim of this work is to ascertain the efficacy of using
136
ψ- a purely structural property of the morphology - to predict the charge transport of an arbitrary 137
morphology.
138
2.2. Kinetic Monte Carlo Simulations
139
DFT techniques (See SI Section 1 for details). The energy splitting in dimer method is then used to calculate the electronic coupling between chromophoreiand chromophorej,Ji,j[33,39,40]:
Ji,j= 1 2
q
(EHOMO−EHOMO-1)2− ∆Ei,j
2
, (1)
whereEHOMOandEHOMO-1are the highest and second-highest occupied molecular orbitals of the dimer pair respectively and∆Ei,jis the site-to-site energy difference, which is calculated asEHOMO,j− EHOMO,i. The rate at which a hole is able to hop from i to j is given by an expression based on semi-classical Marcus theory [41]:
ki,j = |Ji,j|2
¯ h
r π
λkBT exp
−ri,j
α
exp −(∆Ei,j−λ) 2
4λkBTKMC
!
, (2)
where ¯his the reduced Planck’s constant,λis the reorganization energy,kBis the Boltzmann constant,
140
andTKMCis the temperature of the KMC simulation. This temperature,TKMCis not to be confused
141
with the temperature of the MD simulation,T. In this case,TKMCcorresponds to the temperature
142
of the resultant device when the structure has been “locked in” after processing, which we keep
143
constant at 293 K. We also include an additional exponential term in the hopping rate equation
144
based on the center-of-mass separation between chromophores,ri,j, and a tuning parameterα=2Å. 145
This term originates from Mott’s variable range hopping theory (VRH) [42], which is often used in
146
polymer hopping theory [43,44]. VRH accounts for deficiencies in the prediction of transfer integrals
147
within amorphous systems using the above method, which do not sufficiently suppress the electronic
148
coupling between chromophores with large separations, leading to unphysical carrier motion [31]. The
149
reorganization energy,λ, is the energy required to polarize and depolarize a chromophore, in response 150
to a carrier hopping from one to another. This is material specific, and for P3HT we setλ=306 meV 151
based on electronic structure calculations for a single monomer [45].
152
After the hopping rates have been calculated between every pair of neighboring chromophores in the system, KMC simulations are performed to explore the motion of carriers throughout the morphology. KMC is an event-based technique, which uses a uniformly generated random number in the interval (0, 1),x, to calculate the wait time until a particular event,τ, based on the corresponding
rate coefficient,k:
τ= −lnx
k . (3)
The KMC algorithm then queues up the wait times and selects the event with the shortest wait time
153
as the next event to occur chronologically, implicitly assuming it to be the most probable event. The
154
wait time is then subtracted from all other events in the queue and any new wait times are queued up.
155
MorphCT can consider several types of events that are relevant for organic electronic device operation,
156
such as photo- and dark-injection, as well as exciton dynamics. However, in this work, only one
157
event type is considered - the hop of a charge carrier from chromophoreito chromophorejwith a rate
158
calculated usingEquation 2.
159
By repeating this algorithm hundreds of thousands or millions of times, a carrier’s trajectory through the system can be mapped and its total displacement calculated. The morphologies in this investigation are periodically bound, allowing carriers to move hundreds of nanometers through a periodically repeating system comprised of∼10 nm unit cells. We calculate the mean squared displacement (MSD), averaged over 10,000 carriers each initialized on a randomly selected chromophore, for different total simulation times,t. The gradient of the MSD as a function oftgives the carrier diffusivity,D, which can be related to the mobility,µ, through the three-dimensional Einstein
relation:
µ= qD
whereqis the unit charge. Carrier trajectories are obtained in isolation (i.e. no Coulombic interactions
160
with other carriers) and no external electric field is applied. The result is therefore a “best case”
161
zero-field carrier mobility,µ0, that describes the diffusion of the carriers at low charge density, similar
162
to time-of-flight experiments. Given the absence of other charges in the system restricting carrier
163
movement, and the small, periodically repeating simulation volume enhancing the effect of order in
164
the system, we expect our mobility values to be somewhat larger than those determined experimentally.
165
However, we argue that the simulated mobilities calculated in this work are still an important proxy
166
for semi-conducting electronic device performance, and can be compared to each other to make
167
predictions about expected charge transport trends in physical devices.
168
3. Results and Discussion
169
Here we calculate the zero-field hole mobilities in P3HT morphologies predicted with molecular
170
simulations in [12]. With both morphologies and predicted mobilities in-hand, we first evaluate
171
structural correlations with mobility by comparing two order parameters. Second, we perform
172
simulations of polydisperse P3HT chains to investigate a mobility anomaly observed for semi-ordered
173
monodisperse chains.
174
3.1. Structure and mobility in “small” morphologies
175
In previous work, we predicted equilibrium morphologies of P3HT at∼100 combinations of
176
temperature,T, and solvent strength,εs [12]. Each of these model systems is monodisperse, with
177
100 15-mers in a cubic periodic volume with 7 nm edges. At each (T,εs) state-point, we calculate
178
the degree of order,ψ, in the system by identifying clusters ofπ-stacked thiophene rings with close 179
positions and orientations. The resultant phase diagram is shown inFigure 2a. A band of highly
180
ordered morphologies is visible spanningεs from lowT∼300 K and good solventεs =0.2 to high
181
T ∼ 700 K and poor solventεs = 1.2. This band is surrounded by state-points atT < 300 K and
182
T>1000 K that show a poor degree of order regardless of the solvent quality.
183
The zero-field hole mobilities, as calculated by MorphCT for each morphology state-point (∼100
184
systems), are shown inFigure 2b. These mobilities span an order of magnitude from 0.01≤µ0<0.15
185
cm2/Vs as T andεs. We note these mobilities are roughly two orders of magnitude higher than
186
observed in experiment (µ=1×10⁻⁵to 1×10⁻³cm2/Vs for time-of-flight measurements [18–21]). 187
First and foremost, we attribute this to the periodic volume with only 7 nm edges; there is little
188
opportunity for boundaries between transport domains to emerge. That is, periodic volumes may over
189
predict mobility because grain boundaries (or their analogues) are rare. Second, contaminants such as
190
residual solvent are not represented in our molecular model, and would otherwise lead to restricted
191
mobility in experiments. The lowestµ0are seen at the highest processing temperatures (>1100 K) in
192
poor solvents (εs= 1.2). Conversely, the highestµ0values are seen in the morphologies prepared at low
193
temperatures (<200 K) in good solvents (εs '0.2). A band of high mobility is seen in a qualitatively
194
similar region toFigure 2a, spanning fromT∼300 K andεs =0.2 toT ∼700 K andεs =1.2. This
195
suggests that the strong ordering of thiophene backbones into large crystalline clusters is an important
196
prerequisite for efficient carrier transport. However, it is clear that this is not the only factor affecting
197
the transport, as state-points with lowT <300 K andεs <0.5 are also shown to have high mobilities,
198
despite a reducedψvalue. We therefore deduce that our simple definition forψ, which only considers 199
the conjugation and crystallization of the thiophene backbones, does not sufficiently encode all of the
200
morphological features required to describe charge transport in the system.
201
In an attempt to better correlate nanostructure to mobility, we propose a new order parameter that supplementsψwith additional structural information not directly encodedψ’s calculation of
backbone conjugation. Here we utilize disorder in aliphatic side-chains: it is straightforward to calculate bond-stretching statistics, these are structural metrics not included in the clustering criteria ofψ, and it is plausible that high variance in bond-stretching is a proxy for disorder between the
0.2 0.4 0.6 0.8 1.0 f 250 500 750 1000 1250 Temperature (K)
=1.11 g/cm3
0.2 0.4 0.6 0.8
𝜓
0.2 0.4 0.6 0.8 1.0 1.2 f 250 500 750 1000 1250 Temperature (K)
log( 0) (cm2/Vs)
2.04 1.86 1.68 1.50 1.32 1.14 0.96 0.78
0.2 0.4 0.6 0.8 1.0 1.2 f 250 500 750 1000 1250 Temperature (K)
log( 0) (cm2/Vs)
2.04 1.86 1.68 1.50 1.32 1.14 0.96 0.78
a
b
0.2 0.4 0.6 0.8 1.0 1.2 f 250 500 750 1000 1250 Temperature (K)
, =1.11 g/cm3
0.0 0.2 0.4
𝜓
′
c
0.2 0.4 0.6 0.8 1.0 1.2 s 250 500 750 1000 1250 Temperature (K)
log( 0) (cm2/Vs)
2.04 1.86 1.68 1.50 1.32 1.14 0.96 0.78
0.2 0.4 0.6 0.8 1.0 1.2 s 250 500 750 1000 1250 Temperature (K)
log( 0) (cm2/Vs)
2.0 1.8 1.6 1.5 1.3 1.1 0.9 0.7
0.2 0.4 0.6 0.8 1.0 1.2 s 250 500 750 1000 1250 Temperature (K)
log( 0) (cm2/Vs)
2.04 1.86 1.68 1.50 1.32 1.14 0.96 0.78
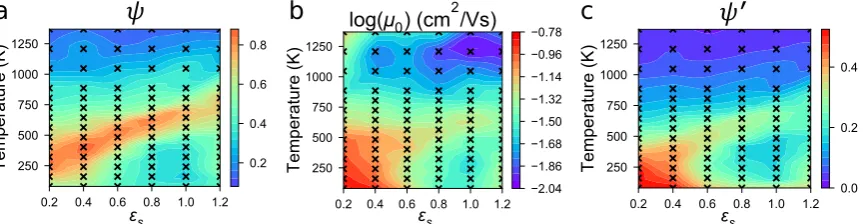
Figure 2.Heatmaps of the various properties explored for each simulation. In all cases, black “x”s correspond to state-points where simulations were conducted, with values in between determined by linear interpolation. Red regions correspond to a large value of the property, whereas blue regions correspond to a smaller value. Color bars are normalized to the maximum value of each parameter. (a) The structural order of each system given by the order parameter,ψ, as in the previous work (Figure
replicated from [12] with authors’ permission). (b) The hole mobility,µ0, varying between red (∼0.15
cm2/Vs) and blue (∼ 0.01 cm2/Vs) There is not a perfect mapping betweenψandµ0- lower and higher temperature systems have higher and lowerµ0respectively, which is not captured effectively byψ. (c) The modified order parameter,ψ0, created by normalizingψby the standard deviation of
aliphatic bond lengths.ψ0is a significant improvement overψ, as it captures the presence of additional
disorder in the system.
considered in this way, as the backbone thiophene rings are rigid and so have fixed bond, angle, and dihedral constraints. We define ˜σifor the morphology at each unique state-point (subscript “i”), which is the standard deviation of the bond length distribution for the state-point,σi, normalized by the minimum value ofσiacross all state-points:
˜
σi=
σi min{σi}
. (5)
Our new order parameterψ0is defined by: 202
ψ0i = ψi
˜
σi. (6)
This normalization ofψprovides a new lens for structure, as shown inFigure 2c. Qualitatively,ψ0 203
better matches the mobility trends inFigure 2b thanFigure 2a. This agreement suggests that the
204
conformation of the aliphatic side-chains is a useful proxy for disorder to alleviate short-comings in
205
ψ’s binary clustered/not clustered algorithm and better captures factors influencing carrier mobility. 206
We note thatψ0still tends to under predictµ0at high temperatures>750 K, especially for systems
207
dissolved in poor solvents withεs ≤0.6. However, for experimentally relevant temperatures and good
208
solvents, there is broad agreement betweenψ0andµ0, which is encouraging for the development of a
209
structural metric that can predict charge transport properties of a morphology without performing
210
KMC. The correlation betweenψ0andµ0is quantified in figureFigure 3. The two properties are shown
211
to track better than random, with a correlation coefficientR2=0.62 across all state-points, although
212
we note increased variability inµ0for systems with lowψ0. Many of the lowψ0values correspond to 213
systems at high temperatures (>750 K), suggesting thatψ0tends to over predict the backbone disorder 214
arising from thermal contributions. Generally however, correlation betweenψ0andµ0suggests thatψ0 215
can be used to quickly identify processing protocols that are expected to have good charge transport
216
properties to submit for further investigation.
0.0 0.1 0.2 0.3 0.4
(Arb. U)
102 101
0
(cm
2
/Vs)
Best-Fit
R
2=0.62
Measured
200400 600 800 1000 1200
Temperature (K)
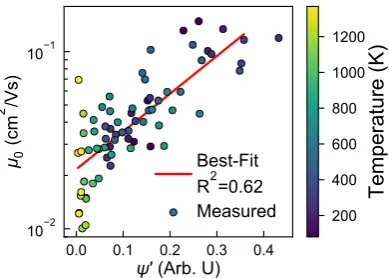
Figure 3.The zero-field mobility,µ0shows reasonable correlation toψ0(R2=0.62), indicating it can be
useful as a purely structural metric to broadly predict interesting processing state-points to investigate further.
3.2. Structure and mobility in “large” and polydisperse cases
218
To investigate our hypothesis that the high charge mobilities predicted above in “small” volumes
219
is a consequence of these volume we perform charge mobility calculations on systems with 10 times
220
as many simulation elements. Although they contain 1,000 oligomers, each edge of these volumes is
221
just over twice as long (15 nm) as the 100 oligomer simulations (7 nm) because the cubic box length
222
scales as the cube root of the number of elements. These volumes are expected to be larger than the
223
average size of the P3HT crystallites, allowing for multiple crystalline and amorphous domains in the
224
same sample in accordance with experiment, but are still smaller than the thickness of the thin-films
225
developed experimentally. While these larger systems hold promise for giving better insight into
226
charge transfer pathways, we recognize the periodic volumes could still lead to inflated absolute
227
mobilities compared to time-of-flight measurements.
228
3.2.1. Mobility and Carrier Behavior
229
The mobilitiesµ0 for the three classes of monodisperse 1,000-molecule P3HT morphologies:
230
amorphous (ψ0 ∼ 0.17), semi-crystalline (ψ0 ∼ 0.25), and crystalline (ψ0 ∼ 0.33) are shown in 231
Figure 4a, along with error bars representing the standard deviations from 10 independent microstates.
232
Additionally, all calculated charge transport parameters, along with their associated standard errors,
233
are listed inTable 1. Unlike in the “small” systems, we observe no correlation between mobility and
234
ψ0. The amorphous and crystalline cases have mobilities commensurate with the “small” systems 235
(Figure 2), whereas the semi-crystalline system exhibits a significantly lower mobility. We can interpret
236
this observation in two opposing ways: On one hand, zero-field charge mobility ofµ0=1.56×10⁻²
237
cm2/Vs is nearing the 1×10⁻³cm2/Vs observed in experiments, and seems to support our working
238
hypothesis that boundaries between crystallites should inhibit charge transport. On the other hand,
239
this observation is surprising because P3HT is widely regarded to form a semi-crystalline structure in
240
experimental devices, which we expect to have higher charge mobility than the amorphous case [46].
241
We note that further modifications toψ0that explicitly accounts for the variation in transfer integrals 242
across chromophores does not address the fact that the lowest mobility comes from medium order
243
(See SI Section 2 for details). Throughout this work (e.g.,Figure 4) we color backbones of P3HT based
244
upon the cluster to which they belong, which depends on charge hops, and is discussed in detail in SI
245
Section 3.
246
To further investigate the anomalous semi-crystalline case, we consider the directions charges
247
move during the KMC simulations. It might be expected that the carrier trajectory anisotropy controls
248
the overall mobility—a high anisotropy suggests that carriers are restricted to a particular direction,
Table 1. Charge transport metrics calculated for the three degrees of ordering in systems of 1,000 monodisperse P3HT chains. Average values for 10 statistically independent samples are listed, along with the corresponding standard error over the 10 measurements. Clusters are defined based on a hopping frequency cut-off as described in the text.
Property Amorphous Semi-Crystalline Crystalline
Mobility (1.085±0.006)×10−1 (0.156±0.003)×10−1 (1.23±0.01)×10−1
Anisotropy 0.0031±0.0001 0.0210±0.0006 0.153±0.001
Intra-molecular rate (1.813±0.001)×1015 (2.493±0.001)×1015 (1.8703±0.0006)×1015 Inter-molecular rate (0.834±0.001)×1013 (2.208±0.005)×1013 (2.642±0.005)×1013
∆Eijstd 0.06252±0.00006 0.1114±0.0001 0.0571±0.0001
Total clusters 500±10 1540±10 467±6
Large (>6) clusters 134±1 209±1 73±1
Largest cluster size 9600±200 2100±100 8300±300
making it more likely to increase its mean squared displacement over the same amount of time than in
250
a system where transport in three dimensions is equally likely. InFigure 4b, carrier transport is shown
251
to be anisotropic in the crystalline morphology, indicating a consistent grain orientation between the
252
crystalline regions. The anisotropy is significantly lower in the semi-crystalline case, where a variety of
253
grain orientations are present. Perhaps unsurprisingly, the amorphous systems exhibit near-spherical
254
carrier transport, which is consistent with the lack of ordered crystallines in the morphologies. The
255
anisotropy is somewhat higher in the semi-crystalline case, where a variety of grain orientations
256
are present. InFigure 4b, carrier transport is shown to be anisotropic in the crystalline morphology,
257
indicating a consistent grain orientation between the crystalline regions. Given that the anisotropy of
258
the semi-crystalline morphology is intermediate between the more and less ordered systems (unlike
259
the calculated mobilities), we deduce that anisotropy is not the sole factor governing carrier mobility.
260
Our calculated hopping rate distributions presented inFigure 4c-e in isolation would also suggest
261
intermediate mobilities for the semi-crystalline system, as the availability of fast (highki,j∼1014s−1)
262
inter-molecular hops appears to decrease with decreasingψ0. Therefore, the distribution of hopping 263
rates alone is insufficient to predict performance - the rate, location, and neighborhood of those hops
264
in the morphology are all required in order to make predictions.
265
The amorphous morphology (Figure 4f) explicitly shows no crystallization, instead forming a
266
disordered matrix of entangled polymer chains. However, with the chains colored based on charge
267
hopping, it is clear that there is one large (red) percolating cluster that connects most chains to
268
most other. The structure of the crystalline morphology (Figure 4h) is expectedly lamellar, with
269
one large, ordered percolating (red) cluster. The semi-crystalline system (Figure 4g) shows small
270
regions of crystallized lamellae, interspersed within an amorphous matrix. The prevalence of multiple
271
clusters indicates that charges have trouble hopping between crystallites. This is the first evidence we
272
observe of non-intermediate properties of the semi-crystalline system compared to the crystalline and
273
amorphous morphologies. Further analysis of the hops occurring within the ordered crystallites of the
274
semi-crystalline and crystalline morphologies reveals that charges can travel in fast “loops” within
275
ordered regions wherein hops are fast, but total displacement is low (SI Section 4). That is, carriers in
276
ordered regions have a high probability of spending long periods of time hopping between the same
277
set of chromophores within the same plane, without increasing their displacement from their start
278
position. Because these carriers are effectively “trapped”, if the ordered regions are not connected,
279
overall mobility suffers.
280
Considering these factors in aggregate, we conclude that the crystalline morphology mobility of
281
1.16×10⁻¹cm2/Vs is due primarily to fast carrier transport along the ordered crystallites, and note
282
that it would be even higher if carriers did not frequently “loop around” within the large ordered
283
regions rather than travel ballistically. The mobility through the amorphous morphology is restricted
284
by slower overall isotropic carrier motion, but the lack of traps explains higher mobility than the
semi-crystalline case. The proximity of the amorphous case mobility (1.02×10⁻¹cm2/Vs) to the
286
crystalline case highlights the importance of trapping to overall carrier mobility. This also bears out
287
some recent investigations that have shown beneficial carrier behavior in less conventionally-ordered
288
systems [47]. The semi-crystalline morphology ranks highly in isotropic transport,andlow in ordered
289
domain alignment, resulting in an order-of-magnitude lower mobility of 1.64×10⁻²cm2/Vs.
290
In summary, we find that a convolution of different structural and transport metrics is required
291
in order to correctly predict carrier mobilities - no one factor is sufficient to explain the observed
292
trend. Carrier transport is strongly dependent on the local neighborhood around each chromophore
293
- if a carrier has easy access to the surrounding chromophores but not beyond, then it will become
294
trapped, even if the average cluster and chromophore characteristics of the whole morphology are
295
favourable. KMC simulations are the current best way to convolve the structural metrics and obtain
296
the device performance behavior - it is presently not possible to map directly between structure
297
and performance otherwise. For the three degrees of order considered here, we have shown that the
298
amorphous morphology has stronger connections (characterized by a smaller number of larger clusters)
299
than the more-ordered semi-crystalline one, leading to a higher carrier mobility and improved charge
300
transport. That this disordered charge mobility is higher than expected in experiments suggests there
301
are improvements to the absolute value charge hopping rates, or assumptions about chromophore size
302
and electron delocalization that could improve mobilities calculated with KMC.
303
3.2.2. Tie chains in polydisperse systems
304
We hypothesize that the difference in mobility between the semi-crystalline system and the
305
crystalline and amorphous morphologies is due to the monodispersity and short length of the chains
306
studied here. Generally in experimental devices, P3HT is obtained with a molecular weight in
307
excess of 50 kDa, corresponding to chain polymerisation lengths of many hundreds or thousands
308
of monomers [28]. In such systems, the chains are long enough to fold back on themselves several
309
times, forming sheet-style crystallites in the system, where a single chain can form multiple layers of
310
the same crystallite [48]. Previous work has shown that, while 15mer chains were able to reproduce
311
experimental scattering patterns, they were too short to undergo self-folding. Conversely, chains with
312
50 repeat units were able to undergo self-folding, but required untenably long simulation times to
313
order into the experimentally observed structures [12]. In the case of longer chains, multiple folds
314
and multiple chains can stack together to increase the size of the crystallite regions, with portions of
315
the outermost chains remaining outside of the crystallite, forming an amorphous matrix between the
316
grains. An example of this is seen inFigure 5a and b in which a series of longer chains or a single
317
long chains spans multiple clusters. In some cases, these “tails” may connect to a different crystallite,
318
effectively forming a “tie-chain” between two crystallites [46]. Since carrier motion is faster along a
319
chain than between neighboring chains, this provides a fast and efficient route for carriers to transport
320
between crystallites, which is sometimes known as a “carrier highway”. In our work, chains with 15
321
repeat units do not self-assemble tie-chains as evidenced by the semi-crystalline system explored here.
322
To test whether longer chains will serve as tie-chains between otherwise charge-trapping
323
crystallites, we investigate morphologies made with polydisperse chains up to 50 repeat units (∼8
324
kDa). The maximum of 50 repeat units is chosen to prevent any individual chain from interacting with
325
itself in more than one image of the periodic volume. Due to these size constraints, we are unable to
326
achieve experimentally relevant chain lengths (for example, 20-100 kDa from Sigma-Aldrich or Reike
327
Metals). We can, however, achieve experimental polydispersities of 1.8 (See SI Section 5 for details).
328
Furthermore, simulating a polydisperse distribution of chain lengths allows us to introduce chains
329
that may be long enough to span several crystallites, while still maintaining appropriate length-scales
330
to obtain good agreement with experimental scattering patterns (also demonstrated in SI Section 5).
331
Polydisperse morphologies are generated using the same process as the monodisperse cases
332
as explained previously, and result in three similar degrees of ordering: amorphous (ψ0 ∼0.18), 333
a
b
c
Figure 5.Long polymer chains are able to link clusters together to enhance charge transport between them. The links can either consist of (a) multiple chains or (b) a single chain extending through the surrounding amorphous matrix. (c) The semi-crystalline polydisperse systems, with chains up to 50 monomers and polydispersities of 1.8, have double the amount of tie-chains spanning two clusters as the semi-crystalline monodisperse system consisting only 15mers. Additionally, some chains in the polydisperse system span four or five clusters. The bars in the histogram overlap so that the frequency of chains spanning multiple clusters is given by the top of the orange and blue bars for the mono- and polydisperse systems respectively.
morphologies with KMC and present them inFigure 6a. By including a distribution of chain lengths,
335
the expected order-mobility trend has been reclaimed - mobility increases with additional order.
336
Generally,µ0is slightly higher in the polydisperse systems than in the monodisperse 15mer systems,
337
as the increased average molecular weight (2.9±0.1 kDa for the polydisperse and 2.5 kDa for the
338
monodisperse systems) leads to a higher proportion of fast intra-chain hops.Figure 6b-d show that,
339
unlike the monodisperse systems inFigure 4f-h, all three of the systems are highly connected and
340
form a single, large cluster spanning the entire system (colored red). This higher connectivity is due
341
to the presence of more chains spanning between crystallites in the polydisperse case than the short
342
monodisperse case (Figure 5c). The improved connectivity is quantified inTable 2, where the number
343
of large clusters and the size of the largest cluster are both intermediate between the amorphous and
344
crystalline systems. Additionally,Table 2shows a significantly lower carrier trajectory anisotropy in
345
the case of the semi-crystalline and crystalline polydisperse systems than in the monodisperse case
346
(Table 1). This suggests that charges are no longer restricted by grain boundaries and are able to change
347
direction more easily - a process that was prohibitively slow in the monodisperse case. These results
348
are in good agreement with previous investigations that show tie-chains are a dominating factor in
349
carrier transport through polymer devices [28,49].
350
c
b
d
a
0.20 0.25 0.30
(Arb. U.)
1.2×101 1.4×101 1.6×101 1.8×101
0
(cm
2 /Vs)
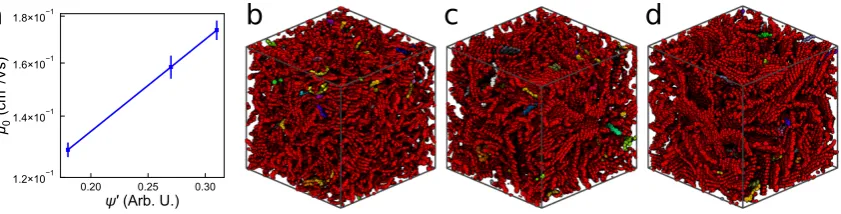
Figure 6. (a) Zero-field mobilities for the polydisperse P3HT simulations based on the modified order parameterψ0. Morphologies showing regions of high connectivity for the (b) amorphous, (c)
semi-crystalline, and (d) crystalline systems.
The observation thatψ0andµ0are strongly correlated in large, polydisperse systems (Figure 6),
351
somewhat correlated in small, monodisperse systems (Figure 3), and poorly correlated in large,
352
monodisperse systems (Figure 4a), highlights a shortcoming in using purely structural metrics to
Table 2.Charge transport metrics calculated for three degrees of order in polydisperse P3HT systems. Average values over 10 statistically independent samples are listed, along with the corresponding standard error over the 10 measurements. Clusters are defined based on a hopping frequency cut-off as described in the text.
Property Amorphous Semi-Crystalline Crystalline
Mobility (1.29±0.02)×10−1 (1.58±0.04)×10−1 (1.74±0.04)×10−1
Anisotropy 0.0040±0.0005 0.016±0.001 0.020±0.004
Intra-molecular rate (1.3413±0.0003)×1015 (1.4670±0.0007)×1015 (1.5137±0.0002)×1015 Inter-molecular rate (0.700±0.004)×1013 (1.231±0.0007)×1013 (1.590±0.007)×1013
∆Eijstd 0.0554±0.0002 0.0549±0.0001 0.0538±0.0001
Total clusters 400±23 350±17 380±21
Large (>6) clusters 130±10 70±6 60±3
Largest cluster size 11200±260 13200±200 13500±100
predict charge transport. In isolation, structure can provide some insight into the average rate at
354
which hops can occur in the morphology - of the hopping criteria studied in this investigation,
355
only the hopping rate is described byψ0. This relationship is quantified by the increase of average 356
inter-molecular hopping rates for both the monodisperse (Table 1shows 0.834→2.208→2.642×10¹³
357
for the amorphous, semi-crystalline, and crystalline structures respectively) and polydisperse systems
358
(Table 2: 0.700 → 1.231 → 1.590×10¹³). Graphically this is also demonstrated by the shift of
359
the inter-molecular hopping rate peak towards the intra-molecular peak inFigure 4c-e. However,
360
considering only the hopping rate distributions fails to take into account the local neighborhood of
361
hops available. Therefore,ψ0is unable to distinguish between regions where charges may be trapped 362
within crystallites, or able to flow along a fast extended path. This is confirmed by our clustering
363
analysis in SI Section 2 - no combination of purely structural cluster criteria was able to produce the
364
same cluster distributions observed in our simulations. We therefore conclude that knowledge of the
365
carrier hopping rates in the chromophore network is insufficient - one must also know how these rates
366
are distributed in order to identify regions of trapping that will reduce carrier mobilities. This is a key
367
advantage of computational methods such as KMC—even though carriers have no knowledge of the
368
surrounding hop neighborhood (all hops are performed on a chromophore-by-chromophore basis
369
to first order), the extensive statistical averaging of the method allows us to probe the local hopping
370
neighborhood and identify crystallites.
371
4. Conclusions
372
Using QCC to inform KMC simulations of charge transport in P3HT morphologies currently
373
gives the best insight into how nanostructure influences charge mobility. These calculations
374
confirm that charges move most quickly along P3HT backbones and second-most quickly between
375
aligned backbones. However, because charges rarely hop between distinct crystallites, tie-chains
376
connecting ordered crystallites are essential to mitigating the trapping of charges that would otherwise
377
lower mobility. By combining the large volumes from optimized MD simulations of P3HT with
378
QCC-informed charge transport, this is the first work to definitively show the impact tie-chains have
379
on charge mobility.
380
This work highlights two areas for improving mobility predictions. Firstly, the present work
381
shows that purely structural metrics miss important factors for charge transport, but this does not
382
preclude the existence of better metrics that are more predictive than those studied here. That is,
383
discovery of structural metrics that are good enough to predict mobility without having to perform
384
KMC simulations would save a lot of time. Secondly, while the mobilities predicted with KMC are
385
the current state-of-the-art, they are systematically about two orders of magnitude higher than in
386
experiments. Whether this is due to inaccurate assumptions about what comprises a chromophore, or
387
whether improvements to calculating charge hopping rates are needed, or something else, it seems like
quantitative predictions of mobility are on the horizon. Exploring these improvements to the KMC
389
calculations presented here and investigating a broader range of chemistries to further validate these
390
techniques is the subject of future work.
391
Supplementary Materials: The following are available online: Section 1 comparing the differences in HOMO
392
splitting between more expensive density functional theory and ZINDO/S, Section 2 extendingψ0to explicitly 393
consider transfer integrals, Section 3 explaining how systems are clustered based on hops, Section 4 detailing
394
intra-cluster trapping, and Section 5 discussing the generation of polydisperse simulations.
395
Acknowledgments: This work used the Extreme Science and Engineering Discovery Environment (XSEDE),
396
which is supported by National Science Foundation grant number ACI-1053575 [50]. This material is based upon
397
work supported by the National Science Foundation under Grant No. (1229709), (1653954), and (1835593). The
398
authors thank Chris Muhich for his assistance in comparing ZINDO/S to DFT.
399
Author Contributions: Funding acquisition, Eric Jankowski; Investigation, Evan Miller and Matthew Jones;
400
Software, Evan Miller and Matthew Jones; Supervision, Eric Jankowski; Writing – original draft, Evan Miller,
401
Matthew Jones and Eric Jankowski; Writing – review & editing, Evan Miller, Matthew Jones and Eric Jankowski.
402
Conflicts of Interest:The authors declare no conflict of interest.
403
Abbreviations
404
405
15mer - P3HT chain containing 15 monomers
406
50mer - P3HT chain containing 50 monomers
407
εs- solvent quality
408
KMC - Kinetic Monte Carlo
409
MD - Molecular Dynamics
410
µ0Zero-field Mobility
411
OPLS - Optimized Performance for Liquid Simulations
412
OPV - Organic Photovoltaic
413
P3HT - Poly(3-hexylthiophene)
414
ψ- order parameter 415
ψ0- modified order parameter 416
ρ- density 417
σ- standard deviation 418
T- Temperature
419
VRH - Variable Range Hopping
420
QCC - Quantum Chemical Calculations
421
422
1. Shaheen, S.E.; Ginley, D.S.; Jabbour, G.E. Organic-Based Photovoltaics: Toward Low-Cost Power
423
Generation. MRS Bulletin2005,30, 10–19. doi:10.1557/mrs2005.2.
424
2. Coakley, K.M.; McGehee, M.D. Conjugated polymer photovoltaic cells. Chemistry of Materials2004,
425
16, 4533–4542. doi:10.1021/cm049654n.
426
3. Espinosa, N.; Hösel, M.; Angmo, D.; Krebs, F.C. Solar Cells with One-Day Energy Payback for the Factories
427
of the Future. Energy & Environmental Science2012,5, 5117. doi:10.1039/c1ee02728j.
428
4. Meng, L.; Zhang, Y.; Wan, X.; Li, C.; Zhang, X.; Wang, Y.; Ke, X.; Xiao, Z.; Ding, L.; Xia, R.; Yip, H.L.;
429
Cao, Y.; Chen, Y. Organic and solution-processed tandem solar cells with 17.3% efficiency.Science2018,
430
2612, eaat2612. doi:10.1126/science.aat2612.
431
5. Yang, X.; Loos, J. Toward high-performance polymer solar cells: The importance of morphology control.
432
Macromolecules2007,40, 1353–1362. doi:10.1021/ma0618732.
433
6. Chen, W.; Nikiforov, M.P.; Darling, S.B. Morphology characterization in organic and hybrid solar cells.
434
Energy & Environmental Science2012,5, 8045–8074. doi:10.1039/c2ee22056c.
435
7. Dang, M.T.; Wantz, G.; Bejbouji, H.; Urien, M.; Dautel, O.J.; Vignau, L.; Hirsch, L. Polymeric Solar Cells
436
Based on P3HT:PCBM: Role of the Casting Solvent.Solar Energy Materials and Solar Cells2011,95, 3408–3418.
437
doi:10.1016/j.solmat.2011.07.039.
438
8. Surin, M.; Leclère, P.; Lazzaroni, R.; Yuen, J.D.; Wang, G.; Moses, D.; Heeger, A.J.; Cho, S.;
439
Lee, K. Relationship between the microscopic morphology and the charge transport properties
in poly(3-hexylthiophene) field-effect transistors. Journal of Applied Physics 2006, 100, 033712.
441
doi:10.1063/1.2222065.
442
9. Verploegen, E.; Mondal, R.; Bettinger, C.J.; Sok, S.; Toney, M.F.; Bao, Z. Effects of Thermal Annealing
443
Upon the Morphology of Polymer-Fullerene Blends. Advanced Functional Materials2010,20, 3519–3529.
444
doi:10.1002/adfm.201000975.
445
10. Park, J.H.; Kim, J.S.; Lee, J.H.; Lee, W.H.; Cho, K. Effect of Annealing Solvent Solubility on the Performance
446
of Poly(3-hexylthiophene)/Methanofullerene Solar Cells. The Journal of Physical Chemistry C2009,
447
113, 17579–17584. doi:10.1021/jp9029562.
448
11. Bertho, S.; Janssen, G.; Cleij, T.J.; Conings, B.; Moons, W.; Gadisa, A.; D’Haen, J.; Goovaerts, E.; Lutsen,
449
L.; Manca, J.; Vanderzande, D. Effect of temperature on the morphological and photovoltaic stability of
450
bulk heterojunction polymer:fullerene solar cells.Solar Energy Materials and Solar Cells2008,92, 753–760.
451
doi:10.1016/j.solmat.2008.01.006.
452
12. Miller, E.D.; Jones, M.L.; Henry, M.M.; Chery, P.; Miller, K.; Jankowski, E. Optimization and Validation
453
of Efficient Models for Predicting Polythiophene Self-Assembly. Preprint 2018, 2018110115, 1–15.
454
doi:10.20944/preprints201811.0115.v1.
455
13. Weis, M.; Lin, J.; Taguchi, D.; Manaka, T.; Iwamoto, M. Analysis of transient currents in organic field
456
effect transistor: The time-of-flight method. Journal of Physical Chemistry C2009, 113, 18459–18461.
457
doi:10.1021/jp908381b.
458
14. Mazzio, K.a.; Luscombe, C.K. The future of organic photovoltaics. Chemical Society Reviews2015,44, 78–90.
459
doi:10.1039/C4CS00227J.
460
15. Dang, M.T.; Hirsch, L.; Wantz, G. P3HT:PCBM, best seller in polymer photovoltaic research. Advanced
461
Materials2011,23, 3597–3602. doi:10.1002/adma.201100792.
462
16. Sirringhaus, H.; Brown, P.J.; Friend, R.H.; Nielsen, M.M.; Bechgaard, K.; Langeveld-Voss, B.M.W.; Spiering,
463
a.J.H.; Janssen, R.a.J.; Meijer, E.W.; Herwig, P.; de Leeuw, D.M. Two-Dimensional Charge Transport in
464
Self-Organized, High-Mobility Conjugated Polymers.Nature1999,401, 685–688. doi:10.1038/44359.
465
17. Chang, J.F.; Sun, B.; Breiby, D.W.; Nielsen, M.M.; Sölling, T.I.; Giles, M.; McCulloch, I.; Sirringhaus, H.
466
Enhanced Mobility of poly(3-hexylthiophene) transistors by spin-coating from high-boiling-point solvents.
467
Chemistry of Materials2004,16, 4772–4776. doi:10.1021/cm049617w.
468
18. Pandey, S.S.; Takashima, W.; Nagamatsu, S.; Endo, T.; Rikukawa, M.; Kaneto, K. Regioregularity vs
469
Regiorandomness: Effect on Photocarrier Transport in Poly(3-hexylthiophene). Japanese Journal of Applied
470
Physics2000,39, L94–L97. doi:10.1143/JJAP.39.L94.
471
19. Kim, Y.; Cook, S.; Tuladhar, S.M.; Choulis, S.A.; Nelson, J.; Durrant, J.R.; Bradley, D.D.C.; Giles, M.;
472
McCulloch, I.; Ha, C.S.S.; Ree, M. A Strong Regioregularity Effect in Self-Organizing Conjugated
473
Polymer Films and High-Efficiency Polythiophene:Fullerene Solar Cells. Nature Materials2006,5, 197–203.
474
doi:10.1038/nmat1574.
475
20. Ballantyne, A.M.; Chen, L.; Dane, J.; Hammant, T.; Braun, F.M.; Heeney, M.; Duffy, W.; McCulloch, I.;
476
Bradley, D.D.C.; Nelson, J. The Effect of Poly(3-hexylthiophene) Molecular Weight on Charge Transport
477
and the Performance of Polymer:Fullerene Solar Cells. Advanced Functional Materials2008,18, 2373–2380.
478
doi:10.1002/adfm.200800145.
479
21. Mauer, R.; Kastler, M.; Laquai, F. The Impact of Polymer Regioregularity on Charge Transport and
480
Efficiency of P3HT:PCBM Photovoltaic Devices. Advanced Functional Materials2010, 20, 2085–2092.
481
doi:10.1002/adfm.201000320.
482
22. Barker, J.A.; Ramsdale, C.M.; Greenham, N.C. Modeling the Current-Voltage Characteristics of Bilayer
483
Polymer Photovoltaic Devices. Physical Review B2003,67, 075205. doi:10.1103/PhysRevB.67.075205.
484
23. Koster, L.J.A.; Smits, E.C.P.; Mihailetchi, V.D.; Blom, P.W.M. Device Model for the Operation
485
of Polymer/Fullerene Bulk Heterojunction Solar Cells. Physical Review B 2005, 72, 085205.
486
doi:10.1103/PhysRevB.72.085205.
487
24. Einax, M.; Dierl, M.; Nitzan, A. Heterojunction Organic Photovoltaic Cells as Molecular Heat Engines: A
488
Simple Model for the Performance Analysis. The Journal of Physical Chemistry C2011,115, 21396–21401.
489
doi:10.1021/jp205856x.
490
25. Rolland, N.; Franco-Gonzalez, J.F.; Volpi, R.; Linares, M.; Zozoulenko, I.V. Understanding
491
Morphology-Mobility Dependence in PEDOT:Tos. Physical Review Materials 2018, 2, 045605.
492
doi:10.1103/PhysRevMaterials.2.045605.
26. Cheung, D.L.; McMahon, D.P.; Troisi, A. Computational Study of the Structure and Charge-Transfer
494
Parameters in Low-Molecular-Mass P3HT. The Journal of Physical Chemistry B2009, 113, 9393–9401.
495
doi:10.1021/jp904057m.
496
27. Groves, C.; Kimber, R.G.E.; Walker, A.B. Simulation of Loss Mechanisms in Organic Solar Cells: A
497
Description of the Mesoscopic Monte Carlo Technique and an Evaluation of the First Reaction Method.
498
The Journal of Chemical Physics2010,133, 144110. doi:10.1063/1.3483603.
499
28. Jones, M.L.; Huang, D.M.; Chakrabarti, B.; Groves, C. Relating Molecular Morphology to Charge Mobility in
500
Semicrystalline Conjugated Polymers.Journal of Physical Chemistry C2016,120, 4240–4250,[arXiv:1408.1149].
501
doi:10.1021/acs.jpcc.5b11511.
502
29. Jones, M.L.; Jankowski, E. Computationally connecting organic photovoltaic performance
503
to atomistic arrangements and bulk morphology. Molecular Simulation 2017, 43, 756–773.
504
doi:10.1080/08927022.2017.1296958.
505
30. Jones, M.L.; Dyer, R.; Clarke, N.; Groves, C. Are Hot Charge Transfer States the Primary Cause of Efficient
506
Free-Charge Generation in Polymer:Fullerene Organic Photovoltaic Devices? A Kinetic Monte Carlo Study.
507
Phys. Chem. Chem. Phys.2014,16, 20310–20320. doi:10.1039/C4CP01626B.
508
31. Van, E.; Jones, M.; Jankowski, E.; Wodo, O. Using graphs to quantify energetic and structural order
509
in semicrystalline oligothiophene thin films. Molecular Systems Design & Engineering2018,1, 273–277.
510
doi:10.1039/C8ME00028J.
511
32. Wang, L.; Li, Q.; Shuai, Z.; Chen, L.; Shi, Q. Multiscale study of charge mobility of organic semiconductor
512
with dynamic disorders. Physical Chemistry Chemical Physics2010,12, 3309. doi:10.1039/b913183c.
513
33. Lan, Y.k.; Huang, C.i. A Theoretical Study of the Charge Transfer Behavior of the Highly Regioregular
514
Poly-3-hexylthiophene in the Ordered State. The Journal of Physical Chemistry B2008,112, 14857–14862.
515
doi:10.1021/jp806967x.
516
34. Jones, M.L. MorphCT - DOI: 10.5281/zenodo.1243843, 2018. doi:10.5281/zenodo.1243843.
517
35. Huang, D.M.; Faller, R.; Do, K.; Moulé, A.J. Coarse-Grained Computer Simulations of Polymer/Fullerene
518
Bulk Heterojunctions for Organic Photovoltaic Applications. Journal of Chemical Theory and Computation
519
2010,6, 526–537. doi:10.1021/ct900496t.
520
36. Bhatta, R.S.; Yimer, Y.Y.; Perry, D.S.; Tsige, M. Improved Force Field for Molecular Modeling of
521
Poly(3-hexylthiophene). The Journal of Physical Chemistry B2013,117, 10035–10045. doi:10.1021/jp404629a.
522
37. McMahon, D.P.; Cheung, D.L.; Goris, L.; Dacuña, J.; Salleo, A.; Troisi, A. Relation between Microstructure
523
and Charge Transport in Polymers of Different Regioregularity. The Journal of Physical Chemistry C2011,
524
115, 19386–19393. doi:10.1021/jp207026s.
525
38. Murthy, D.H.K.; Gao, M.; Vermeulen, M.J.W.; Siebbeles, L.D.A.; Savenije, T.J. Mechanism of Mobile Charge
526
Carrier Generation in Blends of Conjugated Polymers and Fullerenes: Significance of Charge Delocalization
527
and Excess Free Energy. The Journal of Physical Chemistry C2012,116, 9214–9220. doi:10.1021/jp3007014.
528
39. Deng, W.Q.; Goddard, W.A. Predictions of Hole Mobilities in Oligoacene Organic Semiconductors
529
from Quantum Mechanical Calculations. The Journal of Physical Chemistry B 2004, 108, 8614–8621.
530
doi:10.1021/jp0495848.
531
40. Brédas, J.L.; Beljonne, D.; Coropceanu, V.; Cornil, J. Charge-Transfer and Energy-Transfer Processes in
532
π-Conjugated Oligomers and Polymers: A Molecular Picture. Chemical Reviews2004,104, 4971–5004. 533
doi:10.1021/cr040084k.
534
41. Marcus, R.A. Chemical and Electrochemical Electron-Transfer Theory. Annual Review of Physical Chemistry
535
1964,15, 155–196. doi:10.1146/annurev.pc.15.100164.001103.
536
42. Mott, N. Conduction in glasses containing transition metal ions. Journal of Non-Crystalline Solids1968,
537
1, 1–17. doi:10.1016/0022-3093(68)90002-1.
538
43. Tsigankov, D.N.; Efros, A.L. Variable Range Hopping in Two-Dimensional Systems of Interacting Electrons.
539
Physical Review Letters2002,88, 176602. doi:10.1103/PhysRevLett.88.176602.
540
44. Fornari, R.P.; Troisi, A. Theory of charge hopping along a disordered polymer chain.Physical Chemistry
541
Chemical Physics2014,16, 9997. doi:10.1039/c3cp54661f.
542
45. Johansson, E.; Larsson, S. Electronic Structure and Mechanism for Conductivity in Thiophene Oligomers
543
and Regioregular Polymer.Synthetic Metals2004,144, 183–191. doi:10.1016/j.synthmet.2004.03.005.
46. Noriega, R.; Rivnay, J.; Vandewal, K.; Koch, F.P.V.; Stingelin, N.; Smith, P.; Toney, M.F.; Salleo, A. A general
545
relationship between disorder, aggregation and charge transport in conjugated polymers. Nature Materials
546
2013,12, 1038–1044. doi:10.1038/nmat3722.
547
47. Franco-Gonzalez, J.F.; Rolland, N.; Zozoulenko, I.V. Substrate-Dependent Morphology and Its Effect on
548
Electrical Mobility of Doped Poly(3,4-ethylenedioxythiophene) (PEDOT) Thin Films.ACS Applied Materials
549
& Interfaces2018,10, 29115–29126. doi:10.1021/acsami.8b08774.
550
48. Brinkmann, M.; Wittmann, J.C. Orientation of regioregular poly(3-hexylthiophene) by directional
551
solidification: A simple method to reveal the semicrystalline structure of a conjugated polymer.Advanced
552
Materials2006,18, 860–863. doi:10.1002/adma.200501838.
553
49. Crossland, E.J.W.; Tremel, K.; Fischer, F.; Rahimi, K.; Reiter, G.; Steiner, U.; Ludwigs, S. Anisotropic
554
Charge Transport in Spherulitic Poly(3-hexylthiophene) Films. Advanced Materials2012,24, 839–844.
555
doi:10.1002/adma.201104284.
556
50. Towns, J.; Cockerill, T.; Dahan, M.; Foster, I.; Gaither, K.; Grimshaw, A.; Hazlewood, V.; Lathrop, S.; Lifka,
557
D.; Peterson, G.D.; Roskies, R.; Scott, J.R.; Wilkens-Diehr, N. XSEDE: Accelerating Scientific Discovery.
558
Computing in Science & Engineering2014,16, 62–74. doi:10.1109/MCSE.2014.80.