To Improvement the Energy Efficient of
PDROP Routing Protocol for using LEACH
and ACO
Sandeep Singh1, Er. Jasdeep Singh Mann2
P.G. Student, Department of Computer Engineering, BMS Engineering College, Sri Muktsar Sahib, India1
Associate Professor, Department of Computer Engineering, BMS Engineering College, Sri Muktsar Sahib, India2
Abstract
In an improvement over the LEACH protocol is also called power efficient gathering in sensor information systems (PEGASIS), it is a near optimal chain based protocol. PEGASIS avoids cluster formation and uses only one in a chain to transmit to the base station (BS) instead of using multiple nodes. PEGASIS can be reduces the power required to transmits the data per round and power draining is uniformly. PEGASIS achieves high energy efficiency since each node only communicates with its closest neighbors. The transmission power can be lowest required to reach its neighbors in the chain format. A disadvantage of PEGASIS having the significant delays . In addition to PEGASIS delay PDORP has the characteristics of both Power Efficient Gathering Sensor Information System (PEGASIS) and DSR routing protocols. In addition to the existing work hybridization of Genetic Algorithm (GA) and Bacterial Foraging Optimization (BFO) is applied to identify energy efficient optimal paths. To resolve all problems the proposed research work is implement the hybrid techniques (combinations of GA and ACO) for directional transmission based energy aware routing protocol and ANT based routing algorithm on WSN using LEACH Protocol is designed . In this work we have computed the distance d of all the nodes from their neighbors and we have compared their distance with the threshold th value of distance, so that they could be connected only when their distance is less than or equals to the threshold value. Before processing transmission firstly node is identified then whether it is lies in cache or not, if lies then do not accept and if not then further processing with trust vector. During the processing the distance is calculated with distance formula and different algorithms applied that is shown in the algorithm step by step. The performances of the system are analyzed using various parameters such as BER, Delay, Energy consumption and Throughput.
Keywords: LEACH, PEGASIS, BFO, GA, DSR, PDORP, BS, ACO, WSN and nodes.
1. Introduction
A sensor network is an integrated circuit of sensor, embedded compute, modern network, wireless communication and distributed information process. Wireless sensor network is a new information acquiring and processing technology which yields by the recent
advances in miniaturization and low power design that led to the development of small-sized battery functioned sensors that are capable of detecting ambient conditions such as temperature and sound. Sensor networks are widely used in variety of applications such as civil as well as military applications because of its miniaturization in size, low cast and large lifetime. In order to keep the cost and size of these sensors small, they are equipped with small batteries that can store at most 1 Joule. A sensor in such a network can therefore communicate directly only with other sensors that are within a small distance. In order to communicate for a very long distance they must create an organization structure amongst these nodes.
Fig. 1. General Architecture of sensor network [2]
Since the fundamental advantage of wireless sensor networks is the ability to deploy them in an ad hoc manner, as it is not feasible to organize these nodes into groups pre-deployment. For this reason, there has been a large amount of research into ways of creating these organizational structures.[2]
WSNs is being energy aware by reducing the power consumption because of the power limitation. There are many possible solutions in order to reduce the power consumption of the wireless sensor nodes such as enhance the storage systems energy density, improve a technique to distribute the power among the nodes, and produce a mechanism to make the nodes scavenge their own power. The clustering algorithms play an important role in not just organizing the network but also control the performance of the network organization. There are several key limitations in wireless sensor networks, that clustering schemes must consider are Energy, Lifetime of Network , Application, Accuracy, Receiver Sensitivity, Type of transmitting signal, Distance ,response time, cluster stability, cluster overlapping, location awareness, QoS support and node mobility.
Cluster-based routing could be a answer to handle node heterogeneousness, and to limit the quantity of routing info that propagates within the network[3]. the concept behind clump is to cluster the network nodes into variety of overlapping clusters. clump makes potential a stratified routing during which ways area unit recorded between clusters rather than between nodes. This will increase the routes time period, therefore decreasing the quantity of routing management overhead. within the cluster, one node that coordinates the cluster activities is thought as a cluster head (CH). The set of cluster heads is thought as a dominant set. within the cluster, there also are normal nodes and have direct access solely to the current one cluster head, and gateways. Gateways area unit nodes which will hear 2 or additional cluster heads [4]. teams of the nodes area unit organized with relevancy their closeness to different nodes. 2 nodes area unit same to be neighbors of every different once each of them lie among their transmission vary and got wind of a bi-face link between them clump is a crucial approach to finding capability and measurability issues in mobile unintentional networks wherever no physical infrastructure is offered. The connected dominating set (CDS) could be a special cluster structure during which the cluster heads kind a connected network while not victimization gateways. A cluster head will the resource allocation to all or any the nodes happiness to its cluster. owing to the dynamic nature of the mobile nodes, their association and dissociation to and from clusters disrupt the soundness of the network,. and thus reconfiguration of cluster heads is unavoidable. This is an important issue since frequent cluster head changes adversely affect the performance of other protocols such as scheduling, routing and resource allocation that rely on it. The choice of the cluster heads is here based on the weight associated with each node: the bigger the weight of a node, the better that node is for the role of cluster head.[5]
Fig. 2. Transmission Range Zones [2]
2.LOW ENERGY ADAPTIVE
CLUSTERING HIERARCHY (LEACH)
LEACH is a cluster based protocol; it is randomly select a few sensor nodes as cluster heads (CHs) and rotate this role to evenly disseminate the energy load with the sensors in the network. The cluster head (CH) nodes compress data arriving from nodes that belong to the respective cluster, and send an aggregated packet to the base station in order to reduce the amount of information that must be transmitted to the base station. LEACH used a TDMA/CDMA MAC to reduce inter-cluster and intra cluster collisions.Fig. 3. Cluster based in Protocol of LEACH[6]
This protocol operates in two phases. These are set up phase and steady state phase. In setup phase, nodes form the cluster and actual data is transmitted in the steady state phase. Each node chooses a random number between 0 and 1 to become the CH. But sometimes problem can be occurred in the LEACH, 1) Rotate in the role of CHs, 2) Election based CHs. This type of problem can be decreases the energy at the every sensor nodes
3.POWER EFFICIENT GATHERING ON
SENSOR INFORMATION SYSTEM
(PEGASIS)
one in a chain to transmit to the base station (BS) instead of using multiple nodes. The essential objective of the protocol, in order to extend the network lifetime, nodes are need to communicate with their closest neighbors and they take turns in communicating with the base station. In PEGASIS routing protocol, all the sensor have global knowledge about the network and use a greedy approaches .if the sensor nodes can be failed or dies due to the low power, chain is constructed using the greedy approach by passing the failed sensor. PEGASIS can be reduces the power required to transmits the data per round and power draining is uniformly. PEGASIS achieves high energy efficiency since each node only communicates with its closest neighbors. The transmission power can be lowest required to reach its neighbors in the chain format. A disadvantage of PEGASIS having the significant delays .
4.
METHODOLOGY
In this section we discuss the network modeling and the proposed routing method PDORP, LEACH, ACO and GA in detail. We have created a network with randomly deployed nodes N. We have taken the area of 100 square meters. We have computed the distance d of all the nodes from their neighbors and we have compared their distance with the threshold th value of distance, so that they could be connected only when their distance is less than or equals to the threshold value. We have used this algorithm to make it sure that all the nodes are connected with a minimum distant value.
To find the optimal route in the large coverage set of nodes. If source node and destination nodes come under coverage set, then transmission will take place, otherwise again path searching will done.
If a node becomes more aggressive at the time of transfer and previously it was not in the cache memory, the other node is bound to receive a packet from it and in such a way it can cause damage to existing routes. A solution to this problem could be checking of any node at the time of receiving a data packet but this would cause unessential delay. Hence, the proposed solution creates a trustiest for the first time in each round on the basis of the parameters allocated to the nodes. After every round, the trust list is updated and after a certain number of rounds, the trust would not be checked to avoid time delays.
When a source node wants to transmit data to destination node, it calculate the distance from all the neighbors and forward the data to the node whose distance is less than or equals to the threshold distance and only in the direction of destination nodes and it also ensures that the minimum distance neighbor node should be in the direction of the destination node. After this process all the nodes in the direction of the destination are added into the trust list only in the first round of simulation. Whenever a new data
transmission is required, then the trust list will be updated in the first round of simulation and the data will be transferred via only those nodes which are found in the trust vector. As the vector list is created only in the starting phase of the simulation so to continue the transmission thereafter vector list is stored in the cache which is created It has been considered that each node occurs once in the trust list. To create the fitness value of trust, a hybrid algorithm, which consists of GA and ACO has been proposed via algorithm. GA would be optimizing the node consistency based on the Received and transmitted energy. ACO would be used for searching the shortest path.
ALGORITHM
Step 1: Create a Network creation with following 1. Network. height=100
2. Network. Width=100; N=Total_Nodes. 3. For each n՛ in N
counter = 1;
xloc(n՛ ) = 100 * Random.
yloc(n՛ ) = 100 * Random.
Node. name (n՛ ) = counter; counter = counter + 1; Endforeach
4. Cov_set = [ ]; //it would contain the limited area node. for i =1 to N
cov_count=2; for j=1: N
if (i! =j) // a node cannot compute distance to itself d = √ ((x (i) – x (j)) 2 + (y (i) – y (j)) 2
th = Rand(N);
If (d ≤ th) cov_set (i, 1) = i; cov_set (i, cov_count) =j; cov_count = cov_count + 1; end if end for end for
Above algorithm describes the node deployment in the whole network. In proposed network 100*100 network development takes place with coverage set = 1.
Step 2: Find the path
1. For i=1: Network.Simulation.Rounds 2. Source=Initialize. Source;
3. Source.Id=Node.name (source); Path= [ ]; Pathelement=2; Path [1] =Source;
4. Source.Packet.count=100;
5. Destination.Id=Node.name (Destination);
6. Current_cov_set_source=cov_set (source.Id,:)dest_found=0; possible_nodes=[ ];
7. While (dest_found! =1)
8. For each all n in current_cov_set
If(x(all n)>xloc(Source.Id) && (x(all n)-xloc(Destination.Id) < 0
Possible_nodes [possiblenoedcount] = all n; Possiblenodecount+=1;
9. Selection=possible node count*Random; 10. Selected_node=Possible_nodes [selection];
11. Possible_Nodes=[ ]; Path(Path element) = selected_Node
12. End
Step 3: Set the different energy.
Step 4: Apply the random election of normal and advance Node.
Step 5: Apply the counter to count the distance between nodes, clusters and Base station and apply distance formula to find the distance.
Step 6: Choose the multiple paths with energy
S(i).E=S(i).E- ( (tx_energy)*(4000) +
multipath*4000*(dist*dist*dist*dist ));
Step 7: Apply the ACO and GA for transmission of data from Base station to different nodes through BS.
Step8: Find the first dead, half dead and full dead nodes during transmission of data from BS to nodes and clusters. Step 9: Calculation of Energy dissipated based on distance if (distance>do)
S(i).E=S(i).E- ( (ETX+EDA)*(4000) +
Emp*4000*( distance*distance*distance*distance )); end
if (distance<=do)
S(i).E=S(i).E- ( (ETX+EDA)*(4000) +
Efs*4000*( distance * distance )); end
Step 10: Draw Varnoi diagram for network.
Step 11: Calculate BER, Delay, Energy consumption and Throughput.
5.Experimental Result
In this section the different problems are faced and all these problems are resolved with different Objectives. The Complied result snap shorts are given below:
Fig. 5. Initial Node Deployed on WSN with BS
The figure 5. displays the number of nodes deployed on the wireless sensor network. In this figure the number of nodes re connected with Base Station. Here are Active and Normal Nodes. The green line shows the sense from the base station.
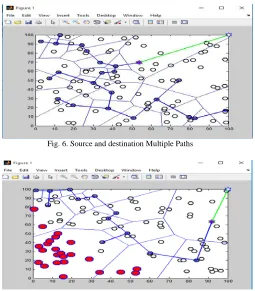
Fig. 6. Source and destination Multiple Paths
Fig. 7. Dead node and Data Transmission with Multiple Paths The figure 6 defines the Base station, Active Node, Normal Node, Chain leader and sources to destination multiple paths. In this figure green line senses the node from Base station and dark blue line tells the complete path from source to destination and delivers the message where the address found. Same the figure 7 defines the every thing like the figure 6, but it also displays the dead node when it is found to be stored in cache. The dead node displayed with red color in wireless sensor network.
Fig. 8. 100 Dead nodes after transmission
Bit Error Rate
Fig. 9. Bit Error Rate
The figure 9 defines the comparison of Bit Error rate of proposed work and the Existing work.
Formula
Bit Error Rate = (number of bit error)/ (total number of bit send)
Delay
Fig. 10. Delay
Same the figure 10 defines the Delay of existing and proposed work. Here the blue line in bar graph is the existing work and the red line is the proposed work. Formula
Delay= N/R
N is the number of bits, and
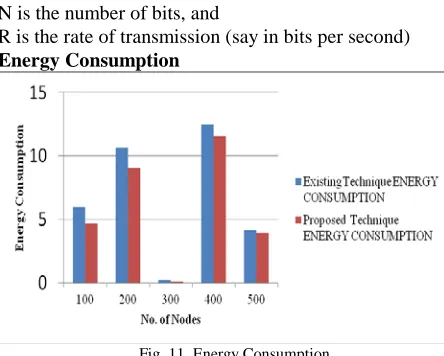
R is the rate of transmission (say in bits per second) Energy Consumption
Fig. 11. Energy Consumption
The figure 11 defines the comparison Energy consumption of proposed work and the Existing work. Here the blue line
in bar graph is the existing work and the red line is the proposed work.
Formula
Energy Consumption
ETx (k, d) = Eelec * k + Єamp *k * d2, d>1 ERx (k) = Eelec * k
Total consumed energy of each cluster = Σ ERx + Σ ETx = Total consumed energy of data receiving + total consumed energy of data transmitting
Throughput
Fig. 12. Throughput
The figure 12 defines the comparison Throughput of proposed work and the Existing work. Here the blue line in bar graph is the existing work and the red line is the proposed work.
Formula
Throughput = (Size of the packet / Transmission time) Table 1: Comparison Table BER, Delay, Energy Consumption,
Throughput
NO. OF NO DES
Existing Technique Proposed Technique
BE R
Del ay
Energy Consu mption
Thr oug hpu t
BER Del
ay
Energy Consu mption
Thro ughp ut
100 6.8 7
0.7 66
5.969 0.7 85
5.31 0.6 12
4.6668 0.979
200 19. 93
5.2 81
10.66 0.5 09
17.85 4.2 45
9.0258 0.820
300 25. 52
0.5 38
0.235 0.8 31
23.95 38
0.2 53
0.1474 1.056
400 20. 35
2.8 03
12.488 0.9 44
18.98 38
1.8 83
11.531 4
1.045
500 11. 59
0.4 2
4.128 0.4 52
10.22 33
0.2 23
3.9191 0.586
6.Conclusions
between the user and the clusters. In the existing work Power Efficient Gathering Sensor Information System (PEGASIS) and DSR routing protocols are used to transmit the data. In addition, PEGASIS LEACH and DSR is used for hybridization of Genetic Algorithm (GA) and Ant Colony Optimization (ACO) is applied to proposed routing protocol to identify energy efficient optimal paths. The performance analysis, comparison through a hybridization approach of the proposed routing protocol gives better result comprising less bit error rate, less delay, less energy consumption and better throughput which leads to better QoS and prolong the lifetime of the network. In the future this is extended with the help of different routing Protocols and CRC based Error detection and correction algorithms. In the future the proposed parameters are also improved with the help of another hybrid methods and algorithms.
References
[1]. Barani, S. and Visalakshi, S., (2017) “Super Cluster Head Selection and Energy Efficient Round Robin Load Balancing Technique in Wireless Sensor Networks” International Journal of Engineering Science and Computing, April 2017, pp. 10065- 10072 .
[2]. Xiang, W., Wang, N. and Zhou, Y., (2016) “An Energy-efficient Routing Algorithm for Software-defined Wireless Sensor Networks” IEEE-2016 IEEE Sensors Journal, 16(20), pp.7393-7400.
[3]. Brar, G.S., Rani, S., Chopra, V., Malhotra, R., Song, H. and Ahmed, S.H., (2016) “Energy Efficient Direction Based PDORP Routing Protocol for WSN” IEEE. Translations and content mining are permitted for academic research-2016, IEEE Access, 4, pp.3182-3194.
[4]. Mokdad, L., Ben-Othman, J. and Nguyen, A.T., (2015)
“DJAVAN: Detecting jamming attacks in Vehicle Ad hoc Networks ” Elsevier B.V. All rights reserved 2015, Performance Evaluation, 87, pp.47-59.
[5]. Singh, B. and Kumar, D., (2015) “Jamming attack in MANET: A Selected Review” International Journal of Advanced Research in Computer Science and Software Engineering , Volume 5, Issue 4, April 2015, pp.1264-1267.
[6]. Kazerooni, A.A., Jelodar, H. and Aramideh, J., (2015) “Leach And Heed Clustering Algorithms In Wireless Sensor Networks: A Qualitative Study”, Advances in Science and Technology Research Journal, Vol. 9, Issue 25, 2015.
[7]. Din, W.I.S.W., Yahya, S., Taib, M.N., Yassin, A.I.M. and Razali, R., (2014), “MAP: The New Clustering Algorithm based on Multitier Network Topology to Prolong the Lifetime of Wireless Sensor Network” 10th International Colloquium on Signal Processing & its Applications (CSPA2014), IEEE ,7 - 9 Mac. 2014, pp. 173-177.
[8]. Grover, A. and Jain, S., (2014), “AOMDV with Multi-Tier Multi-Hop Clustering in Wireless Sensor Networks” Advanced Engineering Technology and Application, Adv. Eng. Tec. Appl. 3, No. 3, pp. 29-33 .
[9]. Tripathi, A., Gupta, S. and Chourasiya, B., (2014),“ “Survey on Data Aggregation Techniques for Wireless Sensor Networks ” International Journal of Advanced Research in Computer and Communication Engineering Vol. 3, Issue 7, July2014, pp.7366-7371.
[10]. Dawood.M.S.., Kaniamudham, N., Thalaimalaichamy, M., and Athisha, G., (2012), “Study of Energy Efficient Clustering Algorithm for Wireless Sensor Networks” International Journal of Emerging Research in Management &Technology, pp. 30-36.
[11].Yuea, J., Zhang, W., Xiao, W., Tang, D. and Tang, J.,
(2012), "Energy efficient and balanced cluster -based data aggregation algorithm for wireless sensor networks." Procardia Engineering 29: 2009-2015.
[12].Tharini, C. and Ranjan, P.V., (2011), “An Energy Efficient Spatial Correlation Based Data Gathering Algorithm for Wireless Sensor Networks” International Journal of Distributed and Parallel Systems 2(3), pp. 16–24.
[13].Rahmani, N., Kousha, H., Darougaran, L. and Nematy, F.,
(2010), "CAT: The New Clustering Algorithm Based on Two-Tier Network Topology for Energy Balancing in Wireless Sensor Networks," in Computational Intelligence and Communication Networks(CICN), 2010 International Conference on, 2010, pp. 275-278.
[14]. Annoa, J., Barollib, L., Durresic, A., Xhafad, F., and Koyamae, A., (2008), “Performance evaluation of two fuzzy-based cluster head selection systems for wireless sensor networks”, Mobile Information Systems, 4, pp. 297– 312.
[15].Dehni, L., Krief, F. and Bennani, Y., (2006), "Power Control and Clustering in Wireless Sensor Networks," in Challenges in Ad Hoc Networking. vol. 197, 2006, pp.31-40.
[16]. Camilo, T., Carreto, C., Silva, J. and Boavida, F.,
(2006),”An energy-efficient ant-based routing algorithm for wireless sensor networks,” Ant colony optimization and swarm intelligence, pp.49-59.
![Fig. 1. General Architecture of sensor network [2] Since the fundamental advantage of wireless sensor](https://thumb-us.123doks.com/thumbv2/123dok_us/7871591.1305728/1.612.324.552.406.526/general-architecture-sensor-network-fundamental-advantage-wireless-sensor.webp)
![Fig. 2. Transmission Range Zones [2]](https://thumb-us.123doks.com/thumbv2/123dok_us/7871591.1305728/2.612.322.545.416.502/fig-transmission-range-zones.webp)