Procedia Computer Science 9 ( 2012 ) 1324 – 1333
1877-0509 © 2012 Published by Elsevier Ltd. doi: 10.1016/j.procs.2012.04.145
International Conference on Computational Science, ICCS 2012
Credit risk evaluation modeling using evolutionary linear SVM
classifiers and sliding window approach
Paulius Danenas, Gintautas Garsva
Department of Informatics, Kaunas Faculty, Vilnius University, Muitines St. 8, LT- 44280 Kaunas, Lithuania
Abstract
This paper presents a study on credit risk evaluation modeling using linear Support Vector Machines (SVM) classifiers, combined with evolutionary parameter selection using Genetic Algorithms and Particle Swarm Optimization, and sliding window approach. Discriminant analysis was applied for evaluation of financial instances and dynamic formation of bankruptcy classes. The possibilities of feature selection application were also researched by applying correlation-based feature subset evaluator. The research demonstrates a possibility to develop and apply an intelligent classifier based on original discriminant analysis method evaluation and shows that it might perform bankruptcy identification better than original model.
Keywords: Support Vector Machines, Particle Swarm Optimization, Genetic Algorithms, credit risk, evaluation, bankruptcy, analysis
1.Introduction
Credit risk assessment is one of the most important areas in financial domain as the choice between a decision to issue a loan and or to reject the application is a difficult and sophisticated task which involves deep analysis of various financial, social, demographic and other data provided of the customers and about the customer. The financial institutions might divide customers into different groups according to the available information yet effective tools that help to perform this classification task must be developed. Machine learning and artificial intelligence techniques are novel and state-of-the-art methods which can help to develop these tools. Their combination might help to minimize the drawbacks of separate techniques and thus develop models which might prove more accurate than common statistical techniques. This paper proposes a hybrid method based on linear Support Vector Machines classification and Particle Swarm Optimization. The proposed method is also tested in the combination of this method with discriminant analysis (or other similar techniques) might be useful while trying to improve the performance of these methods by identifying the most relevant financial attributes and developing a new classifier based on that particular technique.
2. Related work
Most part of the early research is based on discriminant analysis. The most widely known and used was
developed in 1968 by Altman et. al. [1]. Altman obtained 96% and 79% accuracy by using two different samples; his predictive reliability in two years has also been shown. Zmijewski [2] applied probit (simple probit and bivariate) and maximum likelihood principles to a set of 40 bankrupt and 800 non-bankrupt companies and a prediction sample of 41 bankrupt and 800 non-bankrupt companies collected from American and New York Stock Exchanges, resulting in 72% accuracy for complete dataset case. Springate [3] developed his model using step-wise multiple discriminate analysis to select 4 ratios which best describe a failing company. It obtained an accuracy rate of 92.5% using the 40 companies tested by Springate; later 83.3% and 88% accuracy rates were reported after testing it with other samples [4]. Ohlson used logit approach to construct his model [5], and he reported accuracy of 96.12%, 95.55% and 92.84% for prediction within one year, two years and one or two years respectively.
Support Vector Machines (SVM) has also been proved as an efficient tool to obtain results that can be compared to Neural Networks and other machine learning classification techniques. A detailed survey of recent research in this field is presented by Danenas and Garsva [6]. This metaresearch showed that application of genetic algorithms, as well as swarm intelligence based techniques (Ant Colony Optimization and Particle Swarm Optimization), to form hybrid methods can lead to better results than SVM with manually selected parameters. Several SVM based methods for credit risk related problems which use GA-based parameter selection have been proposed by Ahn et al. [7], Wu et al. [8], Zhang et al [9] and others; these papers report the benefit of GA optimization technique. Swarm intelligence has also been used to optimize SVM based classifiers Zhou et. al [10] proposed a novel hybrid Ant Colony Optimization (ACO) and rough sets approach for client classification, whereas Xuchuan et. al [11] applied Particle Swarm Optimization for efficient parameter selection for SVM and tested this method for personal credit scoring. Other popular approach for optimization of SVM-based model is fuzzy logic and fuzzy integral; while numerous examples of these techniques can be found in many papers several authors proposed hybrid techniques for credit risk evaluation Hao et. al used vague sets instead of fuzzy sets [12] whereas Huang et al proposed fuzzy least squares SVM [13]. Hao et. al proposed SVM with fuzzy hyperplane in [14] whereas Min et al propose principal component analysis integration which allows to reduce dimensionality and eliminate the autocorrelation of original samples space, thus improving classification accuracy [15].
The approach of combining discriminant analysis as an evaluation technique together with a classification technique has also been proposed. Merkevicius et. al. used discriminant analysis together with self organizing maps to construct a hybrid SOM-Altman model for bankruptcy prediction in order to find optimal weights for ratios of Altman model [16]. A model for forecasting changes comprising these two techniques together with a supervised neural network applied to increase performance in terms of accuracy has also been proposed [17]. Danenas and Garsva [18] have also applied SVM in combination with discriminant analysis for credit risk evaluation. Another paper of Danenas et. al describes a research of LIBLINEAR and SMO algorithms [19], achieving results similar to A comparative research of various SVM classifiers by these authors [19] proved that linear SVM classifiers can be a good alternative for credit risk evaluation model development in terms of both complexity and speed. Their results showed that linear SVM classifiers can be a good alternative to classical SVM approach as they offer good trade-off between faster training time and accuracy. This paper can be also viewed as an together with validation by real bankruptcy data
3.Research methodology
3.1.Support Vector Machines
Support Vector Machines is an efficient and effective solution for pattern recognition problem whereas a following quadratic optimization problem has to be solved:
minimize
(
,
)
2
1
)
(
1 1 1 j i j i i j j i i iy
y
K
W
x
x
subject to y i i C i i i 0, :0 1[ 1;1]
i
y
. is avector of l values where each component icorresponds to a training example (xi, yi). If training vectors xi are not linearly separable, they are mapped into a higher (maybe infinite) dimensional space by the kernel function ( , ) ( ) ( )Ti j i j
K x x x x
.
LIBLINEAR. LIBLINEAR is an open source library and a family of linear SVM classifiers for large-scale linear classification. It supports logistic regression and linear support vector machines and can be very efficient for training large-scale problems. Currently seven different linear SVM and logistic regression classifiers are implemented, four of them are used in the experiment. These classification methods do not use kernel functions for transformation into other space which makes it possible train a much larger set much faster. Following are the formulations of the algorithms that are used in this research, given by authors of LIBLINEAR in [21]:
L2-regularized L1-loss SVC is defined as a solver for the following primal problem:
l i i T i T w
w
w
C
y
w
x
1))
1
,
0
(max(
2
1
min
L2-regularized L2-loss SVC solves the following primal problem:
l i i T i T w w w C yw x 1 2 )) 1 , 0 (max( 2 1 min
which can also be expressed in dual form as
T TQ e 2 1 min subject to
0
iU
, i=1,..lwhere e is the vector of all ones, Q= Q + D, D is a diagonal matrix, and
Q
ijy
iy
jx
iTx
j For L1-loss SVC, U = C and Dii 0, i. For L2-loss SVC, U = and Dii 1/(2C), i.L2-regularized logistic regression solves the following unconstrained optimization problem::
l i x w y T w i T i
e
C
w
w
1)
1
log(
2
1
min
with its dual form expressed asl i i C i i i i i T
Q
C
C
C
C
1 : 0 :log
)
log(
)
(
log
2
1
min
subject to0
iC
, i=1,..l .L1-regularized L2-loss SVC solves the following primal problem ( 1 defines 1-norm):
l i i T i w w C yw x 1 2 1 (max(0,1 )) min
Genetic algorithm. It is the most widely used evolutionary computing technique applied to solve various optimization problems and find best solutions in the search space (referred as individuals or phenotypes as in origin biological process) by taking best individuals (referred as chromosomes) and forming new populations (genotype or a set of chromosomes) and performing evolution to obtain better solutions. The algorithm can be presented as follows:
1. Initialize GA by generating initial population of n chromosomes; 2. Apply genetic operations, such as crossover, mutation;
3. Evaluate each individual by its fitness;
4. Select k fittest individuals to form a new population;
The algorithm terminates after an optimal solution is found or the maximum number of iterations has been performed; in the latter case, an optimal or satisfactory solution is not found. Various strategies and types of GA have been created and applied, such as binary genetic algorithm (with all values encoded as binary strings), real-valued GA (using real numbers to encode values) as well as hybrid methods. Genetic algorithms can be easily implemented as a parallelized technique which makes it a good choice for large-scale problems.
Particle Swarm Optimization. The PSO algorithm was introduced by Kennedy and Eberhart. In PSO, a swarm of particles, which encode solutions to the problem of interest, move in an n-dimensional search space trying to find better solutions. Each of the particles has two associated properties, a current position and a velocity. Each particle has a memory of the best location in the search space that it has found so far (pbest), and knows the best location found to date by all the particles in the population (gbest). At each step of the algorithm, particles are displaced from their current position by applying a velocity vector to them. The magnitude and direction of their velocity at each step is influenced by their velocity in the previous iteration of the algorithm, simulating momentum, and the location of a particle relative to the location of its pbest and the gbest [20].
Discriminant analysis. This is one of the most popular techniques used in credit risk evaluation. It is used as an is used in this research; it was selected because of the origin of the data (which comes from USA and Canada companies). This technique allows to form two groups of values
Z= -4,336 4,513*( Net Revenue/Total Assets) + 5,679 * (Total Debt/Total Assets) + 0,004 * (Short Term Assets/ Short Terml Assets)
risky to bankruptcy). Note that ratios in original Zmijewski were not used in order to avoid linear dependence between variables.
3.2.GA-LinSVM and PSO-LinSVM algorithms
By combining evolutionary optimization techniques and linear SVM classifiers, two algorithms were developed, namely GA-LinSVM (classification technique based on genetic algorithm and linear SVM combination) and PSO-LinSVM (Particle Swarm Optimization and Linear SVM based classifier). These techniques are discussed below.
GA-LinSVM. This algorithm uses real-valued GA, although its chromosome contains integer values as well. The chromosome consists of 3 genes (further referred as G1, G2 and G3):
G1 integer value, that represents the algorithm used for classification:
0 L2-regularized logistic regression 1 L2-regularized L2-loss SVC 2 L1-regularized L2-loss SVC 3 L2-regularized L1-loss SVC G2 real value, cost parameter C
G3 real value, which represents bias term
The fitness function is defined as maximization of sum of TPR values: 1 ) ( C N i TPR fitness f ,
where NC is the number of classes. These evaluations are obtained by performing a k-fold cross-validation k=2 or k=3 might be a good choice). k=2 was chosen for te experiment. As the formula shows, the optimal solution can be obtained in case of ideal classification; as this happens very rarely, the main goal is to find satisfactory solution.
in GA-LinSVM case; the only difference is that particle dimension P1 representing G1 in GA-LinSVM is currently
represented as real value in PSO implementation, thus is integer part is selected for fitness value calculation.
3.3.Research methodology
This research applies modified method proposed in [18][19], but it also complements it with evolutionary classifiers described in Section 3.2.
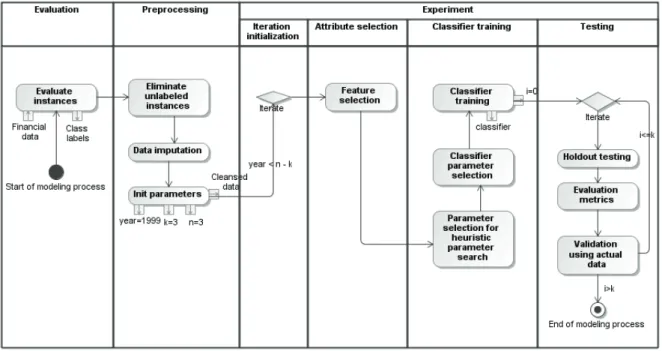
The modified algorithm is defined as follows:
1. Evaluate each financial entry by using discriminant analysis and compute bankruptcy classes.
2. Eliminate instances which could not be evaluated in Step 1 because of lack of data or division by zero and thus resulted in empty outputs.
3. Data imputation is performed by filling missing values with average value of particular attribute.
4. Perform the following steps for each m [1,n k], where n is the total number of periods, k is the number of periods are used for forecasting:
a. Apply feature selection procedure in order to select the most relevant attributes and reduce number of dataset dimensions
b. Perform classifier parameter selection using evolutionary techniques (particularly Genetic algorithm or Particle Swarm Optimization);
c. Train classifier using data from first m periods.
d. Apply hold-out testing using data from period p, p [m 1,m k];p .
Fig. 1. Workflow of method used in experiment
Figure 1 represents the algorithm graphically as a workflow. The output (for each iteration in experimental stage) is the trained classifier (list of support vectors in case of SVM) and the list of selected attributes.
3.4.Evaluation of results
Algorithms described in section 3.1 were used in this experiment to train models. The test results are evaluated by using accuracy together with TP (True Positive) and F-Measure rates. As most of the experiment is concluded for give their definitions in terms of binary
classification. Accuracy is defined as a proportion of correct predictions to total predictions as TN FN FP TP TN TP acc
True Positive rate (also referred as Recall rate) is computed as a ratio of true predictions and number of total positive instances:
FN TP
TP TPR
F-Measure can be defined as a better option for evaluation of classifier trained with unbalanced data than accuracy and is defined as harmonic mean of precision and recall:
recall prec recall prec F1 2* * 3.5.Computational results
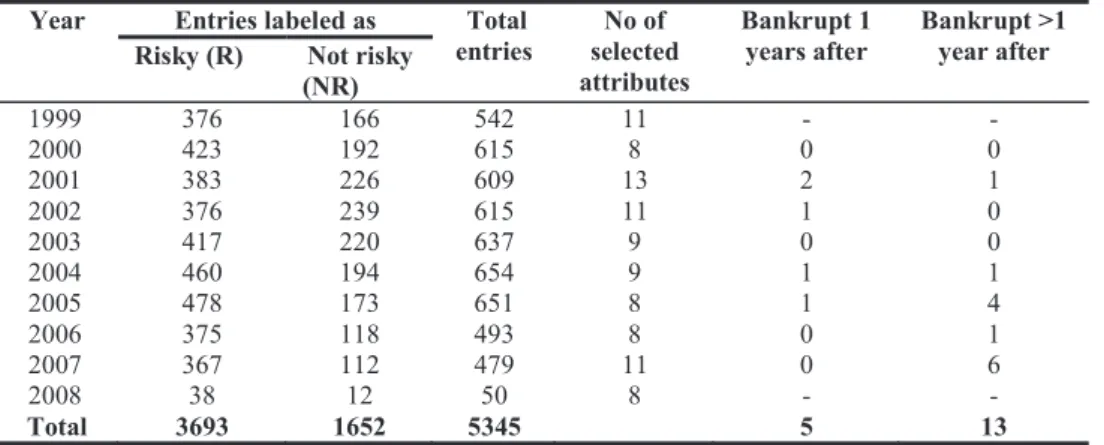
The algorithm described in Section 3.2 was applied on a dataset consisting of entries from 785 USA Transportation, Communications, Electric, Gas, And Sanitary Services companies with their 2005-2007 yearly financial records (balance and income statement) from financial EDGAR database. Each instance has 51 financial attributes (indices used in financial analysis). To test model performance, bankruptcy data from UCLA database was used to validate the results. UCLA LoPucki database [28] contains covers bankruptcy data; data from 2000 2010 period was applied for validation; instances which represent last entry in financial history were marked as Main characteristics of the datasets formed for the experiment are presented in Table 1.
Table 1. Main characteristics of datasets used in experiments
Year Entries labeled as Total
entries selected No of attributes
Bankrupt 1
years after Bankrupt >1 year after Risky (R) Not risky
(NR) 1999 376 166 542 11 - - 2000 423 192 615 8 0 0 2001 383 226 609 13 2 1 2002 376 239 615 11 1 0 2003 417 220 637 9 0 0 2004 460 194 654 9 1 1 2005 478 173 651 8 1 4 2006 375 118 493 8 0 1 2007 367 112 479 11 0 6 2008 38 12 50 8 - - Total 3693 1652 5345 5 13
To select the most important ratios feature selection was also applied for these datasets by using correlation-based feature subset selection [24] algorithm with tabu search for search in attribute subsets. This is not only for dimensionality reduction, but it also obtains statistically significant attributes which are then used to develop a new The code and algorithms for the experiments was implemented using Weka framework [24] with LIBLINEAR 1.7 by Lin et. al. JGAP (Java Genetic Algorithms Package) [26] version 3.6 and JSwarm 2.08 [27] frameworks were used to implement GA and PSO functionality. Crossover operation was used in Step 2 of GA (described in Section
3.1). The search space for both GA and PSO was set toC [0;50],bias [0;1], as well as the number of run iterations was set to 10. The crossover rate for GA was set to 0.7 (70% of the best offsprings were selected after each evaluation iteration to form a new population) and population size was set to 20. PSO was configured to run with 20 particles and inertia rate of 0.8. Minimum velocity for p2 was set to 3, for p3 was set to 0.2; maximum velocity for p2
was set to 3, for p3 it was set to 0.2.
Table 2 presents the results obtained by GA-LinSVM classifier classifier parameters, obtained by Genetic Algorithm, classification accuracy together with True Positive and F-Measure rates for each class. They are satisfiable, although they could be improved analysis of TP and F-Measure shows that some particular improvements, such as imbalanced learning or search space expansion (e.g., by allowing to choose a larger C or bias), might be applied in order to improve the performance. Notably, selection of much larger C results in slower classifier training.
Table 2 Results of GA-LinSVM
Training period 2000 2001 2002 2003 2004 2005 2006 2007 Linear classifier L2-RLR L2-RLR L2-RLR L2-RLR L2-RLR L2-RLR L2-RLR L2-RLR C 19,2112 36,7314 38,9040 45,2934 48,8366 37,7520 21,5133 9,6200 Bias 0,277 0,005 0,820 0,709 0,887 0,006 0,221 0,058 Accuracy 78,431 79,870 83,046 86,280 81,098 83,603 83,711 84,000 Y ear 1 TP NR R 0,956 0,496 0,957 0,550 0,564 0,971 0,976 0,595 0,946 0,446 0,487 0,947 0,470 0,954 0,974 0,417 F-Measure R 0,848 0,853 0,882 0,909 0,880 0,898 0,899 0,902 NR 0,631 0,680 0,697 0,720 0,560 0,589 0,582 0,556 Y ear 2 Accuracy 81,656 77,865 85,823 84,146 84,008 82,887 84,000 - TP R 0,976 0,947 0,978 0,979 0,949 0,946 0,974 - NR 0,567 0,459 0,574 0,469 0,496 0,462 0,417 - F-Measure R 0,867 0,849 0,907 0,900 0,900 0,893 0,902 - NR 0,706 0,589 0,707 0,615 0,599 0,565 0,556 - Y ear 3 Accuracy 78,336 82,165 83,537 88,664 83,505 82,000 - - TP R 0,971 0,959 0,981 0,984 0,951 0,947 - - NR 0,427 0,497 0,441 0,580 0,470 0,417 - - F-Measure R 0,854 0,883 0,897 0,929 0,897 0,889 - - NR 0,577 0,624 0,591 0,711 0,579 0,526 - -
The results show that, surprisingly, L2-regularized logistic regression (L2-RLR) was selected for almost all cases. The analysis shows that classification accuracy increased while providing the classifier with more data each year. However, in 2004 this accuracy slightly decreased although it was relatively stable (testing results of Year 1 show an increasing accuracy trend and testing results for next two years remain above 82%).
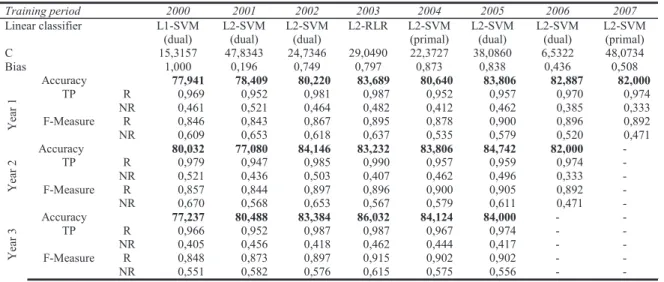
Table 3. Results of PSO-LinSVM
Training period 2000 2001 2002 2003 2004 2005 2006 2007 Linear classifier L1-SVM (dual) L2-SVM (dual) L2-SVM (dual) L2-RLR L2-SVM (primal) L2-SVM (dual) L2-SVM (dual) L2-SVM (primal) C 15,3157 47,8343 24,7346 29,0490 22,3727 38,0860 6,5322 48,0734 Bias 1,000 0,196 0,749 0,797 0,873 0,838 0,436 0,508 Accuracy 77,941 78,409 80,220 83,689 80,640 83,806 82,887 82,000 Ye ar 1 TP R 0,969 0,952 0,981 0,987 0,952 0,957 0,970 0,974 NR 0,461 0,521 0,464 0,482 0,412 0,462 0,385 0,333 F-Measure R 0,846 0,843 0,867 0,895 0,878 0,900 0,896 0,892 NR 0,609 0,653 0,618 0,637 0,535 0,579 0,520 0,471 Ye ar 2 Accuracy 80,032 77,080 84,146 83,232 83,806 84,742 82,000 - TP R 0,979 0,947 0,985 0,990 0,957 0,959 0,974 - NR 0,521 0,436 0,503 0,407 0,462 0,496 0,333 - F-Measure R 0,857 0,844 0,897 0,896 0,900 0,905 0,892 - NR 0,670 0,568 0,653 0,567 0,579 0,611 0,471 - Ye ar 3 Accuracy 77,237 80,488 83,384 86,032 84,124 84,000 - - TP R 0,966 0,952 0,987 0,987 0,967 0,974 - - NR 0,405 0,456 0,418 0,462 0,444 0,417 - - F-Measure R 0,848 0,873 0,897 0,915 0,902 0,902 - - NR 0,551 0,582 0,576 0,615 0,575 0,556 - -
Table 3 gives the results obtained by PSO-LinSVM classifier. The results were slightly worse than GA-LinSVM; however, the choice of classifiers by the algorithm was more diverse than in case of GA-LinSVM. This might mean that L2-RLR was the best choice for the classifier. Yet, few cases (in year 2004 and 2005) which obtained better results than in GA-LinSVM case contradict this fact. This proposes a conclusion that classification algorithm selection might still be improved.
Another interesting note is that Table 2 shows there were far more financial ratios considered relevant by feature selection procedure than the ones that were used in original evaluator. This proves that usage of higher dimensional data might result in improved results
Finally, to test model performance, an additional step was performed using real bankruptcy data. If applied dataset is in the period [pstart; pend], with year pend as the year of last entry in financial history, bankruptcy is known to be occured after the financial history, i.e., on year pend +1, pend +2,.. pend +k, with k as the maximum number of years during which the company is officially recognized as bankrupt. Thus the instance in financial history record
representing year pend Here it is
presumed that bankruptcy might have occurred following the year of the last entry of financial history for particular company, next year or even later (k years after). k = 3 is selected in this experiment; thus bankruptcy fact is evaluated here only if it happens during the next 3 years after the last entry in financial records of the company.
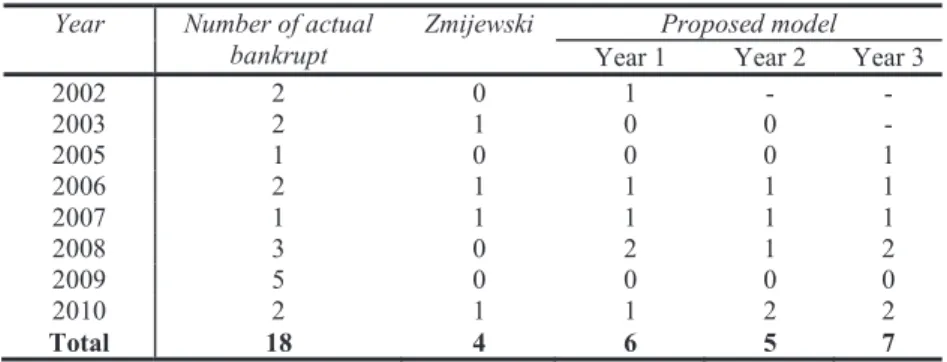
Table 4 represents bankruptcy identification results.
Table 4. Actual bankruptcy identification results
Year Number of actual
bankrupt Zmijewski Year 1 Proposed model Year 2 Year 3
2002 2 0 1 - - 2003 2 1 0 0 - 2005 1 0 0 0 1 2006 2 1 1 1 1 2007 1 1 1 1 1 2008 3 0 2 1 2 2009 5 0 0 0 0 2010 2 1 1 2 2 Total 18 4 6 5 7
Overall, the model developed by the proposed method identified more bankruptcy facts than original Zmijewski model which was used as the evaluator. The results varied for each year; however, only very few instances were used to forecast actual bankruptcies thus this should be tested with more actual bankruptcy facts.
4.Current limitations and future work
Although experimental results seem promising, yet there are several important factors which might improve the performance. The performance of SVM classifiers much depends on the selected parameters; yet, linear SVM has a smaller number of them which makes it simpler. However, the selection procedure might still be improved by selecting different GA recombination procedures or their combinations (mutation and crossover). PSO neighborhood and topology has not been explored in this research, thus it also leaves room for improvement. Another aspect that should be taken in mind while applying the selected procedure is, as already mentioned before, imbalanced learning procedure, especially as classes are computed dynamically by external evaluator. SVM is one asses tend to outweigh Many techniques are applied to overcome this barrier such as internally implemented class-weighting, cost-sensitive learning and evaluation, internal classifier enhancements, numerical sampling techniques, such as bootstrap, undersampling, oversampling. Dataset balancing is crucially important in identification of bankrupt companies if they are represented by minority entries, as identification of bankrupt company might cost more to the creditor than the misidentification of it.
5.Conclusions
An approach for credit risk evaluation using linear SVM classifiers, optimized by evolutionary techniques, such as Genetic Algorithm and Particle Swarm Optimization, combined with sliding window testing is presented in this article. A feature selection algorithm based on correlation-based feature subset selection was also applied in order to reduce the dimensionality of the dataset thus leaving only the most relevant ratios. The classifier used here is based on LIBLINEAR classifier which offers several linear algorithms perfectly suitable for large scale learning. The developed classifiers were applied for real-world dataset, together with widely applied discriminant Zmijewski technique as a basis for output formation. This approach could serve as a alternative tool for company classification in case when there are no actual bankruptcy classes as well as if obtaining them might be a too complicated or expensive, and the classifiers were rerun on datasets based on the same principle as described above. Model validation was performed on real bankruptcy list; the obtained results showed that it performed better than original Zmijewski model.
References
1. Altman, E.: Financial ratios, discriminant analysis and the prediction of corporate bankruptcy. The Journal of Finance, Vol. 23 (4), pp.589 -609. American Finance Association; Blackwell Publishing (1968)
2. Zmijewski, M.: Methodological Issues Related to the Estimation of Financial Distress Prediction Models. Journal of Accounting Research,
22, pp.59 82. The Institute of Professional Accounting, Graduate School of Business, University of Chicago (1984)
3. Springate, G. L.V.: Predicting the Possibility of Failure in a Canadian Firm. Unpublished M.B.A. Research Project, Simon Fraser University (1978).
4. Sands, E. G., Springate, G. L.V., VAR, V.: "Predicting Business Failures". CGA Magazine (May 1983): pp. 24-27 (1983)
5. Ohlson, J. A.: Financial Ratios and the Probabilistic Prediction of Bankruptcy. Journal of Accounting Research, 18(1), 109. The Institute of Professional Accounting, Graduate School of Business, University of Chicago (1980).
6. Danenas P., Garsva G. Support Vector Machines and their Application In Credit Risk Evaluation Process. Transformations in Business & Economics, Vol. 8, No. 3 (18), pp. 46-58 (2009)
7. Ahn, H., Lee, K., & Kim, K.: Global Optimization of Support Vector Machines Using Genetic Algorithms for Bankruptcy. Lecture Notes in Computer Science, vol 4234(5), pp. 420-429. Springer. (2006)
8. Wu, C., Tzeng, G., Goo, Y., Fang, W.: A real-valued genetic algorithm to optimize the parameters of support vector machine for predicting bankruptcy. Expert Systems with Applications. Vol. 32, pp. 397-408 (2007).
9. Zhang, D., Chen, Q., Wei, L.: Building Behavior Scoring Model Using Genetic Algorithm and Support Vector Machines. Lecture Notes in Computer Science. Vol. 4488, pp. 482-485 (2007).
10. Zhou J., Zhang A., Bai T.: Client Classification on Credit Risk Using Rough Set Theory and ACO-Based Support Vector Machine. In: Wireless Communications, Networking and Mobile Computing, 2008 (WiCOM '08), 4th International Conference, pp.1-4 (2008)
11. Xuchuan, J.M.Y.: Construction and Application of PSO-SVM Model for Personal Credit Scoring. Chinese Journal of Management, Vol. 4, pp. 158-161 (2008).
12. Hao, Y., Chi, Z., Yan, D.: Fuzzy Support Vector Machine Based on Vague Sets for Credit Assessment. Fuzzy Systems and Knowledge Discovery, 2007. (2007).
13. Huang, W., Lai, K. K., Yu, L., Wang, S. A.: Least Squares Bilateral-Weighted Fuzzy SVM Method to Evaluate Credit Risk. 2008 Fourth International Conference on Natural Computation, Vol. 7, pp. 13-17. (2008).
14. Hao, P.-Y., Lin, M.-S., Tsai, L.-B.: A New Support Vector Machine with Fuzzy Hyper-Plane and Its Application to Evaluate Credit Risk. 2008 Eighth International Conference on Intelligent Systems Design and Applications, pp. 83-88 (2008).
15. Min, Z.: Credit Risk Assessment Based on Fuzzy SVM and Principal Component Analysis. Proceedings of 2009 International Conference on Web Information Systems and Mining, pp. 125-127 (2009).
16. Merkevicius, E., Garsva, G., Simutis, R., "Neuro-discriminate Model for the Forecasting of Changes of Companies Financial Standings on the Basis of Self-organizing Maps"; Lecture Notes In Computer Science, Vol. 4488, Berlin, Heidelberg: Springer-Verlag, pp. 439-446 (2007)
17. Merkevicius, E., Garsva, G., Girdzijauskas, S., "A hybrid SOM-Altman model for bankruptcy prediction"; Lecture Notes in Computer Science, Vol. 3994, Berlin, Heidelberg: Springer-Verlag, pp. 364-371 (2006).
Springer, Vol. 57, Part 1, 2010, pp. 7-12 (2010).
19. Danenas P., Garsva G., Gudas S. Credit Risk Evaluation Model Development Using Support Vector Based Classifiers. Proceedings of the International Conference on Computational Science (ICCS 2011), Procedia Computer Science, Vol. 4, pp. 1699-1707 (2011)
20. financial modelling. Springer-Verlag New York Inc (2006).
21. R. Fan, K. Chang, K., Hsieh, C., Wang, X., Lin, C., LIBLINEAR: A library for large linear classification, The Journal of Machine Learning Research(2008), Vol. 9, pp.1871 4.
22. Vapnik, V. The Nature of Statistical Learning Theory. Springer-Verlag (2000)
23. Engelbrecht, A. Computational intelligence: an introduction, 2nd ed., Wiley & Sons Inc. (2007)
24. Hall, M.A. Correlation-based Feature Subset Selection for Machine Learning. Hamilton, New Zealand (1998) 25. Weka 3: Data Mining Software in Java, http://www.cs.waikato.ac.nz/ml/weka/
26. JGAP: Java Genetic Algorithms Package, http://jgap.sourceforge.net/ 27. JSwarm-PSO: Swarm optimization package, http://jswarm-pso.sourceforge.net/ 28. UCLA-LoPucki Bankruptcy Research Database, http://lopucki.law.ucla.edu/index.htm