Article
Land cover changes in open-cast mining complexes
based on high-resolution remote sensing data
Filipe Silveira Nascimento1,2, Markus Gastauer2, Pedro Walfir M. Souza-Filhob,c*, Wilson R. Nascimento Jr.b, Diogo C. Santosb, Marlene F. Costad
1 Vale S.A. Mina de Águas Claras (MAC), Nova Lima, Minas Gerais, Brazil; [email protected]
2 Instituto Tecnológico Vale. Belém, Pará, Brazil; [email protected], [email protected],
[email protected], [email protected]
3 Geosciences Institute, Universidade Federal do Pará. Belém, Pará, Brazil; [email protected]
4 Vale S.A. Gerência de Meio Ambiente – Minas de Carajás, Departamento de Ferrosos Norte, Parauapebas,
Pará, Brazil; [email protected]
* Correspondence: [email protected]; Tel.: +55-91-3213-5563 (P.W.M.S.F.)
Abstract: Remote sensing technologies may play a fundamental role in the environmental assessment of open-cast mining and the accurate quantification of mine land rehabilitation efforts. Here, we developed a systematic geographic object-based image analysis (GEOBIA) approach to map the amount of revegetated area and to quantify the land-use changes in open-cast mines in the Carajás region situated in the eastern Amazon. Based on high-resolution satellite images from 2011 to 2015 from different sensors (GeoEye, WorldView-3 and Ikonos), we quantified forests, cangas (natural metalliferous savanna ecosystems), mine land, revegetated areas and water bodies. Based on the GEOBIA approach, threshold values were established to discriminate land cover classes using spectral bands, and the NDVI and NDWI indices and LiDAR digital ground and slope models. The overall accuracy was higher than 90%, and the Kappa indices varied between 0.82 and 0.88. During the observation period, the mining complex expanded; for that, canga and forest vegetation was converted to mine land. At the same time, the amount of revegetated area increased. Thus, we conclude that our approach is capable of providing consistent information regarding land cover changes in mines, with a special focus on the amount of revegetation necessary to fulfill environmental liabilities.
Keywords: GEOBIA; canga ecosystem; Carajás National Forest; mine land revegetation; satellite images; environmental assessment
1. Introduction
The societal and environmental impacts of mining activities have become a greater focus of public interest [1]. On the one hand, societies expect the production of cheap raw materials to drive the economy. On the other hand, the exploitation of mineral reserves should be embedded in efficient, responsible management plans that have a strong focus on the development of neighboring communities and sustainable land use. This balancing act has led to the emergence of environmental regulations in many countries, including Brazil [2], and to a series of self-commitments by the mining industry [3,4].
The transformation of natural ecosystems during open-cast mining reduces the amount of wildlife habitat and endangers populations of rare, endemic or threatened species [5,6]. To reduce these environmental changes, the mitigation hierarchy offers a useful form of guidance [7,8]. According to this framework, measures should be taken to avoid and minimize any potential impacts before an enterprise starts. Then, opportunities to remediate, i.e., reverse the residual impacts, are considered before offsets are outlined to address any unavoidable impacts [9]. The four pillars of the mitigation hierarchy process increase environmental sustainability by avoiding net losses or generating positive impacts [10,11] as well as by increasing social acceptance of mining [12].
Remediation includes the revegetation, i.e., greening, and the progressive environmental rehabilitation of degraded, damaged or destroyed mine lands to achieve pre-mining levels of biodiversity, ecosystem structure and ecosystem functioning [2]. Such mine land rehabilitation remains challenging, especially in tropical ecosystems, as issues related to species selection, biological invasions, and monitoring the effectiveness of rehabilitation activities are not fully resolved [13]. Uncertain rehabilitation trajectories or unclear outcomes of rehabilitation activities [14] necessitate constant monitoring to effectively regulate mining [15]. In addition to information about the status of environmental rehabilitation derived from ground data (e.g., Gastauer et al., in press), such monitoring requires the accurate quantification of the temporal and spatial extents of revegetation and rehabilitation sites within the mines [16].
An increasing demand for the accurate and timely information describing the nature and extent of land use and land cover changes in and around open-cast mines over time highlights the importance of remote sensing methods that can provide accurate tools to track these changes over time [17–21]. Remote sensing covers large areas, has high temporal frequency and has lower costs than those of ground-based investigations. Thus, remote sensing may play a fundamental role in the environmental monitoring of rehabilitation activities in mining areas [1,22], given that geographic information systems, satellite images and digital classification systems for the automated detection of changes in land use and cover changes are available [23–25]. Specifically, the automated analysis of time series, as proposed by the LandTrendr approach [26], enables the successful tracking of the revegetation dynamics within mines based on vegetation indices [27]. But as these vegetation indices by themselves are unable to discriminate between natural vegetation and revegetated areas, the separation between classes is based only on historic evidence. Furthermore, the LandTrendr approach is restricted to Landsat imagery with a low spatial resolution (30×30 m), which is unable to adequately map revegetation activities on strait benches. Hence, we adopt a geographic object-based image analysis (GEOBIA) approach to detect small-scale logging and revegetation activities in open-cast mines from available high-spatial resolution image datasets.
The objective of this study was to provide a methodology to track land cover changes in mines, including the spatial and temporal dynamics of revegetated and rehabilitating mine lands, with a special focus on the recognition of small revegetated areas such as strait benches. To do so, we quantified the amount of natural vegetation converted to mining areas as well as the amount of mine land revegetated between 2011 and 2015 in the largest iron ore open-cast mining complex of the world, which is situated in the Carajás National Forest (CNF), in eastern Amazon, Brazil.
2. Materials and Methods
2.1. Study site
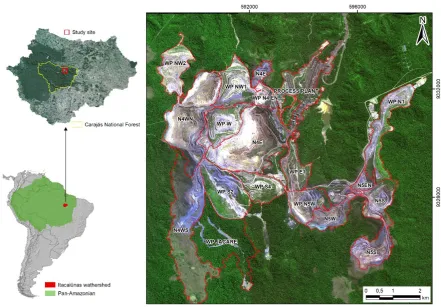
This study comprises the iron ore open cast mines from the N4-N5 complex situated in the CNF in the watershed of the Itacaiunas River, eastern Amazon (Figure 1). The study area has a mean temperature of approximately 25°C and an annual precipitation between 1900 and 2000 mm [28]. The climate of the region is tropical warm, with rainy summers and dry, hot winters. The CNF is a protected area dominated by dense and open evergreen forests as well as by semi-deciduous sub-montane and sub-montane forest formations that cover the hillsides and lower portions of the landscape. In two mountain ridges within the CNF, Serra Sul and Serra Norte, patches of banded iron formations outcrop on mountain tops. These patches are covered by a hyperdiverse, endemic savanna vegetation [29,30], locally called canga.
These cangas cover the largest iron ore reserves in the world [31]. Thus, mining for iron ore is a
major business in the region; since the 1980s, the world’s largest iron ore mining complex, which spans canga patches N4 and N5 (N4-N5 complex) from the Serra Norte, has been in operation, extracting 120 Mt of iron ore annually [32].
Furthermore, benches from permanent structures, such as waste piles, are subjected to permanent environmental rehabilitation, which aims to recover biodiversity and ecosystem functions to pre-mining levels to reduce the overall impact of pre-mining enterprises on natural resources [13]. In both cases, similar species mixtures of native and fast-growing, non-native species are applied together with organic and inorganic fertilizers and fixing material via hydroseeding after bench preparation using biotextiles and/or manual trench digging. The species mixtures used for temporary revegetation in mining pits do not contain tree species, as trees may destabilize the landscape by falling; however, the establishment of trees or shrubs from forest and canga ecosystems is implemented during the environmental rehabilitation of waste pile benches.
Figure 1. Location map of the N4-N5 mining complex indicating mine pits (N) and waste piles (WP) in relation to the Itacaiunas River watershed, southeastern Amazon, Brazil, South America. WorldView- 3 satellite image in color-composite 1R2G3B acquired in 2015.
2.2. Remotesensing data sources
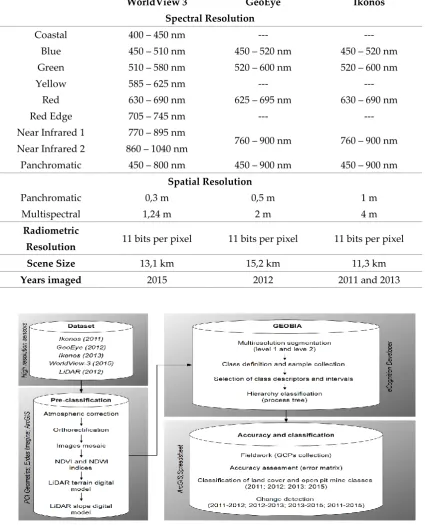
Due to restricted image availability (e.g., cloud cover), high-resolution images from three different sensors (2011, 2013 Ikonos, 2012 GeoEye and 2015 WorldView-3) were acquired. Table 1 provides detailed information about this remote sensing dataset. All images date from August of each year (i.e., the dry season) to minimize the spectral differences in vegetation cover as a function of seasonality along the analyzed time-series. The spatial resolution differed among the images, i.e., 3×3 m for Ikonos and 2×2 m for GeoEye and WorldView-3, but no resampling to the same spatial scale was carried out so as to map the land cover as accurately as possible.
For the landscape evaluation, multispectral bands (red, blue, green and infrared) with 32-bit were radiometrically calibrated to ground reflectance. Additionally, a digital terrain model was used to map the vegetation and land-use classes in the N4-N5 mining complex. This model resulted from a light detection and range sensor (LiDAR) from June 2012, with six elevation points per square meter. Based on the digital terrain model, a digital slope model was developed using geoprocessing tools from ArcGIS 10.3 software (ESRI).
Table 1. General characteristics of WorldView-3, GeoEye and Ikonos images used in this study.
WorldView 3 GeoEye Ikonos
Spectral Resolution
Coastal 400 – 450 nm --- ---
Blue 450 – 510 nm 450 – 520 nm 450 – 520 nm
Green 510 – 580 nm 520 – 600 nm 520 – 600 nm
Yellow 585 – 625 nm --- ---
Red 630 – 690 nm 625 – 695 nm 630 – 690 nm
Red Edge 705 – 745 nm --- ---
Near Infrared 1 770 – 895 nm
760 – 900 nm 760 – 900 nm Near Infrared 2 860 – 1040 nm
Panchromatic 450 – 800 nm 450 – 900 nm 450 – 900 nm
Spatial Resolution
Panchromatic 0,3 m 0,5 m 1 m
Multispectral 1,24 m 2 m 4 m
Radiometric
Resolution 11 bits per pixel 11 bits per pixel 11 bits per pixel
Scene Size 13,1 km 15,2 km 11,3 km
Years imaged 2015 2012 2011 and 2013
Figure 2. Flowchart including the main steps of digital image processing and geographic object-based image analysis (GEOBIA).
2.3. Atmospheric corrections and orthorectification
[34] using the digital terrain model as the basis for the coordinates (latitude, longitude) and altitude. In the next step, different images were mosaicked to cover the complete study site for each year.
2.4. Elaboration of remote sensing indices
In addition to the original multispectral bands of the orbital sensors (B1 – red, B2 – green, B3 –
blue, B4 – infrared) and the LiDAR digital terrain model band used for image interpretation, we computed the normalized difference vegetation index (NDVI) and normalized difference water index (NDWI) [35,36] (Figure 2). The NDVI highlights the presence of vegetation and water in the image and has been used in different studies regarding agricultural, forest and climatic crops [37]. For both indices, higher values indicate the presence of more photosynthetically active vegetation [36].
2.5. GEOBIA: image segmentation, multilayer calibration and classification
Segmentation is the division of a scene into homogeneous parts to extract image objects [38]. The segmentation of the Carajás open-cast mine scenes was carried out in two steps using eCognition software (Trimble, Munchen, Germany). First, the macro-segmentation aimed to segregate large features of the image using a less refined segmentation (scale: 100, compactness: 0.5, and form: 0.1, using weight 1 for all 8 bands). In the second step, a more refined micro-segmentation was performed (scale: 30, compactness: 0.5, and form: 0.1, using weight 25 for the NDVI band, 15 for the infrared band, and 1 for the other bands) (Figure 2).
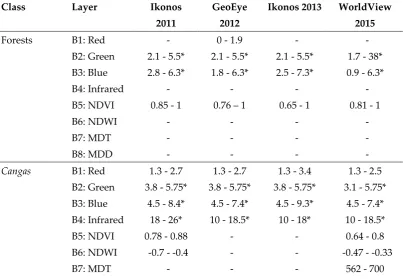
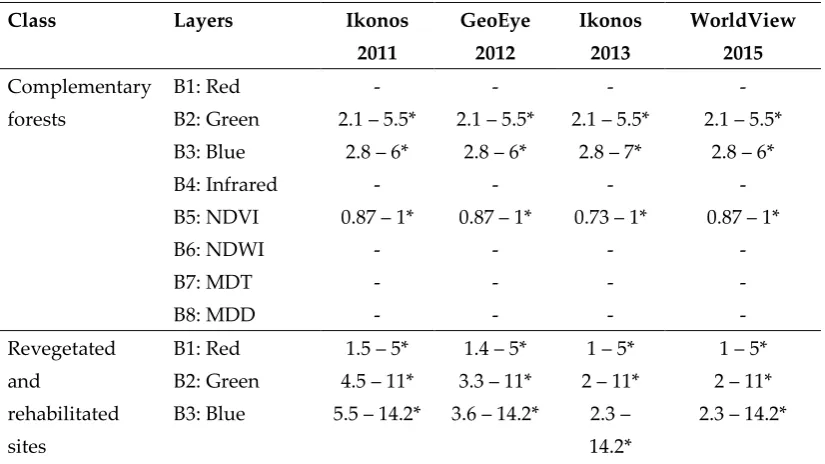
To calibrate the threshold values for the classification of segments, 35 ground-control points were used for each class. This procedure was separately carried out for each segmentation step and resulted in the definition of threshold values shown in Tables 2 and 3. Based on these threshold layer values, macro-segments were classified into forests, cangas, mining areas and water bodies using the threshold values shown in Table 2. The classification of micro-segments in the mining area class enable the differentiation between revegetated and non-revegetated mining areas (Table 3). This refinement was necessary to identify revegetated or rehabilitated areas within mines and to separate them from misclassified forests.
Table 2. Layers, functions and thresholds used to classify macro-segments in the classes of forests,
cangas, mining areas and water bodies.
Class Layer Ikonos
2011
GeoEye 2012
Ikonos 2013 WorldView 2015
Forests B1: Red - 0 - 1.9 - -
B2: Green 2.1 - 5.5* 2.1 - 5.5* 2.1 - 5.5* 1.7 - 38* B3: Blue 2.8 - 6.3* 1.8 - 6.3* 2.5 - 7.3* 0.9 - 6.3*
B4: Infrared - - - -
B5: NDVI 0.85 - 1 0.76 – 1 0.65 - 1 0.81 - 1
B6: NDWI - - - -
B7: MDT - - - -
B8: MDD - - - -
Cangas B1: Red 1.3 - 2.7 1.3 - 2.7 1.3 - 3.4 1.3 - 2.5 B2: Green 3.8 - 5.75* 3.8 - 5.75* 3.8 - 5.75* 3.1 - 5.75*
B3: Blue 4.5 - 8.4* 4.5 - 7.4* 4.5 - 9.3* 4.5 - 7.4* B4: Infrared 18 - 26* 10 - 18.5* 10 - 18* 10 - 18.5*
B5: NDVI 0.78 - 0.88 - - 0.64 - 0.8 B6: NDWI -0.7 - -0.4 - - -0.47 - -0.33
B8: MDD 0 - 17.5* 0 - 17.1* 0 - 17.5* 0 - 23* Complement cangas (threshold condition: objects adjoining canga edges)
B1: Red 0.85 - 3.3* 0.85 - 3.3* 0.85 - 3.6* 0.85 - 3.3*
B2: Green 3 - 6.5* 3 - 6.5* 3 - 6.5* 3 - 6.5* B3: Blue 3.1 - 9.6* 3.1 - 9.6* 3.1 - 9.9* 3.1 - 9.6*
B4: Infrared - - - -
B5: NDVI 0.74 - 0.94 0.72 - 0.94 0.57 - 0.94 0.67 - 0.94
B6: NDWI - - - -
B7: MDT - 0 – 700 0 - 700 0 - 722
B8: MDD - - - -
Mining areas B1: Red 0.27 - 7.7* 0.27 - 9.6* 0.27 - 10* 0.27 - 9.6* B2: Green 1.6 - 13.5* 1.6 - 14.6* 1.6 - 17* 1.6 - 14.6*
B3: Blue 6 - 25 4.3 – 47 4.3 - 47 3.5 - 47
B4: Infrared - - - -
B5: NDVI - - - -
B6: NDWI -9.5 - 0.35* -9.5 - 0.35* -9.5 - 0.35* -9.5 - 0.35*
B7: MDT - - - -
B8: MDD - - - -
Water bodies B1: Red - - - -
B2: Green - - - -
B3: Blue - - - -
B4: Infrared - - - -
B5: NDVI - - - -
B6: NDWI 0.1 - 1* 0.1 - 1* 0.1 - 1* 0.1 - 1*
B7: MDT - - - -
B8: MDD - - - -
* indicates open intervals; otherwise, intervals are closed.
Table 3. Layers, functions and thresholds used to classify micro-segments from mining areas in the
classes of forests, revegetated sites and rehabilitated sites.
Class Layers Ikonos
2011 GeoEye 2012 Ikonos 2013 WorldView 2015 Complementary forests
B1: Red - - - -
B2: Green 2.1 – 5.5* 2.1 – 5.5* 2.1 – 5.5* 2.1 – 5.5* B3: Blue 2.8 – 6* 2.8 – 6* 2.8 – 7* 2.8 – 6*
B4: Infrared - - - -
B5: NDVI 0.87 – 1* 0.87 – 1* 0.73 – 1* 0.87 – 1*
B6: NDWI - - - -
B7: MDT - - - -
B8: MDD - - - -
Revegetated and
rehabilitated sites
B1: Red 1.5 – 5* 1.4 – 5* 1 – 5* 1 – 5* B2: Green 4.5 – 11* 3.3 – 11* 2 – 11* 2 – 11*
B3: Blue 5.5 – 14.2* 3.6 – 14.2* 2.3 –
14.2*
B4: Infrared - - - -
B5: NDVI 0.7 – 0.9 0.65 – 0.92 0.56 –
0.92
0.6 – 0.92
B6: NDWI -1 - -0.3* - - -1 - -0.3*
B7: MDT - - - -
B8: MDD - - - -
Complementary forests 2
B1: Red - - - -
B2: Green - - - -
B3: Blue - - - -
B4: Infrared - - - -
B5: NDVI 0.78 – 1 0.78 – 1 0.78 – 1 0.78 – 1
B6: NDWI - - - -
B7: MDT - - - -
B8: MDD - - - -
* indicates open intervals; otherwise, intervals are closed.
2.6. Detection of land cover and open-cast mine changes
In the next step, the polygons were vectorized to calculate the areas of the different classes for each year. To do so, the classifications obtained for each year were exported as shapefiles (.shp) and loaded into the ArcGIS 10.3 software (ESRI) before the area (in hectares) was calculated using the geometry calculation function present in the layer attributes table. For the analysis of temporal changes, a conceptual tree of the possible typologies and their transitions was elaborated (Figure 3). Changes between classes during the observation period were detected by comparison among polygons from maps of different dates. Each map was compared to its previous map by subtraction to generate a new thematic map resulting from this differentiation and a table of changes between classes [39]. The ‘dissolve’ geoprocessing function was used for each date of the scene and used to unify polygons from each layer by class. Then, the polygons were compared between subsequent
dates using the ‘Intersect’ tool in ArcGIS to produce maps that indicated the land use changes from
2011 to 2012, 2012 to 2013, 2013 to 2015, and 2011 to 2015 (Figure 2).
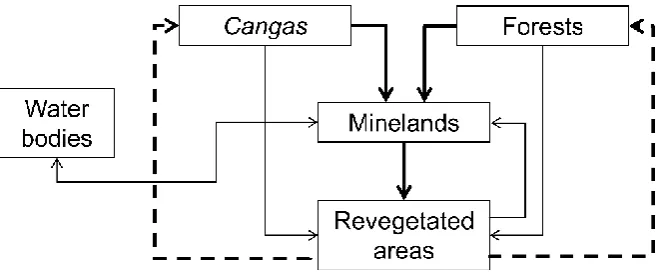
Figure 3. Land-use classes detected in the N4-N5 mining complex and possible transitions among them.
2.7. Accuracy assessment
and land cover to generate a confusion matrix (Table S1). The actual vegetation was evaluated by manual image analysis by two independent reviewers who were familiar with the scene. Then, the relation of omission and commission errors, the producer and the user accuracy, the Kappa index per class, the overall kappa index and the overall accuracy were computed as described in [40].
3. Results
3.1. High-resolution satellite image accuracy assessment
Figure 4. Kappa index (a), user accuracy (b) and producer accuracy (c) per class for the 2011, 2012, 2013, and 2015 images in the N4-N5 Carajás mining complex. F is forest, C is canga, W is water, M is mine and R is revegetated area.
3.2. Analysis of the spatial-temporal distribution of land cover and land use classes
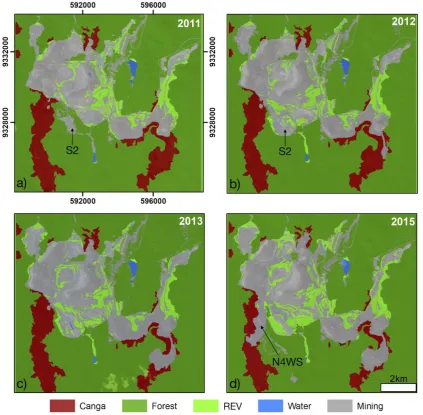
Figure 5. Classified high-resolution 2011 Ikonos, 2012 GeoEye, 2013 Ikonos and 2015 WorldView-3 images illustrating the temporal and spatial changes in forest, canga, open-cast mine and revegetated (REV) land cover classes.
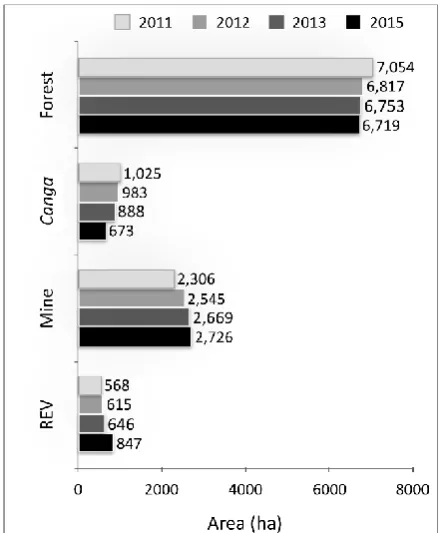
Figure 6. Land use classes in the N4-N5 Carajás mining complex between 2011 and 2015. REV indicates revegetated areas.
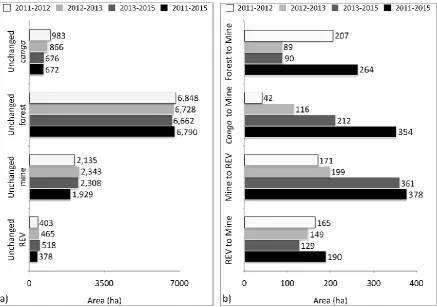
From 2011 to 2012, unchanged canga occupied an area of 983 ha, while unchanged mine and revegetation area occupied 2,135 ha and 403 ha, respectively (Figure 7a). During this period, the largest conversion of forest to mining area observed (207 ha) occurred due to the logging of the S2 waste pile area (Figure 7b). At the same time, the area of canga converted to mine area was lower than that in the following periods (42 ha). Furthermore, 171 ha of mine land was revegetated; however, 165 ha of this revegetated area was reconverted to mine land (Figure 7b).
In the subsequent observation period (2012 to 2013), the areas of unchanged mine and revegetated land increased by 10% and 15%, respectively (Figure 7b). The conversion of land from forest to mine was reduced by more than 50%, while 116 ha of canga was converted to mining area, i.e., an increase larger than 100% compared to the previous period (2011 to 2012). Although 199 ha of mine land was revegetated between 2012 and 2013, the amount of revegetated area increased only marginally, because 149 ha of revegetated area was reconverted to mine land (Figure 7b).
Figure 7. Conversion (in ha) of major land cover and land use classes between 2011 and 2015. a) Unchanged canga, forest, mine and revegetated areas (REV). B) Conversion of forest to mine, canga to mine, mine to REV, and REV to mine.
This finding indicates a clear tendency of a decrease in canga area and its surrounding forest. Throughout the period of change (2011-2015), we observed that the mining area expanded mainly over canga (354 ha), followed by forest (264 ha). The revegetation of the mining area increased over time (378 ha), but its reuse by mining decreased (Fig. 5). The reformulation of the northern (N) waste pile and the suppression of smaller portions of temporary revegetation in the mining area were responsible for the transformation of revegetated sites in mining areas.
4. Discussion
The two-step segmentation of the scenes and the utilization of 8 different layers, including the digital terrain and slope models, permitted the mapping of the spatial land use dynamics of the N4-N5 mining complex from CNF between 2011 and 2015 with acceptable accuracy. The less detailed scale of the first segmentation step permitted the separation of the entire scene in terms of the areas of natural vegetation, i.e., canga and forest vegetation, and mining areas (including mining and revegetated areas). From level 1 of segmentation, the mining area class was segregated into small-scale (> 0.2 ha) revegetated and/or forest areas within the mine. This second segmentation presented a level of detail that was approximately three times greater than that of the first segmentation, allowing the identification of small and medium structures within the mine; this enhanced level of detail enabled us to map the revegetated areas within the mine operations. Thus, despite the use of different sensors that require individual atmospheric corrections and individual calibration, the resolution of our mapping was higher than that obtained from similar approaches [27]. The multispectral classification further allowed the separation of revegetated areas from areas covered by natural vegetation—without preliminary knowledge— from the time series.
Overall, the Kappa indices and accuracies of the classification indicate marginal confusion; these mismatches occurred principally between small revegetated areas and areas of exposed soil in mining sites, and these results confirmed the difficulties in identifying and classifying small features [41]. These limits are set by the spatial resolution of each scene. However, larger revegetated areas from structures such as waste piles were well classified, as spectral characteristics differentiated them from the surrounding mining areas or natural vegetation.
The individual calibration of scenes originating from different sensors resulted in threshold values that differed slightly between images. Nevertheless, the spectral differences in all scenes between land use classes, including the differences between natural vegetation and revegetated areas, enabled the detection of emerging structures such as areas of vegetation logging, i.e., land conversion from natural ecosystems to mine lands, and emerging rehabilitation sites, i.e., conversion of mine lands to revegetated areas. Thus, these spectral differences were sufficient to track the land use changes and accurately quantify the effectively revegetated areas. Specifically, the two-step segmentation of the high-resolution images enabled the identification of small revegetated structures, such as strait slopes, indicating the suitability of the proposed methodology for this study [21].
The evaluation of satellite images by segmentation and classification via eCognition as proposed here represents an effective tool to monitor the spatial extent of revegetation activities within open-cast mines. This technology may be helpful for outlining the fulfillment of environmental liabilities, such as the revegetation of mine lands scheduled by environmental or licensing agencies. Furthermore, the approach proposed here is suitable for monitoring revegetation activities; the intersection and quantification of revegetated areas with areas planted by operations contributes to the identification of revegetation constraints, e.g., inadequate planting periods or substrates disabling plant survival, thus contributing to more effective mine land revegetation.
The reduction of natural vegetation and the increase in mining area show that the N4-N5 Carajás mining complex is a fully expanding mine and indicates that the iron ore reserves are not yet exhausted. Additional canga blocks and forest portions are expected to be logged in the near future to provide high-quality ore to satisfy international markets and generate economic and social welfare for the region. The amount of expansion (absolute as well as relative) of revegetated areas within the mining complex indicates that environmental liabilities are being addressed by the mining companies. Nevertheless, ground points are necessary to assess the quality of the revegetation, i.e., to assess whether revegetated areas drift to resilient ecosystems as required by legislation [13]. The combination of ground investigations with additional remote investigations of the scene may result in approaches that can be used to map vegetation structure [42] or species composition of revegetated areas, which may enable tracking the advance of revegetated sites towards natural ecosystems [43].
permanent structures, such as waste piles, to restore the biodiversity and ecosystem functioning of the mine lands, reducing the overall impact of the mining operations. Our classification was unable to differentiate between temporary and permanent rehabilitation areas, which is not surprising because similar seed mixtures and rehabilitation techniques, such as hydroseeding, biotextiles or manual trench digging, were applied for both purposes. Nevertheless, the high amount of revegetated area that was transformed to mining area (i.e., one-third of all revegetated areas mapped in 2011) indicates that a high amount of mine land greening is composed of temporary revegetation. In contrast, approximately two-thirds of the revegetated area mapped in 2011 may correspond to permanent revegetation, and this land is intended to rehabilitate mine land to improve long-term biodiversity and ecosystem services and reduce the overall impact of the mining operations.
Our classification revealed that only a very small amount (0.42 ha) of rehabilitated area was transformed to natural forest vegetation during the observation period (less than 0.05% of the entire rehabilitated area). Ground-cover points in these sites are essential for determining whether these areas are actually restored to the pre-mining levels of biodiversity and ecosystem functioning, thus confirming land cover and land use classification. However, this figure shows that the revegetated mining structures maintained their multispectral characteristics during the observation period, indicating that the required pre-mining levels of ecosystem characteristics from cangas or forests have not yet been achieved. This result is expected, as environmental rehabilitation in tropical ecosystems may span centuries [44]; in contrast, the studied revegetated areas are, at most, decades old, meaning they still maintain their spectral signature as rehabilitating areas.
5. Conclusions
Our classification permitted the mapping of land cover and open-cast mine changes in the N4-N5 mining complex with sufficient accuracy. After the atmospheric correction of images, elaborating the digital terrain and slope models, and calibrating the threshold values for individual scenes, the proposed methodology is sufficiently robust to monitor land use changes in mining sites, offering a powerful tool for all stakeholders. Specifically, the remote sensing of mine land revegetation dynamics is able to monitor the efficiency of revegetation activities and the attendance of the mitigation hierarchy as required by national environmental laws. This highlights the importance of the proposed two-step segmentation and multispectral classification, as single-step segmentation or single layers would not be sufficient to accurately separate the land use classes in the mining scene. Combined with ground data, additional remote investigations of the scene should be used to develop classification approaches for revegetated sites according to their structure or species composition, useful for tracking advances of rehabilitating sites towards natural ecosystems.
Supplementary Materials: The following are available online at www.mdpi.com/xxx/s1, Table S1: Confusion matrices for image classification: a) 2011 Ikonos; b) 2012 GeoEye; c) 2013 Ikonos; and d) 2015 WorldView-3.
Author Contributions: Conceptualization, P.W.M.S.F.; field work collection, F.S.N., W.R.N., D.C.S., P.W.M.S.F., M.F.C.; digital image processing, GIS and formal analysis, accuracy assessments, F.S.N., W.R.N., DC.S., P.W.M.S.F., writing – original draft preparation, M.G., F.S.N., P.W.M.S.F., review and editing, P.W.M.S.F., M.G.
Funding: This research received no external funding.
Acknowledgments: The authors thank the Vale Institute of Technology (ITV) for its management support. The authors are also grateful to the Vale Mining Company for logistical support. PWMSF was supported by CNPq through research scholarships. This project was carried out in the Carajás National Forest with permission from IBAMA (SISBIO 35594-2).
References
1. Koruyan, K.; Deliormanli, A.H.; Karaca, Z.; Momayez, M.; Lu, H.; Yal??in, E. Remote sensing in
management of mining land and proximate habitat. J. South. African Inst. Min. Metall.2012, 112, 667–672.
2. Gastauer, M.; Souza Filho, P.W.M.; Ramos, S.J.; Caldeira, C.F.; Silva, J.R.; Siqueira, J.O.; Furtini Neto, A.E.
Mine land rehabilitation in Brazil: Goals and techniques in the context of legal requirements. Ambio2018.
3. Hamann, R.; Kapelus, P. Corporate Social Responsibility in Mining in Southern Africa: Fair accountability
or just greenwash? Development2004, 47, 85–92.
4. ICMM Good Practice Guidance for Mining and Biodiversity; International Council of Mining and Metals:
London, 2006;
5. Skirycz, A.; Castilho, A.; Chaparro, C.; Carvalho, N.; Tzotzos, G.; Siqueira, J.O. Canga biodiversity, a matter
of mining. Front. Plant Sci.2014, 5, 1–9.
6. Bisone, S.; Chatain, V.; Blanc, D.; Gautier, M.; Bayard, R.; Sanchez, F.; Gourdon, R. Geochemical
characterization and modeling of arsenic behavior in a highly contaminated mining soil. Environ. Earth Sci.
2016, 75, 69621.
7. International Finance Corporation Performance Standard 6: Biodiversity Conservation and Sustainable
Management of Natural Resources; IFC, Ed.; 2012;
8. Maron, M.; Brownlie, S.; Bull, J.W.; Evans, M.C.; von Hase, A.; Quétier, F.; Watson, J.E.M.; Gordon, A. The
many meanings of no net loss in environmental policy. Nat. Sustain.2018, 1, 19–27.
9. Ekstrom, J.; Bennun, L.; Mitchell, R. A Cross-Sector Guide for Implementing the Mitigation Hierarchy.;
Cambridge, 2015;
10. Bull, J.W.; Suttle, K.B.; Gordon, A.; Singh, N.J.; Milner-Gulland, E.J. Biodiversity offsets in theory and
practice. Oryx2013, 47, 369–380.
11. Bull, J.W.; Gordon, A.; Watson, J.E.M.; Maron, M. Seeking convergence on the key concepts in ‘no net loss’ policy. J. Appl. Ecol.2016, 53, 1686–1693.
12. Moffat, K.; Zhang, A. The paths to social licence to operate: An integrative model explaining community
acceptance of mining. Resour. Policy2014, 39, 61–70.
13. Gastauer, M.; Silva, J.R.; Caldeira Junior, C.F.; Ramos, S.J.; Souza Filho, P.W.M.; Furtini Neto, A.E.; Siqueira,
J.O. Mine land rehabilitation: Modern ecological approaches for more sustainable mining. J. Clean. Prod.
2018, 172, 1409–1422.
14. Perring, M.P.; Standish, R.J.; Hobbs, R.J. Incorporating novelty and novel ecosystems into restoration
planning and practice in the 21st century. Ecol. Process.2013, 2, 1–8.
15. Padmanaban, R.; Bhowmik, A.; Cabral, P. A Remote Sensing Approach to Environmental Monitoring in a
Reclaimed Mine Area. ISPRS Int. J. Geo-Information2017, 6, 401.
16. Townsend, P.A.; Helmers, D.P.; Kingdon, C.C.; McNeil, B.E.; de Beurs, K.M.; Eshleman, K.N. Changes in
the extent of surface mining and reclamation in the Central Appalachians detected using a 1976-2006
Landsat time series. Remote Sens. Environ.2009, 113, 62–72.
17. Asner, G.P.; Llactayo, W.; Tupayachi, R.; Luna, E.R. Elevated rates of gold mining in the Amazon revealed
through high-resolution monitoring. Proc. Natl. Acad. Sci. U. S. A.2013, 110, 18454–18459.
18. Chen, W.; Li, X.; He, H.; Wang, L. A Review of Fine-Scale Land Use and Land Cover Classification in
Open-Pit Mining Areas by Remote Sensing Techniques. Remote Sens. 2018, 10.
19. Sonter, L.J.; Barrett, D.J.; Soares-Filho, B.S.; Moran, C.J. Global demand for steel drives extensive land-use
change in Brazil’s Iron Quadrangle. Glob. Environ. Chang.2014, 26, 63–72.
Guimarães, J.T.F.; Dall’Agnol, R.; Siqueira, J.O. Four decades of land-cover, land-use and hydroclimatology changes in the Itacaiúnas River watershed, southeastern Amazon. J. Environ. Manage.2016, 167, 175–184.
21. Souza-Filho, W.P.; Nascimento, R.W.; Santos, C.D.; Weber, J.E.; Silva, O.R.; Siqueira, O.J. A GEOBIA
Approach for Multitemporal Land-Cover and Land-Use Change Analysis in a Tropical Watershed in the
Southeastern Amazon. Remote Sens. 2018, 10, 1683.
22. Karan, S.K.; Samadder, S.R.; Maiti, S.K. Assessment of the capability of remote sensing and GIS techniques
for monitoring reclamation success in coal mine degraded lands. J. Environ. Manage.2016, 182, 272–283.
23. Demirel, N.; Emil, M.K.; Duzgun, H.S. Surface coal mine area monitoring using multi-temporal
high-resolution satellite imagery. Int. J. Coal Geol.2011, 86, 3–11.
24. Vogelmann, J.E.; Gallant, A.L.; Shi, H.; Zhu, Z. Perspectives on monitoring gradual change across the
continuity of Landsat sensors using time-series data. Remote Sens. Environ.2016, 185, 258–270.
25. Ma, B.; Chen, Y.; Zhang, S.; Li, X. Remote Sensing Extraction Method of Tailings Ponds in Ultra-Low-Grade
Iron Mining Area Based on Spectral Characteristics and Texture Entropy. Entropy2018, 20, 345.
26. Kennedy, R.E.; Yang, Z.; Cohen, W.B. Detecting trends in forest disturbance and recovery using yearly
Landsat time series: 1. LandTrendr — Temporal segmentation algorithms. Remote Sens. Environ.2010, 114,
2897–2910.
27. Yang, Y.; Erskine, P.D.; Lechner, A.M.; Mulligan, D.; Zhang, S.; Wang, Z. Detecting the dynamics of
vegetation disturbance and recovery in surface mining area via Landsat imagery and LandTrendr
algorithm. J. Clean. Prod.2018, 178, 353–362.
28. Piló, L.B.; Auler, A.S.; Martins, F. Carajás National Forest: Iron Ore Plateaus and Caves in Southeastern
Amazon BT - Landscapes and Landforms of Brazil. In; Vieira, B.C., Salgado, A.A.R., Santos, L.J.C., Eds.;
Springer Netherlands: Dordrecht, 2015; pp. 273–283 ISBN 978-94-017-8023-0.
29. Viana, P.L.; Mota, N.F. de O.; Gil, A. dos S.B.; Salino, A.; Zappi, D.C.; Harley, R.M.; Ilkiu-Borges, A.L.;
Secco, R. de S.; Almeida, T.E.; Watanabe, M.T.C.; et al. Flora das cangas da Serra dos Carajás, Pará, Brasil:
história, área de estudos e metodologia. Rodriguésia 2016, 67, 1107–1124.
30. Mota, N.F. de O.; Silva, L.V.C.; Martins, F.D.; Viana, P.L. Vegetação sobre sistemas ferruginosos da Serra
dos Carajás. In Geossistemas ferruGinosos do brasil Áreas prioritárias para conservação da diversidade geológica e
biológica, patrimônio cultural e serviços ambientais; Carmo, F.F. do, Kamino, L.H.Y., Eds.; Belo Horizonte, 2015;
pp. 289–315.
31. Resende, N.P. Carajás: memória da descoberta; Editora Gráfica Stampa: Rio de Janeiro, 2009;
32. Paradella, W.R.; Ferretti, A.; Mura, J.C.; Colombo, D.; Gama, F.F.; Tamburini, A.; Santos, A.R.; Novali, F.;
Galo, M.; Camargo, P.O.; et al. Mapping surface deformation in open pit iron mines of Carajás Province
(Amazon Region) using an integrated SAR analysis. Eng. Geol.2015, 193, 61–78.
33. Richter, R. Atmospheric/Topographic Correction for Satellite Imagery; DLR: Wessling, 2010;
34. PCI_Geomatica Geomatica orthoengine: Course exercises. 2015, 172.
35. Tarpley, J.D.; Schneider, S.R.; Money, R.L. Global Vegetation Indices from the NOAA-7 Meteorological
Satellite. J. Clim. Appl. Meteorol.1984, 23, 491–494.
36. McFEETERS, S.K. The use of the Normalized Difference Water Index (NDWI) in the delineation of open
water features. Int. J. Remote Sens.1996, 17, 1425–1432.
37. Ponzone, F.J.; Shimbukuro, Y.E. Sensoriamento remoto no estudo da vegetação; Parêntese: São José dos Campos,
2009;
38. Blaschke, T. Object based image analysis for remote sensing. ISPRS J. Photogramm. Remote Sens.2010, 65, 2–
16.
use/cover classification in the Brazilian Amazon using satellite images. Pesqui. Agropecu. Bras.2012, 47,
10.1590/S0100-204X2012000900004.
40. Congalton, R.G.; Green, K. Assessing the accuracy of remotely sensed data: Principles and practices; 2. ed.; Taylor
& Francis, 2008;
41. Puertas, O.L.; Brenning, A.; Meza, F.J. Balancing misclassification errors of land cover classification maps
using support vector machines and Landsat imagery in the Maipo river basin (Central Chile, 1975–2010).
Remote Sens. Environ.2013, 137, 112–123.
42. Johansen, K.; Erskine, P.D.; McCabe, M.F. Using Unmanned Aerial Vehicles to assess the rehabilitation
performance of open cut coal mines. J. Clean. Prod.2019, 209, 819–833.
43. Kimball, S.; Lulow, M.; Sorenson, Q.; Balazs, K.; Fang, Y.-C.; Davis, S.J.; O’Connell, M.; Huxman, T.E.
Cost-effective ecological restoration. Restor. Ecol.2015, 23, 800–810.

![Figure 8. Increase in revegetaed area (REV) on three selected waste piles (South 4 [S 4], West [W] and Northwest 2 [NW 2]) from the N4-N5 mining complex from Carajás, Brazil, between 2011 and 2015](https://thumb-us.123doks.com/thumbv2/123dok_us/7872765.1305965/13.595.85.504.65.735/figure-increase-revegetaed-selected-northwest-complex-carajas-brazil.webp)
