1
Development of a Rapid Method for the Determination of Caffeine in
Coffee Grains by GC-FID-A Fully Validated Approach
Ioannis Pasiasa, Ioannis Kyriakoub, Charalampos Proestosc,*
aGeneral Chemical Lab of Research and Analysis, Timfristou 181, 35100 Lamia, Greece bLamia Laboratory, Karaiskaki 85, 35100 Lamia, Greece
cLaboratory of Food Chemistry, Department of Chemistry, National and Kapodistrian University of Athens Panepistimiopolis Zografou, 15771 Athens, Greece
*Corresponding author: Dr Proestos Charalampos Assistant Professor in Food Chemistry
e-mail: [email protected]
Laboratory of Food Chemistry, Department of Chemistry, National and Kapodistrian University of Athens, Zografou, 157 84 Athens, Greece
Office: Ground floor , Wing B, Office 6 Tel: +30 210 7274160, Fax: +30 210 7274476
Abstract
A simple method for the determination of caffeine in coffee grains by GC-FID is presented in the current work. The method was fully validated according to ISO 17025 requirements and European Commission regulation. The accuracy, as provided by recovery experiments was higher than 93%, and the precision, as provided by the (%)Relative standard deviation under reproducibility conditions, was lower than 5%. All independent parameters that lead in the increase of methods uncertainty were investigated. In the present work all special precautions were taken into account in order to avoid the use of an internal standard. The method was applied in real samples and possible health claims were investigated.
2
Keywords: Caffeine, Uncertainty calculation; ISO 17025, Guatemala coffee grains; GC-FID
1. Introduction
Current food industry trends include the production of new functional foods, so far known as “superfoods”, with pro-health properties through the introduction of components with antioxidant or antimicrobial activity [1]. Recently, green coffee has been introduced as food supplement, regarding its functional and antioxidant activity, since it contains phenolic compounds and caffeine. On the other hand, caffeine is a stimulant, which has different health effects concerning stimulation of the central nervous system and can produce restlessness, headaches, and irritability. Large amount of caffeine consumption can cause physiological and psychiatrical dependence [2]. The European Food Safety Authority mandates that energy drinks with over 150 parts per million (ppm) or 150 mg/L caffeine content should be labeled as ones with “high caffeine content” and the exact amount should be indicated; except tea, coffee, and cocoa.
3
The aim of the current study was to develop a rapid, accurate, precise and low cost analysis for the determination of caffeine in coffee grains by GC-FID without using an internal standard. To the best of our knowledge, it is for the first time that a gas chromatography method for the determination of caffeine without the use of an internal standard is presented in the literature. For this reason special precautions for the accuracy and the precision of the method were taken and presented for the first time. Finally, a whole validation protocol guide according to ISO 17025 accreditation standard is presented [4].
2. Materials and methods 2.1. Instrumentation
All measurements were performed with a Shimadzu GC 2010 PLUS, GC-FID system, using an Agilent DB-1 column. The optimized conditions were: injection volume 1 μL in split mode 1:50, injector temperature 280 oC, carrier gas He at a constant flow 1.8 mL/min, detector temperature 300 oC. The initial oven temperature, 100 oC was held for 2 min, then programmed at 8 oC/min to 180 oC, and finally programmed at 10 oC/min to 250 oC where was held for 0 min.
2.2.Analytical procedure
Three different qualities of coffee grains were purchased from the local markets in Lamia, Greece. From each category three different samples under the same brand name were purchased in order to estimate the average content of each sample. Samples were homogenized in a mortar.
4
For method accuracy the same procedure was followed for fortified samples spiked with a known amount of analyte at three different content levels, and the estimation of recovery and %relative standard deviation under inter- and intra-day precision was performed. In order to avoid the use of an appropriate internal standard a quality control chart was constructed and the internal quality sample was analyzed after 5 different runs.
2.3.Method validation
The method was fully validated in view to Commission Decision of 12 August 2002 implementing Council Directive 96/23/EC concerning the performance of analytical methods and the interpretation of results [5].
Both standard addition and external calibration curve were constructed in order to check possible matrix interferences by comparing the slopes using the t-test, as criterion. The instrumental and methods limit of detection was calculated by multiplying the standard error of the intercept by 3.3 and dividing the calculated result by the slope. Similar procedure was followed for the calculation of the limit of quantification, but the factor for intercept multiplication was equal to 10.
5
The accuracy of the method was estimated by the calculation of the %recovery for three different fortified content levels, measured six times each. Recovery data were considered as acceptable when they were within ± 20% of the theoretical fortified content [5].
Internal quality control charts (IQCs) were also constructed in order to monitor whether results are reliable enough to be released. The objective of IQCs is the elongation of method validation: continuously checking the accuracy of analytical data obtained from day to day in the laboratory. The analytical system is under control if no more than 5% of the measured values exceed the warning limits and none of them the action or control limits [7-11]. The quality control chart was constructed by an internal quality fortified sample of coffee measured after 5 runs.
6 3. Results and discussion
3.1. Results of method validation
7
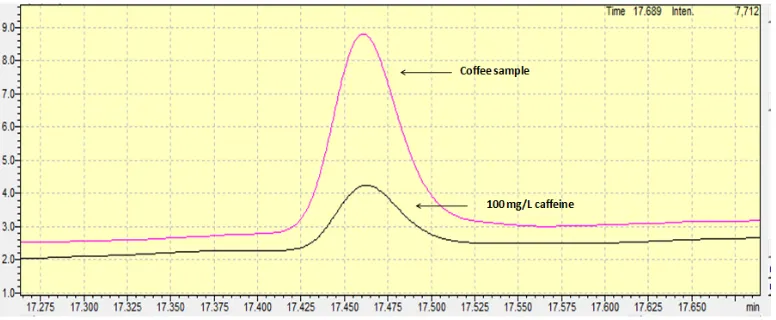
Figure 1: Chromatograms of caffeine in a standard solution and in a coffee grain sample.
The limit of detection as provided from the standard error of the intercept of the calibration curve was found equal to 3.1 mg/L or 62 mg caffeine/kg. The limit of quantification was found equal to 9.3 mg/L or 186 mg caffeine/kg. Comparing the limits of detection and quantification with those achieved from other works and by other methods it can be concluded that the values detetmined in the current work are similalry or slightly worst than other, but surely “fit for purpose” regarding the content levels of caffeine in coffee grains. For example, better limit of detection was achieved compared to HPLC-UV method proposed by Fernández et al. (2000), and similar compared to the respective achieved by Derivative-spectrophotometry as proposed by Alpdogan et al. (2002) [14,15]. On the other hand, the limits of detection were worst than those proposed by Shrivas and Wu (2007), Song (Sherry) and Ashley (1998), and slightly worse than the respective proposed by Frizzarin et al. (2016) who determined by caffeine using a fully-automated in-syringe dispersive liquid-liquid microextraction [16-18].
8
though no internal standard solution was used the %RSDr (intra-day precision) and %RSDR (inter-day precision) for all fortification levels was lower than 5% and the HORRATr and HORRATR values lower than the crucial value of two (Table 1). The results proved that for high content levels the uncertainty of the volume injection reading will not have an effect on the results precision with or without using an internal standard.
Table 1: Results of intra- and inter-day precision in three different fortification levels.
Fortification level %RSDr %RSDR
0.5 4.1 4.5
1.0 2.5 3.4
2.0 2.0 2.2
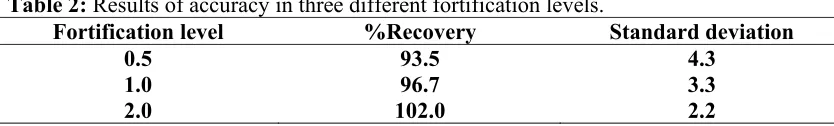
The accuracy of the method, as calculated by the recovery of the three different fortification levels, was found higher than 93.5% (Table 2). The method was considered “fit for purpose”. The spiked sample fortified with 1.0% (w/w) caffeine was defined as the internal quality control sample used for the construction of the internal quality control sample. After five different consecutive runs the internal control sample was analyzed and the value was recorded in the internal quality control sample. It was observed that in whole analysis procedure there was no trend for the measured values to exceed the warning limits or the action limits, and therefore the analytical system was considered us “under control”.
Table 2: Results of accuracy in three different fortification levels.
Fortification level %Recovery Standard deviation
0.5 93.5 4.3
1.0 96.7 3.3
2.0 102.0 2.2
9
uncertainty, and the precision uncertainty. The calculated expanded uncertainty was found equal to 16.0%, 14.5%, and 14.0% for the 0.5 (%w/w), 1.0 (%w/w) and 2.0 (%w/w) fortification levels, respectively.
3.2. Health claim
The developed and fully validated method was applied for the determination of caffeine in different Guatemala coffee grain samples (n=3) (Figure 1). The mean caffeine content was found equal to 1.3% (w/w). Taking into account that a cup of coffee contains 80 mg of coffee, the mean intake content of caffeine for an adult is equal to 1.04 mg per day. This means that the caffeine weekly intake for an adult is equal to 7.3 mg. In Richards and Smith (2015) excellent work the association between caffeine and different psychological situations were investigated. According to their work the weekly intake of 7.3 mg found in the current work may cause anxiety in males and stress, and depression in both males and females [2]. However, it is possible that the effects observed in Richards and Smith work (2015) are attributable to personality characteristics associated with caffeine users, rather than to their use of caffeine [2]. Future research should therefore aim to conduct intervention studies in order to investigate the nature of these relationships further.
4. Conclusion
10
The RSD bias and the inter-day precision provided the higher uncertainty in the method. The Guatemala coffee grains analyzed by the developed method contain a high amount of caffeine, and can be used as functional food but may also lead to depression and anxiety.
References
1. Dziki, D.; Gawlik-Dziki, U.; Pecio, Ł.; Rózyło, R.; Krzykowski, M.S.A.; Rudy, S. Ground green coffee beans as a functional food supplement-Preliminary study. LWT Food Sci. Technol. 2015, 63, 691-699.
2. Richards, G.; Smith, A. (2015). Caffeine consumption and self-assessed stress, anxiety, and depression in secondary school children. J. Psychopharmacol.
2015, 29, 1236–1247.
3. Jeszka-Skowron, M.; Sentkowska, A.; Pyrzynska, K.; De Peña M.P. Chlorogenic acids, caffeine content and antioxidant properties of green coffee extracts: influence of green coffee bean preparation. Eur. Food Res. Technol.
2016, 242, 1403–1409.
4. ISO/IEC 17025:2005, General requirements for the competence of testing and calibration laboratories.
5. European Commission, Decision of 12 August 2002 implementing Council Directive 96/23/EC concerning the performance of analytical methods and the interpretation of results, L 221/8-L 221/36.
6. Thompson, M. (2000). Recent trends in inter-laboratory precision at ppb and sub-ppb concentrations in relation to fitness for purpose criteria in proficiency testing. Analyst 2000, 125, 385–386.
11
honey freshness and adulteration. Food Chem. 2017, 229, 425–431.
8. Psoma, A.K.; Pasias, I.N.; Rousis N.I.; Barkonikos K.A.; Thomaidis N.S. Development, validation and accreditation of a method for the determination of Pb, Cd, Cu and As in seafood and fish feed samples. Food Chem. 2014,
151, 72–78.
9. Raptopoulou, K.G.; Pasias, I.N.; Thomaidis, N.S.; Proestos Ch. Study of the migration phenomena of specific metals in canned tomato paste before and after opening. Validation of a new quality indicator for opened cans. Food Chem. Toxicol. 2014, 69, 25-31.
10.Pasias, I.N.; Papageorgiou, V.; Thomaidis, N.S.; Proestos Ch.. Development and Validation of an ETAAS Method for the Determination of Tin in Canned Tomato Paste Samples. Food Anal. Methods 2012, 5, 835-840.
11.Taverniers, I.; De Loose, M.; Van Bockstaele, E. Trends in quality in the analytical laboratory. II. Analytical method validation and quality assurance.
Trends Anal. Chem. 2004, 23, 535-552.
12.Eurachem Citac Guide CG4, (2000). Quantifying Uncertainty in Analytical Measurement, English edition, Second edition.
13.Hewavitharana, A. K. Internal Standard—Friend or Foe? Crit. Rev. Anal. Chem. 2009, 39, 272–275.
14.Fernández, P. L.; Martín, M. J.; González, A. G.; Pablos, F. HPLC determination of catechins and caffeine in tea. Differentiation of green, black and instant teas. Analyst, 2002, 125, 421–425.
12
16.Shrivas, K.; Wu, H. Rapid determination of caffeine in one drop of beverages and foods using drop-to-drop solvent microextraction with gas chromatography/mass spectrometry. J Chromatogr A, 2007, 1170, 9–14.
17.Song (Sherry), S.; Ashley, D. L. Sample purification for the analysis of caffeine in tobacco by gas chromatography-mass spectrometry. J Chromatogr A, 1998, 814, 171–180.