Possible Steady State Voltage Stability
Analysis of Electric Power System Using PV
Curve Analysis
Neha Parsai
1, Alka Thakur
2M.Tech Student, Department of Electrical Engineering, SSSIST Sehore, M.P. India1 Assistant Professor, Department of Electrical Engineering, SSSIST Sehore, M.P. India2
ABSTRACT In recent years, voltage instability and voltage collapse have been observed in power systems of many countries. Such problems have occurred even more often in developed countries because of utility deregulation. Currently, voltage security is of major importance for successful operation of power systems. Assessment of voltage security is needed to utilize power transmission capacity efficiently and to operate the system uninterruptedly. In our research work, we study voltage security of on power system of IEEE20 bus system. We assess voltage security of these systems using P-V curve In other words, we compute margins of real power(P) . To achieve what we promise, we first obtain the power-flow solution for the given data by running the power-flow program that we have coded using MATLAB. The solution is taken as the base case. Second, we choose candidate buses at which we incrementally change real power for plotting P-V curves. The candidate buses are of load buses so that P margins are computed against increase in demand. Third, we run the power-flow program for incremental changes in real power at the candidate bus. The point at which power-flow convergence is no more available is the critical point. Up to the critical point, we obtain voltages at the candidate bus corresponding to changing realpower at the same bus.Fourth, we plot P-V curves using voltages versus P .Finally, the difference between the real power demanded the candidate bus at the critical point and that at the base case gives us the P-margin computed for the candidate bus. This paper proposed that Our investigation of power-flow solutions, P-V curves of the 20 bus IEEE system -shows that we obtain power-flow solution using Newton-Raphson method and compute margins of voltage security with predefined tolerance using MATLAB. Such computations provide us indispensable information for the secure and efficient operation of power systems.
KEYWORD: Voltage stability, Contingency analysis Load shedding, P–V curve–Q–V curve ,Voltage stability margin.
I.INTRODUCTION
is plotted for a constant power factor under a series of computing load-flow solutions that are based on the continuation method [10, 11] or repeated power flow method.
The P–V curve presents the maximum load-ability (real power) limits of a power system or network maximum power transfer capacity. The Western Electricity Coordinating Council (WECC) proposes a minimum P–V margin requirement of 5% for a single contingency, 2.5% for double contingencies, and larger than zero for multiple contingencies (N≥3) [12]. Many optimal power flow methods for voltage stability analysis are also based on P–V curve margin perspectives [13–17].Steady-state stability is defined as the capability of the network to withstand a small disturbance (fault, small change of parameters, topology modification) in the system without leaving a stable equilibrium point. On the contrary, voltage instability can be described as the system state, when the voltage slowly decreases (due to insufficient reactive reserves) until significant voltage drop appears (voltage collapse).The effect is even lower voltage, repetitive occurrence of stalling and line trippings.For the prevention of voltage collapse, several types of compensation devices are massively used - both shunt capacitors and inductors, series capacitors (TCSCs), SVCs, synchronous condensers, STATCOMs, etc. To reduce the voltage profile (in case of low demand), var consumption must be increased - switching in shunt reactors disconnecting cable lines, reducing MVAR output from generators and synchronous condensers, tap changing, etc. Opposite actions are taken for increasing bus voltages.However, voltage conditions may be even worsened in some cases by massive use of shunt capacitors.
II.ANALYTICAL SOLUTION USING THE THEORY OF LOAD FLOW ANALYSIS
A. Theoretical background to the nose (voltage-power, V-P) curve
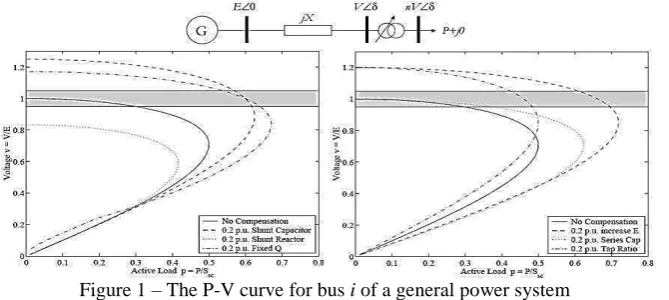
Major goal of the steady-state voltage stability analysis is the computation of the V-P curve, also known as the "nose curve" – see Fig. 1. For the chosen PQ bus of the network, this curve shows the dependence of the bus voltage magnitude (vertical axis) on the active power load in the bus when increased from zero to its maximum possible value.
Figure 1 – The P-V curve for bus i of a general power system
At the beginning, the voltage starts from the value equal or close to 1.0 per units slowly moving down with gradually increased active power load. In a certain point – so called "saddle node bifurcation point" or "singular point", further load increase would provide no feasible operating voltage magnitude at all and voltage collapse occurs. Therefore, this limited load value is called the "maximum loadability" and corresponding voltage value the "critical voltage". From this point on, only the decrease of power leads to a solution until zero voltage and load are reached. In the practice, only the higher half of bus voltage magnitudes provides a stable operating point.. Among others, level of the reactive power reserve shows the
Figure 2 – Effects of possible compensation devices on the V-P curve
As shown in Fig. 2 above, higher critical voltage value along with higher maximum loadability can be suitably reached using series capacitors, fixed var injections, increased supply voltage and tap ratio switching actions.
B.Analyzed problem I. (3-bus power system)
Although the voltage collapse is a dynamic problem, it can be analyzed using static methods whether the power system parameters move slowly. As the first case study, a 2-bus power system (see Fig. 3) has been considered. The network consists of 3 buses in total, where bus 3 is the consumption point with connected P-Q load. Bus 3 is connected to bus 2 via a long transmission line (R = 8.2 W, X = 89.63 W, B = 1258 mS). The load is supplied from a large part of the country's transmission network, which has been simplied by the Thevenin's theorem into an equivalent power source in slack bus 1. Bus 1 is interconnected with the transmission line 2-3 via relevant system reactance (X = 36 W). The task is to derive the analytical relations between the active power load, voltage magnitude and the phase angle in bus 3.
Figure3 – Original network model a) and its final representation b)
For the voltage stability study, calculation in per units (Vbase = 400 kV, Sbase = 100 MVA) andconstant power
factor for load in bus 3 have been chosen. It was also necessary to recalculate the original network scheme in Fig. 3a) into an equivalent p - element – see Fig. 3b The final 2-bus power system (Fig. 3b)) can be described using the load flow nodal equations – see below.
pref−jqref
1.ej0° = g13+ g10+ j b13+ b10 . 1. ej0
°
− g13+ jb13 VBejθ
−pk+jqk
VBe−jθ = − g13+ jb13 . 1. e
j0°
− g13+ g30+ j b13+ b30 VBejθ
For bus 3, active and reactive loads with constant power factor (p.f.) can be expressed as follows:
qk = pk tan arccos p. f. = e. pk
When separating real and imaginary components, the following system of equations can beobtained from the second equation of (2).
Voltage conditions in the network can be examined by solving the above system of equations.Beside the voltage problem, each voltage decrease in bus 3 of the network will result in an increase of voltage phase angle q, which moves state variables close to the static stability limit.Relation between the bus voltage vB and the phase angle q (Eqn. 4) can be simply derived from Eqn. 3.
VB =
b13+ eg13 cosθ+ eb13− g13 sinθ
b13+ b30 + e g13+ g30
When putting Eqn. 18 into the first of Eqn. 3, final formula for static stability pk = f() can beobtained.
pk =
g13b30−g30b13 b13+eg13
b13+b30 +e g13+g30 2 cos
2θ+ b132 +b13b30+g132 +g13g30 eb13−g13
b13+b30 +e g13+g30 2 sin
2θ+
−
2 g13+g30 g13e+b13 b13e−g13 −
b132 +2g13b13e−g213 b13+b30+e g13+g30
b13+b30 +e g13+g30 2 cosθ. sinθ
The V-P curve can be found by expressing terms 'cos' and 'sin ' separately from Eqn. 4 using the trigonometrically identity formula. By placing them into the first of Eqn. 3, the nose curve is as follows.
pk =
g132 + b 13 2 b
13+ b30 + e g13+ g30 eVB2+
+ g132 + b132
VB g13− eb13 2+ b13+ eg13 2− b13+ b30 + e g13+ g30 2VB2
g13− eb13 2+ b13+ eg13 2
− g13+ g30 VB2
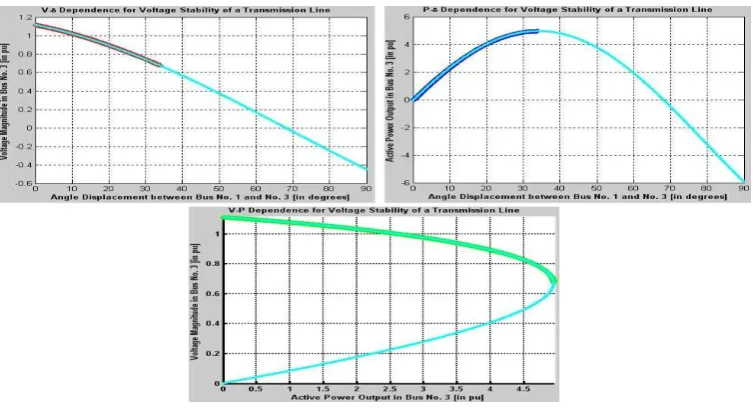
Values of critical voltage vcrit and static stability -qcrit can be found by differentiating Eqns. 5 and6 by VB and q and
setting to zero. The value of maximum loadabilitypkmaxcan be then simply obtained fromEqn. 6.
dpk
dVB
= 0 → VBcrit = 0.669511426pu ≈ 267.81kV
dpk
dθ = 0 → −θcrit = 34°12′32" ≈ 0.59705rad
→ pkmax ≈ 4.9487pu 494.87MW
network. Due to these factors, the Newton-Raphson method was massively adopted in the past for becoming more suitable for assessing stable and unstable operations of electric power systems.
Figure 4 – Final graphical outputs for the 2-bus power system (both analytical and numerical)
III.CONTINUATION LOAD FLOW ANALYSIS
Several static approaches consequential from the traditional load flow programs are being used for theevaluation of the network stability – from the optimal active and reactive power flow (OPF) and eigenvalue analysis through the sensitivity based and path-following methods (such as the continuation load flow) up to modal analysis for transient voltage stability.
Continuation load flow analysis suitably modifies conventional load flow equations to becomestable also in the singular point of the V-P curve and therefore to be capable to calculate both upper and lower part of the V-P curve. For this, it uses the two-step predictor/corrector algorithms along with single new unknown state variable (so-called continuation parameter). The predictor estimates approximate state variable values in the new step (close to the V-P curve) while the corrector makes the corrections of new state variable values to suit the load flow equations – see Fig. 5. As a result, the voltage stability margin for the current operational point can be simply evaluated. Moreover, based on the differential changes of state variables in each predictor step it is possible to locate weak buses and even areas of the system with largest voltage changes with respect to the load increase
Furthermore, the continuation load flow algorithm can be simply formulated for load increase (both active and reactive) in a single bus, in particular network area with more buses or even in the entire network
A.Initial continuation load flow studies
For the first analysis set, the continuation load flow predictor/corrector algorithm has been created in Matlab environment for simulating voltage stability in a chosen PQ bus of the network and relevant responses to the increase of both active and reactive power loads with constant power factor. The Using the numerical approach, maximum load ability of 4.94817 pu and critical voltage of 0.67522 pu have been obtained. When compared to critical values from the analytical solution (4.9784 pu and 0.6695 pu, Eqn. 7), it is obvious that high accuracy of the results has been maintained. In the second study, the IEEE 20-bus power system has been analyzed in terms of the voltage stability. This network (see Fig. 7) contains in total 8 physical PQ buses (No. 4 and 5 in the 132 kV section, No. 9 to 14 in the 33 kV section).The continuation load flow analysis for voltage stability in each PQ bus of the network has been performed separately by increasing both active and reactive power loads with maintained power factor(from the original load connected).
IV.METHODOLOGY OF MARGIN CALCULATION BY PV CURVE
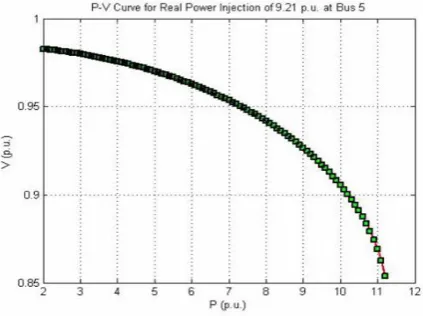
we generate P-V and Q-V curves by series of power-flow solutions. First of all, we run the power-flow program that we code in MATLAB environment using Newton-Raphson method to obtain the power-flow solution. Our program takes into account the reactive power limits of generators in the systems.
Choose a load bus at which the real power P is incrementally increased. The real power output of the generators should remain unchanged during the P-V analysis. The reactive power output of each generator should be allowed to adjust as the P-V analysis progresses. Voltage collapse occurs in the study region after the reactive power capability in the study region is depleted. Increase the real power P by 0.2 p.u. at the candidate bus..Iterate the processes at step 3 until the power flow does no more converge. To reach the collapse point (the nose of the curve) closely, take the last case at which the power flow converges as the base case. Decrease the value of increment to 0.1 p.u. and execute steps 3 and 4..Execute step 5, decreasing the value of increment to 0.05 p.u.Using the methodology for generating P-V curves which we discuss above, we generate P-V curves for load buses 5, 9, and 19 of the 20-bus IEEE system.8Run the program that plots the P-V curve using the calculated voltages corresponding to incrementally changed P values at the candidate bus. Compute the P margin, subtracting P value at the base case from maximum permissible real power Pmax, which is at the collapse point. The approximate P margins for the given buses are easily obtained from the P-V curves in these figures.
Figure7 P-V Curve 9 Bus IEEE20 Figure 8 P-V Curve 19 Bus IEEE20
V.CONLUSION
Main aim of this paper was to introduce the voltage stability problem along with possible analytical solution. In the second half, the continuation load flow analysis was presented and used for computing critical values (maximum loadability, critical voltage) and the stability margin for a 3-bus and IEEE 20-bus power systems using the developed programming tool in Matlab environment.
In future work, further development of the program will continue for incorporating the full-scale steady-state voltage stability analysis of even larger power systems. The target will be especially to evaluate stability margin values for all PQ buses concurrently with identifying weak areas of the network with respect to the load increase. Second, load flow analysis of ill- conditioned power systems and networks containing bad input data will be performed using the CLF algorithm for locating the errors in input load data and therefore to enable the load flow calculation using the conventional numerical methods such as the Gauss-Seidel and the Newton-Raphson.
REFRENCES
[1] Crow, M.: Computational Methods for Electric Power Systems, CRC Press: 2002, ISBN 0-8493-1352-X [2]Kundur, P.: Power System Stability and Control. McGraw-Hill: 1994, ISBN 0-07-035958-X
[3]Larsson, M.: Coordinated Voltage Control in Electric Power System. Doctoral dissertation.Lund University: 2000
[4]Doležal, J.; Pospíšil, V.: Hodnoceníbezpečnostichodusoustavy. Paper in ELEN posterconference. Prague: September 2010
[5]Guedes, Renato, B. L.; Alberto, Luis, F. C.; Bretas, Newton, G.: Power System Low-VoltageSolutions Using an Auxiliary Gradient System for Voltage Collapse Purposes. Paper in IEEETransactions on Power Systems: 2005
[6]Verbič, G.; Gubina, F.: A New Concept of Voltage-Collapse Protection Based on LocalPhasors. Paper in IEEE Transactions on Power Delivery: 2004
[7]Šmon, I.; Verbič, G.; Gubina, F.: Local Voltage-Stability Index Using Tellegen's Theorem.Paper in IEEE Transactions on Power Systems: 2006 [8]www.ee.washington.edu/research/pstca/
[9]Wu YK. A novel algorithm for ATC calculations and applications in deregulated electricity markets. Int J Electr Power Energy System 2007; 29(10):810–21.
[10] Ajjarapu V, Lee B. Bibliography on voltage stability. IEEE Trans Power System 1998; 1 3(1):115–225. [11]Glover D. J. and Sarma M. S., “Power System Analysis & Design,” PWS PublishingCompany, Third Edition, 2001 [12]Crow, M.: “Computational Methods for Electric Power Systems”, CRC Press: 2002, ISBN 0-8493-1352-X [13]Kundur, P.: “Power System Stability and Control”. McGraw-Hill: 1994, ISBN 0-07-035958-X
[14]Saadat H., “Power System Analysis,” McGraw-Hill International Editions, 2004
[17]Wood A. J. and Wollenberg B. F., “Power Generation, Operation and Control,” JohnWiley& Sons, 1996.
[18]Lof P. A., Anderson G., and Hill D. J., “Voltage Stability Indices for Stressed Power Systems,” IEEE Transactions on Power Systems, Vol. 8, No. 1, pp. 326-335, Feb. 1993.
[19]Huang Z., Bao L., and Xu W., “A Method to Measure QV Curves and Its Applications in Power Systems,” Electrical Power and Energy Systems
29, pp. 147-154, 2007