Scholarship@Western
Scholarship@Western
Electronic Thesis and Dissertation Repository
5-30-2012 12:00 AM
MRI-Based Attenuation Correction in Emission Computed
MRI-Based Attenuation Correction in Emission Computed
Tomography
Tomography
Harry R. Marshall
The University of Western Ontario
Supervisor Robert Z Stodilka
The University of Western Ontario
Graduate Program in Medical Biophysics
A thesis submitted in partial fulfillment of the requirements for the degree in Doctor of Philosophy
© Harry R. Marshall 2012
Follow this and additional works at: https://ir.lib.uwo.ca/etd
Part of the Biomedical Devices and Instrumentation Commons, Medical Biophysics Commons,
Nuclear Commons, and the Radiology Commons
Recommended Citation Recommended Citation
Marshall, Harry R., "MRI-Based Attenuation Correction in Emission Computed Tomography" (2012). Electronic Thesis and Dissertation Repository. 559.
https://ir.lib.uwo.ca/etd/559
This Dissertation/Thesis is brought to you for free and open access by Scholarship@Western. It has been accepted for inclusion in Electronic Thesis and Dissertation Repository by an authorized administrator of
by
Harry R. Marshall
Graduate Program in Medical Biophysics
A thesis submitted in partial fulfillment of the requirements for the degree of
Doctor of Philosophy
The School of Graduate and Postdoctoral Studies The University of Western Ontario
London, Ontario, Canada
c
CERTIFICATE OF EXAMINATION
Chief Advisor Examiners
Dr. Robert Stodilka Dr. Blaine Chronik
Advisory Committee Dr. Grace Parraga
Dr. Frank Prato Dr. Jonathan Mandel
Dr. Terry Thompson Dr. Vesna Sossi
Dr. Ian Cunningham
The thesis by
Harry Robert Marshall
entitled:
MRI-Based Attenuation Correction in Emission Computed Tomography
is accepted in partial fulfillment of the requirements for the degree of
Doctor of Philosophy
Date Chair of Examining Board
The hybridization of magnetic resonance imaging (MRI) with positron emission
to-mography (PET) or single photon emission computed toto-mography (SPECT) enables
the collection of an assortment of biological data in spatial and temporal register.
However, both PET and SPECT are subject to photon attenuation, a process that
de-grades image quality and precludes quantification. To correct for the effects of
attenu-ation, the spatial distribution of linear attenuation coefficients (µ-coefficients) within
and about the patient must be available. Unfortunately, extractingµ-coefficients from
MRI is non-trivial. In this thesis, I explore the problem of MRI-based attenuation
correction (AC) in emission tomography.
In particular, I began by asking whether MRI-based AC would be more reliable in
PET or in SPECT. To this end, I implemented an MRI-based AC algorithm relying
on image segmentation and applied it to phantom and canine emission data. The
subsequent analysis revealed that MRI-based AC performed better in SPECT than
PET, which is interesting since AC is more challenging in SPECT than PET.
Given this result, I endeavoured to improve MRI-based AC in PET. One problem
that required addressing was that the lungs yield very little signal in MRI, making it
difficult to infer theirµ-coefficients. By using a pulse sequence capable of visualizing
lung parenchyma, I established a linear relationship between MRI signal and the
lungs’ µ-coefficients. I showed that applying this mapping on a voxel-by-voxel basis
AC techniques.
Finally, I envisaged that a framework for MRI-based AC methods would
poten-tiate further improvements. Accordingly, I identified three ways an MRI can be
converted to µ-coefficients: 1) segmentation, wherein the MRI is divided into tissue
types and each is assigned an µ-coefficient, 2) registration, wherein a template of µ
-coefficients is aligned with the MRI, and 3) mapping, wherein a function maps MRI
voxels to µ-coefficients. I constructed an algorithm for each method and catalogued
their strengths and weaknesses. I concluded that a combination of approaches is
de-sirable for MRI-based AC. Specifically, segmentation is appropriate for air, fat, and
water, mapping is appropriate for lung, and registration is appropriate for bone.
Keywords: PET/MRI, SPECT/MRI, hybrid imaging, attenuation correction, lung
density, segmentation, registration, mapping
None of the research chapters contained herein were produced alone. The following
credits all co-authors and details their contributions, followed by my contributions.
Chapter 2 was co-authored by Dr. Robert Z. Stodilka, Dr. Jean Th´eberge, Dr.
Eric Sabondjian, Dr. Alexandre Legros, Ms. Lela Deans, Ms. Jane M Sykes, Dr.
R. Terry Thompson, and Dr. Frank S. Prato. Drs. Stodilka, Th´eberge, Legros,
Thompson, and Prato helped conceive, formalize, and develop the idea, Drs. Stodilka,
Th´eberge, and Sabondjian, Ms. Deans, and Ms. Sykes assisted with the experimental
design, Drs. Th´eberge and Sabondjian, Ms. Deans, and Ms. Sykes partook in data
collection, Drs. Stodilka and Sabondjian contributed to the data analysis, and Drs.
Stodilka, Th´eberge, Thompson, and Prato critically reviewed the manuscript. I
col-lected the data, coded the attenuation correction algorithm, designed and conducted
the analysis, and wrote the manuscript.
Chapter 3 was co-authored by Dr. Frank S. Prato, Ms. Lela Deans, Dr. Jean
Th´eberge, Dr. R. Terry Thompson, and Dr. Robert Z. Stodilka. Drs. Prato and
Stodilka helped conceive, formalize, and develop the idea, Drs. Prato, Stodilka, and
Th´eberge, and Ms. Deans assisted with the experimental design, Ms. Deans partook
in data collection, and Drs. Prato, Th´eberge, Thompson, and Stodilka contributed to
the data analysis in addition to critically reviewing the manuscript. I conceived the
idea, designed the experiment, collected the data, coded the attenuation correction
Chapter 4 was co-authored by Dr. Frank S. Prato, Mr. John Patrick, Dr. David
Laidley, Mr. John Butler, Dr. Jean Th´eberge, Dr. R. Terry Thompson, and Dr.
Robert Z. Stodilka. Dr. Stodilka and Mr. Patrick helped conceive, formalize, and
develop the idea, as well as assisting with the experimental design, Mr. Patrick and
Mr. Butler partook in data collection, Dr. Laidley contributed to the data analysis,
and Drs. Stodilka, Th´eberge, Thompson, and Prato, and Mr. Patrick critically
reviewed the manuscript. I conceived the idea, designed the experiment, collected
the data, coded the attenuation correction algorithms, designed and conducted the
analysis, and wrote the manuscript.
for filling my life
with love and laughter.
No man is an island, and a veritable archipelago of individuals have helped make this
thesis a reality. First and foremost, I would like to thank my supervisor, Dr. Rob
Stodilka. Whenever I ran into a problem, big or small, he was always there to guide
me through it. Moreover, despite remaining mindful of the challenges imposed by my
tight timeline, Rob still granted me a great deal of independence, encouraging me to
pursue the problems that interested me. This not only made my entire Ph.D. lots of
fun, but was indispensable in building my confidence as a young scientist. So thank
you Rob for all you’ve done; you are ever an inspiration to me.
Next, I would like to thank my advisory committee members, Dr. Frank Prato,
Dr. Terry Thompson, and Dr. Ian Cunningham. At our first meeting, you were all
very kind and encouraging, which was exactly what I needed as a nervous student just
starting his project. By the time our second meeting came about, I thought I knew
much more than I had before, and entered with a swagger. Within ten minutes, my
cocksure attitude has dissipated, and by the time I departed I was an empty, broken
shell of a man. There’s nothing like an advisory committee to teach humility, and I
got that lesson in spades. But, as before, it was exactly what I needed. It taught me
to be cautious in my assertions, prudent in my claims, and wary of my assumptions,
qualities that have served me well ever since (especially in subsequent committee
meetings). In all seriousness though, thank you for your insightful comments and
understanding of what a thesis should be.
Additionally, though he did not sit on my advisory committee, Jean Th´eberge
played just as important a role in my work. Whether he was revising manuscripts,
helping plan experiments, or conveying some aspect of his vast knowledge of MRI,
Jean has been helping me since the beginning, and for that I am very grateful.
And speaking of MRI, I would not have been able to conduct any of my
experi-ments without John Butler. Not only did he teach me how to use the Verio, he spent
countless hours helping me fiddle with pulse sequences to get them working properly.
Further, he was kind enough to run the scanner whenever I required patient data.
His professional demeanour clearly put them at ease, and made collecting data for
Chapter 4 a pleasure.
The other key piece of imaging equipment I required was, of course, the PET/CT.
I owe a great debt to Jenn Hadway, Dr. Aaron So, and Dr. Steve Ross, all of whom
altruistically imparted their expertise regarding the operation of the Discovery VCT.
A special thank you to Jenn for tolerating my many, many emails to the effect of
“Can I use the PET/CT tonight?”.
With respect to PET/CT skills, however, I did not hold a candle to the nuclear
medicine techs, Don Kuhl, Ben Reyes, Gina Iacobelli, Karen Keys, Peter Masters,
Paul Sery, and Jessica Wall. Not only did they patiently endure my frequent questions
and missteps, they were responsible for all the patient PET/CT data in Chapter 4.
Incidentally, I would not have been able to recruit any patients for my study if not
for Lindsay Douglas and Tracy Zurbrigg, the masters of the nuclear medicine front
desk. Lindsay, thank you for organizing and mailing that endless stream of letters of
intent, and Tracy, thank you for allowing me to sit next to you as I lay in wait for
my next unsuspecting victim.
tise Lela Deans, Jane Sykes, and Terrie Ann Campbell that these experiments were
made possible. They deftly navigated the complex, obtuse world of animal use
proto-cols, and were nothing short of exceptional when handling the canines, which in one
case involved the swift administration of propofol to a dog who was awaking in the
PET/CT, followed by cardiopulmonary resuscitation when that same dog crashed in
the MRI. Thanks to the vet techs’ unmatched talent, the dog was just fine.
I would also like to thank my lab for their support. Eric Sabondjian, Omar
El-Sherif, and John Patrick have been outstanding colleagues and collaborators. It was
Eric who taught me the ins and outs of working with γ-ray emitters, as well as how
to operate the SPECT/CT. I always felt I could turn to him when I was stuck, a
bit like an older brother. If Eric was like an older brother, then Omar was more like
a twin sibling. Our similar ages, academic stages, and interests made him an ideal
person to commiserate with over the trials and tribulations of graduate school, though
I’m glad we got to celebrate its benefits on the tropical sands of Hawai’i and in the
frigid air of Sweden. Finally, despite his seniority in a strict chronological sense, I
believe that initially I was to John as Eric was to me. Now, having passed on all
the information I have, it remains an absolute pleasure to speak with John about
MRI-based attenuation correction, amongst life’s other points of interest.
Numerous others have helped shape this project, be it through discussion,
plan-ning, revision, or otherwise. In particular, I would be remiss not to acknowledge Dr.
William Pavlosky, Dr. Gerry Wisenberg, Dr. David Laidley, Dr. Irina Rachinsky,
Dr. Jean-Luc Urbain, Dr. James White, Dr. Donna Goldhawk, Dr. Kim Blackwood,
and Dr. Jodi Miller. Additionally, thank you to Brenda Dubois, Michele Avon, and
Shelagh Ross for assisting me with all things administrative.
Also, I cannot in good faith fail to state my appreciation for my peers (and former
Michael Berger, Dr. Matt Lanktree, and Dr. Piya Lahiry have all served as mentors,
helping guide me through the program. I am equally grateful for my other
brothers-and sisters-in-arms, perhaps especially Pencilla Lang, one of the few M.D./Ph.D.
students who shares the frustrations of working in medical imaging. Finally, without
the outstanding (former) leadership of Dr. Jim Lewis and administrative gifts of
the seemingly omniscient Vicki Vanstrien, our program would not exist at all, and
Western would be worse for it.
But for all the aptitude, intelligence, emotional support, and goodwill on Earth,
no research would ever get done without money. For their generous financial
contri-butions, I would like to thank my sources of funding, including the Natural Sciences
and Engineering Research Council of Canada, the Canada Foundation for
Innova-tion, the Canadian Institutes of Health Research, the Ontario Research Fund, and
Multi-Magnetics Incorporated.
In closing, I wish to thank those closest to me, for without them I surely would
have gone mad a few months in. Nate and Kate Denig, Chris Rennick, and Sandra
Rohfrietsch, thank you for being the best friends I could have asked for. I hope that
in the years and decades to come, that never changes. Mom, thank you for supporting
me not just through my Ph.D., but through my whole life prior. You and Dad have
been tremendous parents to me since the very beginning. And last but certainly not
least, to my wife Laura, thank you for everything: for your love, devotion, patience,
and kindness. Thank you for helping me rise early and get to bed at a reasonable
hour, thank you for interrupting my work with your hugs and lovely smile, and thank
you for rescuing me from my dearth of common sense. But most of all, thank you for
giving a simple nerd a beautiful life.
Certificate of Examination ii
Abstract iii
Co-Authorship v
Dedication vii
Acknowledgments viii
Contents xii
List of Tables xvi
List of Figures xvii
List of Appendices xix
Nomenclature xx
1 A Bird’s Eye Perspective of Attenuation Correction in PET/MRI 1
1.1 Introduction . . . 1
1.2 The Value of Quantitative PET/MRI . . . 4
1.2.1 Oncology . . . 4
1.2.2 Neurology . . . 7
1.2.3 Cardiology . . . 10
1.3 Factors Influencing Quantification . . . 14
1.3.1 PET Physics Primer . . . 14
1.3.2 Physical Factors. . . 20
1.3.2.1 Photon Statistics . . . 20
1.3.2.2 Spatial Resolution and the Partial Volume Effect . . 23
1.3.2.3 Observed Radiopharmaceutical Distribution . . . 27
1.3.3 Biological Factors . . . 28
1.3.4 Technical Factors . . . 31
1.3.4.1 Image Reconstruction . . . 31
1.3.5 Human Factors . . . 38
1.4 Attenuation Correction . . . 39
1.4.1 Definition of Attenuation . . . 39
1.4.2 How Attenuation Is Corrected . . . 46
1.4.3 How the µ-Map Is Obtained . . . 47
1.4.3.1 Transmission Scan Primer . . . 47
1.4.3.2 Without a Transmission Scan . . . 48
1.4.3.3 Geometric Considerations for Transmission Scans . . 51
1.4.3.4 Energy Considerations for Transmission Scans . . . . 54
1.4.3.5 Problems Specific to X-ray CT Transmission Scans . 57 1.5 MRI-Based Attenuation Correction . . . 58
1.5.1 Relation to Transmission Scans . . . 58
1.5.2 MRI to µ-Map Conversion . . . 60
1.5.2.1 By Segmentation . . . 60
1.5.2.2 By Registration . . . 64
1.5.2.3 By Mapping. . . 65
1.5.3 Ongoing Problems and Future Work . . . 68
1.6 Conclusions . . . 72
References . . . 74
2 A Comparison of MRI-Based Attenuation Correction in PET Versus SPECT 95 2.1 Introduction . . . 95
2.2 Imaging Protocol . . . 97
2.2.1 Animals . . . 97
2.2.2 Phantom. . . 98
2.2.3 PET/CT. . . 98
2.2.4 SPECT/CT . . . 99
2.2.5 MRI . . . 99
2.3 Image Processing . . . 100
2.3.1 µ-Map Generation . . . 100
2.3.1.1 CT-Based . . . 100
2.3.1.2 MRI-Based . . . 100
2.3.2 Registration . . . 102
2.4 Assessment of MRI-Based AC Quality . . . 103
2.4.1 Error Analysis. . . 103
2.4.1.1 Global . . . 103
2.4.1.2 Local . . . 104
2.4.2 Sensitivity Analysis . . . 104
2.5 Results . . . 106
2.6 Discussion . . . 112
3 Variable Lung Density Consideration in Attenuation Correction of
Whole-Body PET/MRI 124
3.1 Introduction . . . 124
3.2 Materials and Methods . . . 125
3.2.1 Experimental Protocol . . . 125
3.2.2 Subjects . . . 127
3.2.3 Imaging . . . 127
3.2.4 Image Registration . . . 129
3.2.5 Image Segmentation . . . 129
3.2.6 Quantitative Analysis. . . 130
3.3 Results . . . 132
3.4 Discussion . . . 141
3.5 Conclusion . . . 145
References . . . 146
4 To Segment, Register, or Map? A Comparison of Three MRI-Based Attenuation Correction Methods for Whole-Body PET 150 4.1 Introduction . . . 150
4.2 Materials and Methods . . . 151
4.2.1 Data Acquisition . . . 151
4.2.2 MRI-Based µ-Maps from Segmentation . . . 153
4.2.3 MRI-Based µ-Maps from Registration . . . 155
4.2.4 MRI-Based µ-Maps from Mapping . . . 155
4.2.5 Processing the MRI-Based µ-Maps . . . 156
4.2.6 Data Analysis . . . 157
4.3 Results . . . 158
4.3.1 Overview . . . 158
4.3.2 Global . . . 158
4.3.3 Local . . . 164
4.4 Discussion . . . 166
4.4.1 Overview . . . 166
4.4.2 Lungs . . . 166
4.4.3 Fat . . . 167
4.4.4 Water . . . 167
4.4.5 Bone . . . 168
4.4.6 Lesions. . . 169
4.4.7 Hybrid Approaches . . . 169
4.4.8 Errors from Image Registration . . . 170
4.5 Conclusion . . . 171
References . . . 172
5.1.1 Where We Stand . . . 175
5.1.2 Where To Go . . . 175
5.2 MRI-Based AC in the Lungs . . . 177
5.2.1 Where We Stand . . . 177
5.2.2 Where To Go . . . 178
5.3 MRI-Based AC Algorithms. . . 179
5.3.1 Where We Stand . . . 179
5.3.2 Where To Go . . . 180
5.4 Conclusion . . . 182
References . . . 183
A Ethics Approvals 189
B Copyright Releases 192
C Curriculum Vitae 195
1.1 Physical factors that impact quantification . . . 21
1.2 Biological factors that impact quantification . . . 29
1.3 Technical factors that impact quantification . . . 32
1.4 Human factors that impact quantification . . . 40
1.5 Obtaining aµ-map without a transmission scan . . . 49
1.6 Transmission scan geometries . . . 51
1.7 Transmission scan energies . . . 55
1.8 Future work . . . 69
2.1 µ-coefficients assigned to materials . . . 101
2.2 Results of global error analysis on canines . . . 110
2.3 Results of global error analysis on phantom. . . 110
2.4 Results of local error analysis on canines . . . 111
2.5 Results of local error analysis on phantom . . . 112
3.1 ANOVA results . . . 134
3.2 Results of local error analysis . . . 140
4.1 Global error analysis two-way ANOVA results . . . 163
4.2 Global error analysis one-way ANOVA results . . . 164
4.3 Local error analysis one-way ANOVA results . . . 165
1.1 PET/CT and PET/MRI . . . 3
1.2 Lines of response . . . 16
1.3 Dominant photon/matter interactions. . . 19
1.4 Realistic line of response . . . 25
1.5 Impact of detector size on LOR localization . . . 26
1.6 Ill-conditioned PET . . . 35
1.7 Attenuation measurement . . . 41
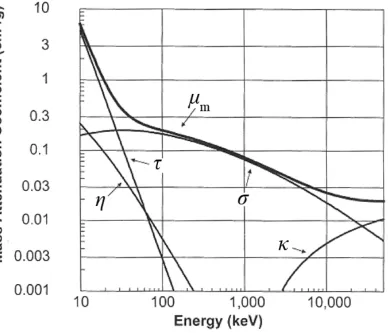
1.8 Components ofµm over a range of energies . . . 44
1.9 Transmission scan geometries . . . 53
1.10 Segmented MRI-based µ-map . . . 62
1.11 Registered MRI-based µ-map . . . 65
1.12 Mapped MRI-based µ-map . . . 67
2.1 VOI placement . . . 105
2.2 Example of an MRI-basedµ-map . . . 106
2.3 Comparison of canine SPECT and PET reconstructions . . . 108
2.4 Comparison of phantom SPECT and PET reconstructions . . . 109
2.5 Comparison of SPECT and PET scatter plots . . . 109
2.6 Example of PET sensitivity to MRI-basedµ-map . . . 113
2.7 Example of SPECT sensitivity to MRI-based µ-map. . . 114
3.1 VOI placement . . . 131
3.2 T2* and proton density versus CT signal . . . 133
3.3 Spatial correlation of lung signal in CT versus MRI . . . 134
3.4 MRI to CT lung mappings . . . 135
3.5 Pre-µ-maps of the lungs . . . 136
3.6 Results of global error analysis. . . 137
3.7 Profiles through sample PET reconstructions . . . 138
4.1 Sampleµ-maps and associated errors . . . 159
4.2 Results of global error analysis. . . 160
4.3 Results of local error analysis . . . 161
4.4 Joint histogram of lung signal in CT versus MRI. . . 162
Ethics Approvals 189
Copyright Releases 192
Curriculum Vitae 195
a Mean activity per unit time
~a Actual activity at each voxel of PET image
¯
ae Mean estimated activity
¯
at Mean true activity
AC Attenuation correction
b Y-intercept of LOBF
c Speed of light
CT Computed tomography
CTclin Clinical quality CT
CTpre-µ CT precursor to µ-map
D Training data for SVM
df Degrees of freedom
E Energy or error, depending on context
F F-statistic
FDG 18F-fluorodeoxyglucose
FRC Functional residual capacity
I Photon beam intensity after attenuation
I0 Initial photon beam intensity
ITK Insight Segmentation and Registration Toolkit
k(xi,xj) Kernel function
L Length of material attenuating photon beam
LOBF Line of best fit
LOR Line of response
m Slope of LOBF or mass, depending on context
MIBI 99mTc-sestamibi
MRI Magnetic resonance imaging
MRIlung MRI of the lungs
MRIlungPD Proton density map of the lungs
MRIlungSTE Short echo time MRI of the lungs
MRIlungT∗2 T2* map of the lungs
MRIWB MRI of whole body
N Number of photons detected per unit time
P PET system matrix
p Probability of a type-1 error
p(·) Probability of ·
PET Positron emission tomography
PETCT PET via CT-based µ-map
PETglobal PET via MRI-based µ-map with global lung estimate
PETmap PET via mapped MRI-based µ-map
PETMRI PET via MRI-based µ-map
PETMRIdb PET via MRI-based µ-map with dilated body
PETMRIdl PET via MRI-based µ-map with eroded body
PETMRIeb PET via MRI-based µ-map with dilated lungs
PETMRIel PET via MRI-based µ-map with eroded lungs
PETMRI0 PET via unadulterated MRI-basedµ-map
PETnone PET without AC
PETreg PET via registered MRI-basedµ-map
PETset PET via segmented MRI-based µ-map
PETseg(number) PET via segmented MRI-based µ-map with bones assigned to (number)
PETslices PET via MRI-based µ-map with slice-by-slice lung estimate
PETvoxels PET via MRI-based µ-map with voxel-by-voxel lung estimate
PET(number) PET via MRI-based µ-map with lungs assigned to (number)
PIP Positive inspiratory pressure
q Dimension of SVM feature space
r Radial cylindrical coordinate
~r Position in 3D space
RF Radio frequency
R2 Pearson product-moment correlation coefficient
s Position along photon beam
SNR Signal-to-noise ratio
SPECT Single photon emission computed tomography
SPECTCT SPECT via CT-based µ-map
SPECTMRI SPECT via MRI-based µ-map
SPECTMRIdb SPECT via MRI-based µ-map with dilated body
SPECTMRIdl SPECT via MRI-based µ-map with eroded body
SPECTMRIeb SPECT via MRI-based µ-map with dilated lungs
SPECTMRIel SPECT via MRI-based µ-map with eroded lungs
SPECTMRI0 SPECT via unadulterated MRI-based µ-map
SPECTnone SPECT image without AC
SUV Standardized uptake value
SVM Support vector machine
TE Echo time
T2 Spin-spin relaxation time
T2* Spin-spin relaxation time with local magnetic field inhomogeneities
ui Class membership in SVM
UTE Ultrashort TE
VOI Volume of interest
xi True normalized PET activity
xi Feature vector for SVM
yi Estimated normalized PET activity
Z Atomic number
z Longitudinal cylindrical coordinate
α Maximal acceptable probability of type-1 error
β Standard deviation of Gaussian radial basis function
∆I Change in photon beam intensity
Degree of sphericity
η Part of mass attenuation coefficient due to coherent scattering
θ Azimuthal cylindrical coordinate
κ Part of mass attenuation coefficient due to pair production
µ Linear attenuation coefficient
µm Mass attenuation coefficient
µ-coefficient Attenuation coefficient
µ-map Attenuation map
ρ Density
σ Part of mass attenuation coefficient due to Compton scattering
τ Part of mass attenuation coefficient due to photoelectric effect
φ(xi) Mapping implicitly applied by k
2D Two-dimensional
3D Three-dimensional
Chapter 1
A Bird’s Eye Perspective of Attenuation
Correction in PET/MRI
1.1
Introduction
One of the most intriguing aspects of positron emission tomography (PET) is its
fundamentally quantitative nature. That is to say, given a patient with a
radiophar-maceutical on board, the activity distribution can be expressed in absolute terms, e.g.
MBq/mL. This capability, considering PET’s capacity to image a variety of molecular
biological processes, makes PET an extraordinarily powerful tool.
However, creating quantitatively accurate PET images is not trivial. Several
factors can adversely impact quantification and years of research have been devoted
to addressing them. The most important cause of quantification error is photon
attenuation, a phenomenon wherein γ-rays emitted from the radiopharmaceutical
interact with the patient’s body and thus remain undetected. One can compensate for
attenuation provided an attenuation map (µ-map) is available. Aµ-map is an image
of the patient that is composed of attenuation coefficients (µ-coefficients), values that
indicate how likely a photon/matter interaction is to occur at a specified position.
Conversely, cortical bone has a highµ-coefficient as it impedes many photons incident
upon it. The most straightforward way of obtaining a µ-map is to transmit photons
through the patient and record the fraction that makes it through to the other side. By
repeating this from different angles around the patient, a tomographic reconstruction
of the µ-map is generated. There are many variations on the theme, but the general
principle remains the same. For this reason, virtually every PET scanner has some
form of transmission imaging system built in, the most common today being X-ray
computed tomography (CT), i.e. PET/CT.
While combining PET and CT is useful from the point of view of attenuation
correction (AC), another major motivating factor is that the modalities yield
com-plimentary information: CT provides an anatomical context for the functional PET
images. A similar line of reasoning led to the conception of another hybrid modality
combining PET with magnetic resonance imaging (MRI), i.e. PET/MRI. Like CT,
MRI can produce anatomical images, but with improved soft tissue contrast (albeit
with poor delineation of bones). In addition, image contrast in MRI can be altered,
highlighting different structures and pathologies. MRI also boasts multiple functional
imaging options including blood oxygen level dependent effects, blood flow, perfusion,
diffusion, and chemical shift imaging [140]. What’s more, this is done without
expos-ing the patient to ionizexpos-ing radiation. Researchers have been aware of these advantages
for some time, and accordingly, work began on PET/MRI in the late 1990s [162,188]
preceding the completion of PET/CT [19]. That said, the first human simultaneous
PET/MRI images were not published until much later [182]. The delay was caused in
part by a temporary shift in interest away from PET/MRI owing to the remarkable
success of PET/CT, but also because of the technical difficulties associated with
plac-ing PET and MRI systems in close proximity without compromisplac-ing the performance
by Pichler et al [163]. It is thanks to their combined efforts that PET/MRI is now a
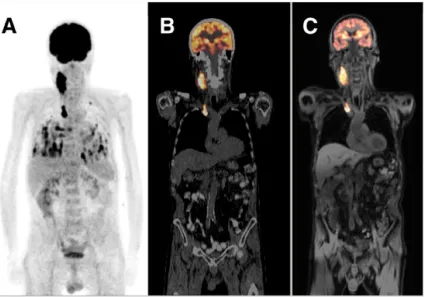
reality. Both a PET/CT and PET/MRI image are presented in Figure 1.1
Figure 1.1: (A) Whole-body PET scan displayed as a maximum intensity projection, (B) PET/CT overlay (PET is in orange), and (C) PET/MRI overlay (PET is in orange). All images are of the same patient and were acquired on the same day. Oncologic lesions suspected of being malignant are visible in the PET scan in the neck, chest, and lungs. Adapted from Drzezgaet al [54].
There remains an unresolved issue, however: it is difficult to obtain a µ-map.
In simultaneous PET/MRI scanners physical space is limited and costs are high, so
including an integrated or attached transmission imaging system is not feasible [221].
Further, obtaining a transmission scan from a separate machine (e.g. a detached
CT) is not viable because the patient would have to move from the PET/MRI to the
transmission system, resulting in differences in positioning that may produce severe
derive theµ-map from MRI images. But in MRI, signal is dictated primarily by proton
density and magnetic relaxation times, i.e. T1, T2, and T2* [140]. Unfortunately,
these parameters are not easily relatable to µ-coefficients. Thus, MRI-based AC of
PET images is an open and challenging problem that must be solved if PET/MRI is
ever to be a quantitative imaging modality.
In this chapter, I examine the issue of MRI-based AC in detail. First, I discuss
the value of quantitative PET with respect to PET/MRI. Next, I catalogue and
explain the major factors that impact quantification in PET images to provide a
broader context for the role that photon attenuation plays. I subsequently focus
on AC and how it has been conducted historically, complete with the advantages
and disadvantages of each method. I then explain how MRI-based AC is conducted,
describing three general approaches to the problem. Finally, I identify unresolved
problems and suggest avenues for further research.
1.2
The Value of Quantitative PET/MRI
1.2.1
Oncology
By far, the most common clinical application of PET is imaging cancers, altering
management in 36.5% of cases overall [84]. PET’s adoption in this arena owes to
one radiopharmaceutical, 2-deoxy-2-(18F)fluoro-D-glucose, commonly referred to as
18F-fluorodeoxyglucose or FDG. A glucose analog, FDG enters the glycolysis
chem-ical pathway as would regular glucose, but stalls after phosphorylation to
FDG-6-phosphate due to its absent 2’ hydroxyl group. Consequently, FDG preferentially
accumulates in cells exhibiting high metabolic activity. As glycolysis is upregulated
in most cancers [63], FDG PET may be used to visualize malignancies. An
cancers [57, 97, 174, 213]. Indeed, staging is likely to play a part in the clinical role
of PET/MRI [5].
However, accurate quantification is generally not essential for staging; the
appear-ance of cappear-ancerous hot spots is sufficient to localize the disease. In fact, there is some
evidence that, with respect to lesion detection in FDG PET, there is no benefit to
performing AC at all [104]. In other words, AC is not always necessary for qualitative
aspects of PET image interpretation. However, oftentimes it is valuable to quantify a
tumour’s FDG uptake, an impossibility without AC. For example, the lesion’s degree
of FDG uptake has been associated with the cancer’s aggressiveness and the patient’s
prognosis [12, 15, 155]. Perhaps even more interesting, multiple studies indicate that
after the initiation of a chemotherapeutic regimen, declining levels of FDG uptake
from baseline correlate with the treatment’s efficacy [2, 175, 179]. This may have
tremendous implications for drug development, i.e. in deciding which candidate
ther-apies should be advanced to large-scale, phase III clinical trials [211]. Further, the
ability to predict an anti-cancer drug’s efficacy on a patient-by-patient basis yields
exciting possibilities for personalized medicine.
The rationale for accurate quantification in oncological PET imaging is well
estab-lished, but how does PET/MRI fit in? In particular, when is quantitative PET/MRI
more appropriate than quantitative PET/CT? One likely scenario is for brain
tu-mours. MRI is widely accepted as the modality of choice in neuro-oncology. This
is because of MRI’s excellent anatomical delineation of intracranial masses—often
correlating with histological features and clinical behaviour [81]—and its functional
imaging options. For instance, magnetic resonance spectroscopy (MRS) has
demon-strated utility in several applications such as grading [164], biopsy site selection [44],
and differentiating progressive disease from radiation necrosis [173] while both
planning [147, 185]. Like MRI, PET provides a wealth of information about brain
tumours. Interestingly, in neuro-oncology, FDG is not the radiopharmaceutical of
choice due to an inherently low contrast to noise ratio caused by strong uptake in
healthy gray matter [216]. But using alternate radiopharmaceuticals such as
O-(2-[18F]fluoroethyl)-L-tyrosine, the addition of PET to MRI has demonstrated potential,
including the determination of tumour extent [158] and in radiation treatment
plan-ning [148] amongst other applications [21]. With special pertinence to quantitative
PET, PET/MRI may prove a powerful tool for assessing treatment response [50, 94].
Although the field is young and there is still much speculation, the first clinical
stud-ies evaluating the use of simultaneous PET/MRI in neuro-oncology are beginning to
emerge, and the initial results are encouraging [26].
PET/MRI’s role in clinical oncology will not likely be confined to the brain,
how-ever. For example, CT does not play a major role in breast cancer imaging whereas
there is extensive interest in MRI as it is the most sensitive modality for
identify-ing local extent of the disease, although it suffers from low specificity [14]. Thus,
PET/MRI is a more natural fit for breast cancer than PET/CT, assuming of course
that PET adds value to the study. Indeed, PET has been shown to be useful for
predicting response to neoadjuvant chemotherapy [179, 187], which may be
synergis-tic to treatment response information provided by MRI [35,100,156,165] and MRS
[137].
Another area that quantitative PET/MRI may find application outside the brain
is in imaging neoplasms that occur primarily during childhood. CT is a significant
source of radiation (about 15 mSv for an adult, whole-body, diagnostic quality scan),
often more so than the radiopharmaceutical itself (about 7 mSv) [28]. Further,
ra-diation exposure can be increased as CT scanners are pushed to image faster and
pop-ulation [101]. If PET is indicated in a child with cancer, it would be better if both
the anatomical localization and AC was performed with MRI, provided of course the
CT is not serving an important clinical function. A good example would be in the
initial evaluation of soft tissue sarcomas, where MRI is often the modality of choice
for visualizing the primary lesion [48] and quantitative PET may be useful for grading
and predicting malignancy [12].
The preceding discussion is by no means comprehensive; many possible
oncolog-ical applications of quantitative PET/MRI have been omitted. Rather, the select
examples above should serve as an indication that PET/MRI may have an important
role to play in evaluating a significant subset of cancers.
1.2.2
Neurology
As mentioned earlier in the context of brain tumours, PET/MRI can generate a
wealth of information, both anatomical and functional, regarding the central nervous
system. Of course, diseases of the brain are not limited to neoplasms; in this section,
the prospect of using quantitative PET/MRI to improve the management of some
additional cerebral pathologies is explored. In particular, I touch on Alzheimer’s
disease, ischemic stroke, and epilepsy.
Alzheimer’s disease is an excellent example of a pathology that is well suited to
imaging with PET/MRI. In routine medical practice the diagnosis of Alzheimer’s is
essentially a clinical one, though anatomic MRI is often indicated as well, largely to
exclude other pathologies [116]. This is problematic in that a diagnosis cannot be
made until relatively severe and likely irreversible cortical damage has accrued.
How-ever, significant advances in the understanding of Alzheimer’s pathogenesis indicate
that a sequence of measurable changes begin well before dementia occurs. Further,
the order is given by 1)β-amyloid accumulation in the cortex, 2) tau mediated
neu-ronal injury, 3) brain atrophy, 4) memory loss, and finally 5) impaired clinical function
[99]. Many of these biomarkers can be detected via imaging, which is important as
they follow characteristic spatial patterns. For instance, it is well established that
PET can be used to detect β-amyloid burden [96], while both PET and MRI can
indirectly measure neuronal damage via reduced metabolism [102, 172] and cerebral
atrophy [22], respectively. Making use of these techniques has the potential to permit
early diagnosis and accurate staging of Alzheimer’s [99], and there are ongoing
ef-forts to incorporate them into diagnostic criteria [55]. Indeed, PET and MRI provide
complimentary information in Alzheimer’s [98, 192], while their hybridization bears
technical benefits such as MRI-guided partial volume effect correction of the PET
images [202].
However, without quantification, PET’s ability to characterize Alzheimer’s disease
is limited to observing the presence or absence of biomarkers. With quantification,
PET can determine how much biomarker is present, compare concentrations between
different regions of the brain, and track changes over time, all of which are likely
clinically relevant [99, 192]. Furthermore, PET has shown promise for therapeutic
monitoring in Alzheimer’s [170], another application that demands proper
quantifi-cation.
In ischemic stroke, the concept of the penumbra is of great interest. Simply put,
the penumbra comprises a region of brain tissue surrounding the necrotic core that
exhibits impaired function owing to hypoxia induced by hypoperfusion, but remains
salvageable provided perfusion is restored quickly [7]. From a clinical standpoint,
“quickly” has been found to be within 4.5 hours of the ischemic insult, meaning that
thrombolytic therapy with tissue plasminogen activator is generally indicated prior to
rate; penumbral tissue has been documented even 16 hours post-insult in humans,
suggesting that in some cases the therapeutic window should be extended [11].
The penumbra can be visualized with MRI by collecting both diffusion weighted
and perfusion weighted images, the former identifying the necrotic core and the latter
localizing perfusion deficits [10]. The penumbra is seen as the mismatch between the
perfusion and diffusion lesions. Accordingly, several clinical trials have evaluated the
use of MRI in selecting patients eligible for tissue plasminogen activator
administra-tion beyond the tradiadministra-tional therapeutic window, but results have been disappointing
[53,139]. One of the potential problems is that MRI exhibits inaccuracies identifying
the true penumbra and necrotic core [80]. PET, conversely, is recognized as the gold
standard for the detecting the penumbra and infarcted tissue [11], but is not used
in clinical practice because the exam is logistically complex. The immediate role for
PET/MRI in stroke is likely not in the management of individual patients, but in the
validation of improved MRI protocols to better delineate the penumbra [215]. This is
a situation wherein the simultaneity of data collection is pivotal considering the
rela-tively fast dynamics involved. Additionally, the PET images should be quantitative,
as they must enumerate the degree of hypoperfusion in the penumbra for the MRI to
be checked against.
In the future, PET/MRI may prove more directly useful in stroke, such as for
localizing thrombi with dual probes [207]. Also, given the potential neuroprotective
strategies [135] that have been proposed on the basis of the evolving concept of
multi-ple “molecular” penumbras [189], PET/MRI may play a major role in the evaluation
of novel stroke therapeutics.
Finally, PET/MRI might prove helpful in a subset of focal epilepsy cases that
remain uncontrolled despite the administration of antiepileptic drugs. Under these
epileptogenic focus [195]. Said focus is generally identified as a lesion on anatomical
MRI, the modality of choice for surgical planning in epilepsy [56]. However, a lesion is
not always apparent on MRI, and in such cases additional imaging with PET (which
visualizes the epileptic focus as an area of reduced cerebral metabolism using FDG)
is both helpful [125, 176, 214] and cost-effective [151]. Generally, one identifies an
area of reduced cerebral uptake by comparison to the contralateral side of the brain.
If the PET images are not quantitative, there is no guarantee of symmetry, especially
if the patient’s head is tilted with respect to the scanner. What’s more, without
quantification, the decreased uptake might itself be obscured.
PET appears especially useful for surgical planning if coregistered with MRI [125,
176], a task for which simultaneous PET/MRI is the gold standard. Beyond this
clinical application, sophisticated PET radiopharmaceuticals and MRI protocols make
PET/MRI well suited for exploring epilepsy’s pathophysiology [56, 121, 169].
There are numerous applications of PET/MRI to neurology and neuroscience that
are not mentioned above, several of which are reviewed elsewhere [21, 79,83, 141].
1.2.3
Cardiology
There are already several modalities and protocols available to the clinician to
eval-uate cardiac function, so the addition of PET/MRI to the list of options may seem
superfluous. However, this hybrid platform has the potential to have a significant
clinical impact, as evidenced by the following example.
Coronary heart disease is responsible for approximately 1 of every 6 deaths in
the United States [127]. In coronary heart disease, plaques in the coronary arteries
restrict blood flow to regions of the heart, which, if severe enough, will lead to
car-diac dysfunction. One of the important clinical issues is to determine if dysfunctional
compromised because of reduced blood flow. Myocardial cells can exhibit reduced or
absent contractility but remain viable; such cells are known as either “hibernating”
[167] or “stunned” [111] depending on the length of the ischemic insult, but appear
similarly dysfunctional. There is evidence from several retrospective studies that
patients with dysfunctional yet viable myocardium are more likely to benefit from
revascularization procedures such as percutaneous transluminal coronary angioplasty
or coronary artery bypass grafting than patients without salvageable myocardial tissue
[34, 181]. This observation motivated three prospective randomized controlled trials
assessing whether cardiac viability imaging for treatment selection improves patient
outcomes [13, 25, 38]. The results of all three trials were negative, but with some
major caveats. The outcome of a clinical trial studying a test for guiding therapy
depends not only on the accuracy of the test itself, but also upon clinicians’ adherence
to the test result and the efficacy of the treatments. Indeed, in the PET and
Recov-ery Following Revascularization-2 (PARR-2) trial, adherence to viability test-based
recommendations was only 75.4% [13]. It was found that in the subgroup of patients
where revascularization decisions were based on PET viability testing, imaging was
associated with improved outcomes (death, myocardial infarction, and heart failure).
Further, in some patients, medical management may provide comparable outcomes
as would be achieved with surgical intervention [160]. There is evidence that
via-bility imaging may be useful in optimizing treatment within the subpopulation of
sickest patients where surgical risk is highest [13]. So, despite the apparent negative
outcomes of the trials, there may be a place for viability assessment for treatment
selection in some patient groups. Further randomized trials are currently underway
that will adopt a more rigorous, test-guided approach to revascularization decisions
to try and confirm the results seen in the PARR-2 adherence patients. Regardless of
it is an excellent prognostic indicator [25].
For the reasons discussed above, determining cardiac viability remains a key issue
in patients with coronary heart disease. Viability can be assessed with several imaging
modalities including single photon emission computed tomography (SPECT),
dobu-tamine echocardiography, PET, and MRI [203]. However, no single modality has
emerged as the most accurate test [181]. Since the tests assess viability through
dif-fering mechanisms, it may be that they are complimentary rather than competitive.
For instance, in PET, both cardiac perfusion and glucose metabolism scans are
as-sessed; areas of reduced perfusion and increased glycolysis are predictive of viable
tissue at risk of death [204] since the myocardium switches from primarily fatty acid
to glucose metabolism when ischemic [144]. Areas of altered perfusion and glycolysis
cannot be reliably identified unless the PET images are quantitative, nor can the
degree of aberration be assessed. MRI, in comparison to PET, can provide
infor-mation about viability in alternate ways [177]. For instance, several minutes after
injection with a contrast agent called Gadolinium diethylene triamine pentaacetic
acid (usually referred to as Gd-DTPA), infarcted tissue can be reliably identified as it
enhances (sequesters the tracer) more than viable tissue due to altered cellularity and
clearance kinetics [105, 203]. Therefore, MRI is assessing the extent of irreversibly
injured scar, with the inference that dysfunctional myocardium that is not scar is
viable. Another approach is to acquire MRI images of the beating heart at baseline
and after the administration of dobutamine, a sympathomimetic drug, to identify
wall motion abnormalities; this test is similar to dobutamine echocardiography but
provides a high-resolution volume dataset and can incorporate myocardial tagging
to improve wall motion assessment [120]. Viable myocardium will respond to the
inotropic stimulus of dobutamine with improved contractility whereas dead tissue
MRI, an unprecedentedly comprehensive picture of myocardial status should be
at-tainable. Further, a detailed anatomical context provided by MRI will be available to
facilitate the interpretation of PET. In fact, the resolution and signal-to-noise ratio
(SNR) of the PET images themselves can be improved by virtue of MRI’s ability to
correct for cardiac and respiratory motion [52,72]. Considering all these advantages,
PET/MRI may well provide the most accurate means available to noninvasively assess
myocardial viability. However, it will need to be demonstrated that enhanced
diag-nostic accuracy translates into improved patient outcomes assessed in well designed
randomized clinical trials.
Beyond myocardial viability assessment, PET/MRI bears some exciting prospects
for cardiovascular imaging. Briefly, one of the most intriguing is the localization
and characterization of atherosclerotic plaques. Magnetic resonance angiography is
a popular method to identify luminal stenoses throughout the body (e.g. carotid
arteries, peripheral vasculature, and even coronary arteries), but it provides limited
information about the plaque itself. A means to examine the plaque could enable the
clinician to estimate the risk of rupture if it can identify an inflammatory component
which often precedes acute events such as myocardial infarction. Both MRI [205] and
PET [152] have demonstrated potential on this front, with numerous applications such
as stroke prevention [206], therapeutic monitoring and drug development [152], and
the early diagnosis of atherosclerosis [178]. There is a multitude of other possibilities
for PET/MRI in cardiovascular imaging, and the reader is referred elsewhere for
1.3
Factors Influencing Quantification
1.3.1
PET Physics Primer
The basic premise underlying PET image formation is relatively simple, but as with
most things, the devil is in the details. I will begin with a simplified explanation of
how PET works and subsequently catalogue the physical (§1.3.2), biological (§1.3.3), technical (§1.3.4), and human (§1.3.5) factors that limit the system’s performance, elaborating on salient details as required.
Essentially, PET’s purpose is to determine the location and magnitude of
physi-ological processes in the body. Given a process of interest (e.g. glucose metabolism
or perfusion), a chemical probe that targets said process is introduced into the body.
After a period known as the uptake time, the probe will have distributed itself within
the body in approximate proportion to the physiological process. PET is merely a
clever means of inferring where the probe went. The trick is that the probe is bound
to a radioactive element; PET uses the radiation to determine where the nucleus that
released it must have been. It is for this reason that the probe is generally referred
to as a radiopharmaceutical or radiotracer.
For PET to work, the radioactive nucleus must decay by a process known as
positron emission, wherein one of the radionuclide’s protons is converted to a neutron
via the expulsion of a positron and a neutrino. The neutrino is unimportant in PET,
but the positron is critical. Once released, it will collide with its antiparticle (the
electron) and annihilate, generating a pair of photons in the process. In order to
conserve a net zero momentum, the photons travel in opposite directions, tracing out
a straight line. In a PET system, the subject is surrounded by a cylindrical array of
detectors tuned to identify these photons.
the photons will strike the detectors within a few nanoseconds of each other. So if a
pair of detectors is activated nanoseconds apart, the PET system assumes that the
photons that struck them must have originated from the same positron annihilation.
This is known as a “coincidence”. Moreover, since the photons travel along a straight
line, the positron annihilation must have occurred somewhere in between the two
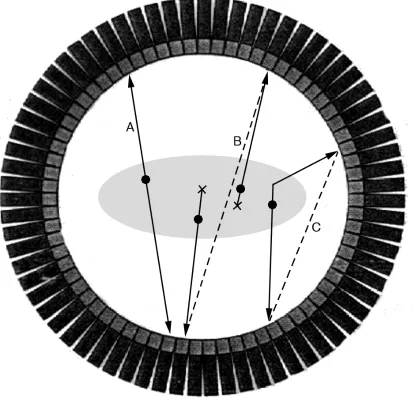
activated detectors. The imaginary line connecting a pair of activated detectors is
called the line of response, or LOR for short (Figure 1.2). Once many LORs have
been collected, they are input into a reconstruction algorithm, a mathematical model
that converts the raw data collected by the PET scanner into an image (details in
§1.3.4).
In theory, by computing the difference between the arrival times of the two photons
involved in a coincidence, one can determine where along the LOR the positron
annihilation occurred, improving the quality of data collected by the PET scanner.
This is termed time-of-flight, referring to the amount of time the photons travel for
prior to detection. In practice, time-of-flight requires that the PET system make
very accurate measurements of time, an ability characterized by a parameter called
timing resolution. No current PET system can localize annihilation events to a single
point (which requires a timing resolution of about 3 ps), but it is possible to localize
annihilations to a particular region along the LOR.
Unfortunately, whether using time-of-flight or not, sometimes the PET system
can detect false LORs, thereby deteriorating image quality. This can happen two
ways. First, suppose two positron annihilations occur within nanoseconds of each
other. Suppose further that one member of the photon pair from each annihilation
is lost somehow, for instance via attenuation (see §1.4.1) or passing through the detector without stopping. If the two remaining photons are detected, a false LOR
arise from the chance detection of two unrelated photons. Second, suppose that one
(or both) of the photons emitted from an annihilation is deflected prior to detection.
The resulting LOR will be deflected as well (Figure 1.2). LORs formed in this way
are known as “scatter”, its name derived from Compton scattering, the physical
process that deflects photons. Incidentally, all true LORs (i.e. created by an actual,
undeflected photon pair) are unsurprisingly called “trues”.
There is an additional feature of photon pairs arising from positron annihilation
that warrants explanation. Recall that mass and energy are equivalent according
to Einstein’s famous equation, E = mc2, where E is energy, m is mass, and c is the speed of light. Using this equation, one can show that the energy contained
in the mass of a positron is 511 keV. Similarly, as electrons have the same mass
as positrons, they also bear 511 keV of energy. Accordingly, when a positron and
electron collide and annihilate, the total energy released is 1022 keV. This is divided
equally between the photon pair, giving each 511 keV. Photons are the particles that
mediate electromagnetic radiation, and electromagnetic radiation with 511 keV of
energy falls into theγ-ray region. Hence, PET operates by detecting 511 keVγ-rays.
PET systems take advantage of the fact that photons derived from positron
anni-hilations have an initial energy of 511 keV. Recall that photons can be deflected prior
to detection giving rise to false LORs called scatter. The primary mechanism that
deflects photons at 511 keV is called Compton scattering, wherein the photon collides
with a bound electron and changes course. In the process, the photon transfers some
of its energy to the electron; the larger the angle of deflection, the more energy it
transfers. In short, deflected photons have energies below 511 keV. PET systems
capitalize on this phenomenon by measuring the energy of every photon they detect.
In principle, by rejecting coincidences wherein one or both photons have less than
cannot measure photon energy perfectly. Every measurement of energy is associated
with an error characterized by a parameter called energy resolution. Therefore, in
practice, PET systems will accept photons with energies in a predefined region around
511 keV, and reject those that fall outside this region. Said region is called the
accep-tance window. For reference, the accepaccep-tance window of most clinical PET scanners is
about 350 keV to 650 keV [92]. Thus, some scatter can be rejected, but a significant
proportion still falls within the acceptance window.
Finally, a word about photon attenuation. Attenuation and its correction are
discussed in detail in §1.4, but it for now, it will suffice to know how it arises. At-tenuation describes the phenomenon that some photons are “lost” prior to detection,
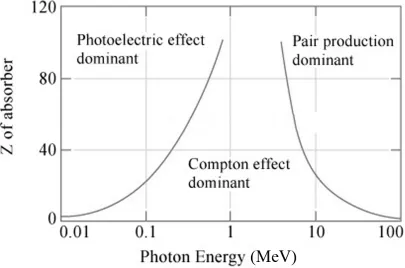
and therefore fail to generate a LOR at all. Photons can be lost three ways: 1)
by being absorbed by a bound electron via a mechanism called the photoelectric
ef-fect, 2) by undergoing Compton scattering to such a degree that the photon’s energy
loss excludes it from the acceptance window, and 3) by colliding with a nucleus and
transforming into a positron and electron, a process called pair production. At PET’s
energy, 511 keV, the photoelectric effect is negligible and pair production impossible
(the photon would require at least 1022 keV of energy to generate the mass contained
in a positron and electron). Hence, attenuation in PET is due almost exclusively to
Compton scattering (Figure1.3), creating an interesting relationship between
atten-uation and scatter. Specifically, all scattered photons should be deemed attenuated,
and thereby handled by attenuation correction algorithms. Unfortunately, due to
PET’s limited energy resolution, some scattered photons are able to generate false
1.3.2
Physical Factors
As described in§1.3.1, the goal in PET is to infer the underlying spatial distribution of a positron emitting substance that gives rise to measured electromagnetic radiation.
In broad terms, there are three mechanisms that deteriorate the ideal distribution:
the statistical nature of radioactive decay, positional uncertainty concerning the site
of positron emission, and biases in the detected radiation. Each will be discussed
in turn and the associated impact on quantification will be assessed. A summary of
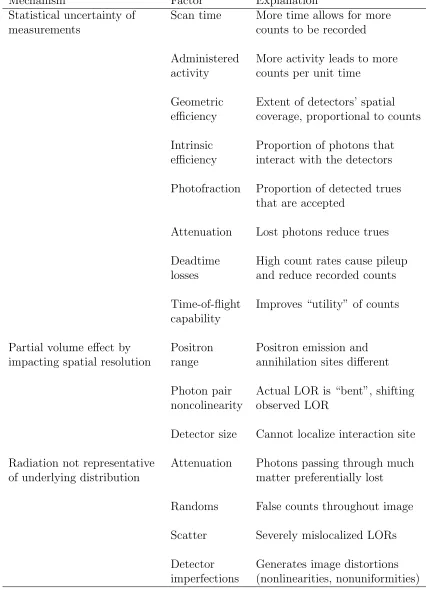
these factors is presented in Table 1.1
1.3.2.1 Photon Statistics
The inherently statistical nature of radioactive decay dictates that it is impossible
to recover the true underlying radiopharmaceutical distribution. Conceptually, the
problem can be illustrated with the following example. Imagine that there are two
identical radioactive sources resting inside two identical radiation detectors. The
detectors are both turned on for the same amount of time, and each records how
many photons are released from its radioactive source. Since radioactive decay is a
random process, the numbers will not be the same. There is therefore an inherent
uncertainty when attempting to determine “how radioactive” a source is.
This uncertainty can be described mathematically. Given a radioactive source
with mean activity per unit time a, the probability of recording N events (with a perfect detector) in a unit time follows a Poisson distribution,P(N;a) = (e−aaN)/N!.
The associated uncertainty of the measurement is 100%/√N. Thus, the fewer photons one detects, i.e. the lowerN, the more uncertain your estimate of the source’s activity. In PET, there are numerous factors that limit N. Some obvious ones include finite time available for the scan and the radiation safety limits dictating the maximum
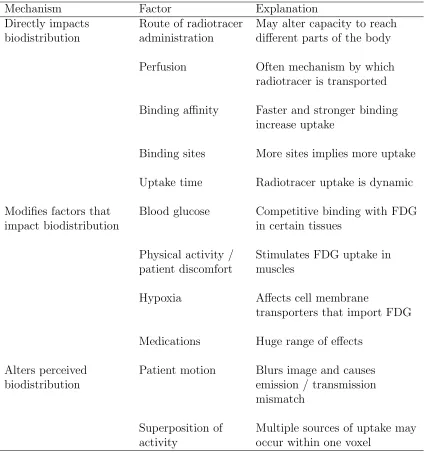
Table 1.1: Physical factors that impact quantification.
Mechanism Factor Explanation
Statistical uncertainty of measurements
Scan time More time allows for more counts to be recorded
Administered activity
More activity leads to more counts per unit time
Geometric efficiency
Extent of detectors’ spatial coverage, proportional to counts
Intrinsic efficiency
Proportion of photons that interact with the detectors
Photofraction Proportion of detected trues that are accepted
Attenuation Lost photons reduce trues
Deadtime losses
High count rates cause pileup and reduce recorded counts
Time-of-flight capability
Improves “utility” of counts
Partial volume effect by impacting spatial resolution
Positron range
Positron emission and annihilation sites different
Photon pair noncolinearity
Actual LOR is “bent”, shifting observed LOR
Detector size Cannot localize interaction site
Radiation not representative of underlying distribution
Attenuation Photons passing through much matter preferentially lost
Randoms False counts throughout image
Scatter Severely mislocalized LORs
Detector imperfections
There are four additional factors that reduce N: these are geometric efficiency, intrinsic efficiency, photofraction, and attenuation, and will be described in turn. As
the detectors do not completely surround the patient, only a fraction of total positron
annihilations will produce radiation incident on the detectors. This fraction is the
ge-ometric efficiency. Further, the detectors themselves are imperfect and only interact
with a fraction of the photons incident upon them, i.e. the intrinsic efficiency.
Unfor-tunately, even if a photon/detector interaction does occur, sometimes it still does not
register. This occurs if the photon does not deposit sufficient energy in the detector
to land in the acceptance window. Such events are indistinguishable from scatter
and are erroneously rejected. The proportion of trues interacting with the detectors
thatdo fall in the acceptance window is the photofraction. Finally, attenuatedγ-rays
either never make it to the detectors or fall beneath the acceptance window, further
decreasing the number of available trues. Ultimately, the net sensitivity of the system
for trues can be expressed as the product of geometric efficiency, intrinsic efficiency,
photofraction, and a factor accounting for losses due to attenuation.
But beyond the PET system’s net sensitivity, an even greater proportion of trues
are lost when there is a high rate of coincidences (also called a high count rate). These
are called dead time losses, stemming from limitations in the PET photon counting
system. Specifically, every time a photon interacts with a detector, a pulse is created
in the associated electronics. If two photons interact with the same detector one
immediately after the other, the electronic pulses will overlap, summing to one big
pulse. This is aptly named pulse pileup, and will result in the loss of at least one
of the two photons since the PET system only “sees” one pulse. Worse, the height
of the pulse is used to infer the incident photon’s energy; the bigger the pulse, the
higher the energy. If the summed pulse borne of the two photons is large enough, it
The shortest time between two pulses wherein the PET scanner can still resolve both
pulses is known as the dead time. A shorter deadtime results is less pileup and fewer
deadtime losses.
In short, considering all the factors the reduce N, only a relatively small, finite number of positron decays are ever detected, fundamentally limiting the reliability of
quantification. Interestingly, typical PET scans generally have less than one
coinci-dence event per LOR in a three-dimensional (3D) acquisition. Incidentally, a 3D
ac-quisition is one where all possible LORs are recorded, compared to a two-dimensional
(2D) acquisition where only LORs parallel to the axial plane are recorded.
1.3.2.2 Spatial Resolution and the Partial Volume Effect
Positional uncertainty regarding the site of positron emission degrades spatial
reso-lution, which in turn can cause severe quantification errors (i.e. > 50%) through a mechanism called the partial volume effect [194]. The partial volume effect impacts
small objects, in particular those more than two or three times smaller than the PET
system’s resolution. Essentially, since small objects cannot be properly resolved, their
activity is diffused over a larger area. Consequently, though the sum total activity
remains constant, the maximal activity is greatly reduced.
The ensuing commentary discusses the reasons that PET cannot perfectly localize
positron emissions, thereby limiting resolution and giving rise to quantification errors
via the partial volume effect. For simplicity, it is also assumed that only trues are
detected, ignoring false LORs (i.e. scatter and randoms).
Numerous issues prevent the precise localization of positron emissions. For one,
PET systems do not detect positron emission; they detect positron annihilation,
which occurs some distance away from the site of emission. This is because at
the proportion of kinetic energy given to the neutrino that is also produced in the
reaction. Since positron annihilation is more probable when the positron is moving
slowly (and hence has more time to interact with the electron), the positron generally
dissipates some of its initial kinetic energy in the form of a series of collisions prior
to annihilation. Thus, the positron effectively follows a random walk from the site of
emission prior to emitting the photon pair. The typical distance a positron travels
before it annihilates is called the positron range, and varies from one radionuclide to
another [37].
Further, the assumption that the coincident photons are emitted at 180◦ to one
another is false. The positron typically has a non-zero momentum at annihilation.
Therefore, according to the conservation of linear momentum, the two photons
pro-duced from the annihilation must have the same net momentum as the positron.
As velocity and momentum vectors are parallel, this implies the vector sum of the
photon velocities is nonzero. Of importance to PET imaging, this induces a slight
noncolinearity of 180◦±0.25◦ thereby mislocalizing the LOR. The effects of positron range and photon pair noncolinearity are illustrated in Figure 1.4.
More important than positron physics is the finite size of each detector, making
it impossible to know exactly where a given photon struck the device. There is
uncertainty with respect to LOR localization both in two directions parallel and the
one direction perpendicular the the detector face (Figure1.5. The latter case is known
as the depth-of interaction effect [92], referring to at what depth the photon interacts
with the detector.
Finally, a few words about time-of-flight information are warranted as it behaves
differently than the other factors that degrade resolution. Time-of-flight is not
nec-essary to reconstruct PET images, nor does it improve spatial resolution. Rather, by
more “useful” in determining the underlying distribution. Thus, a reconstruction
making use of time-of-flight can achieve the same image quality as one that does
not, but with fewer recorded counts [199]. In other words, time-of-flight boosts the
statistical power of a PET scan.
1.3.2.3 Observed Radiopharmaceutical Distribution
The last physical mechanism that undermines PET’s quantitative fidelity is that
detected radiation is not representative of the underlying radiopharmaceutical
dis-tribution. Attenuation [113], randoms [27], and scatter [223] are responsible for this
disconnect. Attenuation reduces the number of trues coming from the patient by
well over an order of magnitude, especially in regions where the photons must travel
through large amounts of matter to escape [113]. The result is a grossly
inaccu-rate image including, but not limited to, disproportionately low counts towards the
patient’s centre and seemingly “hot” lungs (since the lungs are mostly air and do
not interact with many photons). Randoms, in contrast, are detected by chance
es-sentially approximately uniformly over the entire field of view, posing as trues. In
whole-body imaging, randoms often exceed trues, resulting in substantial
overesti-mates of activity over the whole image in addition to deteriorating SNR with the
excess artifactual activity [27]. Finally, scatter neither removes trues nor adds
fal-lacious ones, but rather shifts the apparent LOR of a true to an incorrect location.
Typically, the result is a specious migration of activity from the edge of the patient
towards the centre. As with randoms, the amount of scatter can easily exceed the
number of trues in whole-body imaging with serious consequences for quantification
[223].
In addition to attenuation, randoms, and scatter, imperfections and geometrical