ABSTRACT
GUNCAVDI, SECIN. Transmitter Diversity and Multiuser Precoding for Rayleigh Fading Code Division Multiple Access Channels. (Under the direction of Alexandra-Duel-Hallen)
Transmitter diversity in the downlink for Code Division Multiple Access (CDMA) systems provides a means to achieve similar performance gains as for the mobile station (MS) receiver diversity without the complexity of a MS receiver antenna array. Transmitter based methods enable to shift signal processing to the transmitter where power and computational complexity are more abundant, thus simplifying receiver units. We examine feasibility of several transmitter diversity techniques for the Wideband CDMA (W-CDMA) systems. We also investigate an optimal method to combine transmitter diversity and precoding that achieves the gain of maximum ratio combining of all space and frequency diversity branches.
was shown that these methods are very effective in removing the MAI. Although these methods are powerful, they are high in complexity since MAI cancellation filters need to be updated continuously as fading coefficients vary. We propose a less complex method with similar performance improvements. In the proposed method, the functions of multipath combining and MAI cancellation are separated. Thus the MAI cancellation matrix does not depend on rapidly time-varying fading coefficients. Transmitter diversity and multiuser precoding can be combined to further improve the performance. Multiuser precoding preserves the multipath diversity while removing the MAI. Extending multiuser precoding to multiple antennas results in space diversity in addition to multipath diversity.
Both transmitter diversity and multiuser precoding require the knowledge of the channel state information (CSI). The CSI can be estimated at the receiver and sent to the transmitter via a feedback channel. To enable the studied adaptive techniques for practical systems, we employ the long range prediction (LRP) algorithm, which characterizes the fading channel using the autoregressive (AR) model and computes the Minimum Mean Squared Error (MMSE) estimate of a future fading coefficient sample based on a number of past observations.
To my family
BIOGRAPHY
Secin Guncavdi was born in Istanbul, Turkey on November 12, 1975. He graduated from Uskudar Science high school in 1993 and moved to Ankara. He received the Bachelor of Science degree in Electrical and Electronics Engineering from Bilkent University, Ankara, Turkey in June 1997. He started his graduate studies at North Carolina State University, Raleigh NC in Electrical and Computer Engineering Department in Fall 1997, where he was a teaching assistant. He became a research assistant in Spring 1998. He was a co-op at Analog Devices Inc., Greensboro, NC during the summer of 1998 and he received his Master of Science degree in Electrical Engineering in Spring 1999. He was enrolled in the Ph.D. program in Fall 1999 in the same department. Since then he has been a research and teaching assistant. He was the instructor of ECE 301 in Summer 2002 and ECE 331 in Spring 2003 in the Department of Electrical and Computer Engineering.
ACKNOWLEDGEMENTS
I would like to thank my advisor, Dr. Alexandra Duel-Hallen for her guidance, encouragement and support through my graduate studies. I appreciate her help in suggesting research topics, putting issues in perspective and refining my research.
I would also like to thank my committee members Dr. J. Keith Townsend, Dr. Brian L. Hughes and Dr. Hans Hallen for the helpful discussions and for serving as my committee.
Throughout this research, I have received encouragement and help from many friends. Their support and technical advice helped me become the person I am and they have a big part in my accomplishments. I would like to thank the following individuals for their various help: Lisa K. Miller, Dr. Hatice O. Ozturk, Ozdemir Akin, Dr. Mehmet C. Ozturk, Dr. Ayman El-Ezabi and Dr. Tugay Eyceoz.
I am grateful to the Center for Advanced Computing and Communications and the Department of Electrical and Computer Engineering Department at North Carolina State University, National Science Foundation and Analog Devices Inc. for their support of this work.
TABLE OF CONTENTS
LIST OF TABLES………viii
LIST OF FIGURES………....ix
1. INTRODUCTION………..……….1
1.1 Background……….…..……….1
1.2 Outline of the Thesis………..………...6
2. FADING MOBILE RADIO CHANNELS………..………..8
2.1 Fading Channel Characterization………..………...8
2.2 Flat Rayleigh Fading Channel……….………10
2.3 Jakes Model for Rayleigh Fading Channel……….11
2.4 Tapped-Delay-Line Model for Frequency-Selective Fading Channel………14
3. DIRECT SEQUENCE CODE DIVISON MULTIPLE ACCESS SYSTEM…………16
3.1 Synchronous DS/CDMA System Model………...….16
3.2 DS/CDMA Receiver Structures………..………20
3.2.1 The Conventional Detector for AWGN Channels……….….…………20
3.2.2 The Maximum-Likelihood Detector……….….……….21
3.2.3 The Decorrelating Detector for AWGN Channels………..…………22
3.2.4 The RAKE Receiver……….………..22
3.2.5 The Multipath Decorrelating Detector……….……..25
3.2.6 The RAKE Decorrelating Detector………27
3.3 Wideband CDMA (W-CDMA) System……….29
4. LONG RANGE PREDICTION OF RAYLEIGH FADING CHANNELS……….….38
4.1 Linear Mean Squared Error Prediction of the Rayleigh Fading Channels……….…38
4.2 Performance Bounds of Long Range Prediction………....42
5. TRANSMITTER DIVERSITY TECHNIQUES………44
5.1 Time-Switched Transmitter Diversity………46
5.2 Orthogonal Transmitter Diversity……….………..46
5.3 Selective Transmitter Diversity………..48
5.4 Transmit Antenna Array……….52
5.5 Pre-RAKE Transmitter Precoding………..56
5.6 Space-Time Pre-RAKE Transmitter Diversity Method (STPR)………59
5.7 Numerical and Simulation Results……….61
6. MULTIUSER PRECODING TECHNIQUES………69
6.1 Background of Multiuser Precoding………..69
6.1.1 Multiuser Precoding for AWGN Channels……….69
6.1.2 Multiuser Precoding for Flat Rayleigh Fading Channels………...74
6.1.3 Multiuser Precoding for Frequency-Selective Channels………76
6.1.3.1 Multiuser Precoding with the RAKE receiver………...…77
6.1.3.2 Multiuser Precoding without the RAKE receiver………..79
6.2 Pre-RAKE Multiuser Precoding for Frequency-Selective Channels…………...……81
6.2.1 Pre-RAKE Multiuser Precoding with CSI Dependent Decorrelation (Pre-RDD)………82
6.3 Space-Time Pre-RAKE Multiuser Precoding for Frequency-Selective Channels
(STPR MUP)………..90
6.4 Numerical and Simulation Results………...95
7. CONCLUSIONS AND SUMMARY………..104
BIBLIOGRAPHY………....108
APPENDIX A Theoretical Bit Error Rate of Selective Transmit Diversity………...…114
A.1 Flat Rayleigh Fading Channels………..114
LIST OF TABLES
LIST OF FIGURES
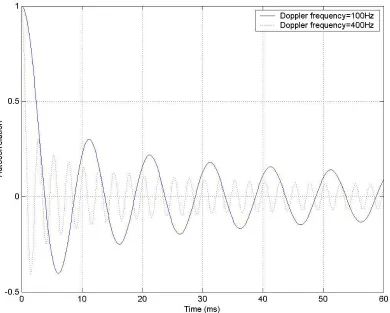
Figure 2.1 Typical signal fading for fdm=100Hz and fdm=400Hz………..12
Figure 2.2 Autocorrelation function of Rayleigh fading for fdm=100Hz and fdm=400Hz………..………..13
Figure 2.3 Tapped delay line model for frequency-selective fading channel………...15
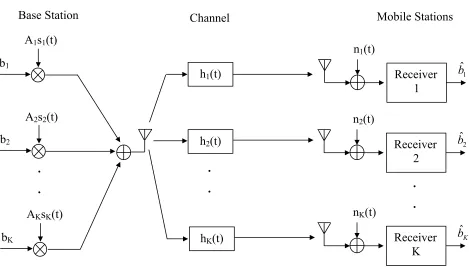
Figure 3.1 CDMA downlink system model with K users………….…………..………..17
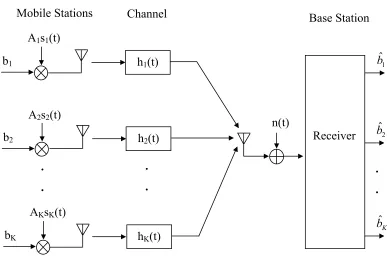
Figure 3.2 CDMA uplink system model with K users……….……..…………...18
Figure 3.3 RAKE receiver with MRC at the kth mobile station………24
Figure 3.4 Multipath Decorrelating Detector………..…………..25
Figure 3.5 RAKE Decorrelating Detector……….………27
Figure 3.6 Bit Error Rate for single antenna single user. Single, two and four path fading channels. fdm=200Hz, uncoded, 32 chip spreading. Normalized total channel powers.……….………33
Figure 3.7 Bit Error Rate for single antenna single user. Single, two and four path fading channels. fdm=200Hz, coded, 32 chip spreading……….…………34
Figure 3.8 Bit Error Rate of user 1 for single antenna. Two users, two paths. fdm=200Hz, uncoded, 16 chip spreading. A1/A2=1……….…….…35
Figure 3.9 Bit Error Rate of user 1 for single antenna. Four users, two paths. fdm=200Hz, uncoded, 8 chip spreading. A1/A2=1…….……….………..…36
Figure 4.1 Theoretical autocorrelation of the Rayleigh fading channel and the memory
span of the MMSE prediction for fdm=200 Hz……….41
Figure 4.2 BER of BPSK system with perfect vs. MMSE predicted CSI. Flat fading, single user, single antenna, uncoded………43
Figure 5.1 Time Switched Transmit Diversity………..46
Figure 5.2 Orthogonal Transmit Diversity………47
Figure 5.3 Orthogonal Transmit Diversity vs. Maximal Ratio Combining………..48
Figure 5.4 Selective Transmit Diversity………49
Figure 5.5 Flat fading Selective Transmit Diversity vs. Maximal Ratio Combining…...50
Figure 5.6 Frequency-selective STD vs. MRC and flat fading STD………51
Figure 5.7 Block diagram of Transmit Adaptive Array………52
Figure 5.8 Two antenna four path Tx AA vs MRC………...55
Figure 5.9 Block diagram of Pre-RAKE diversity………....57
Figure 5.10 Block diagram of Space-Time Pre-RAKE diversity combining………..60
Figure 5.11 Simulated performance and theoretical bounds for long range prediction, fdm=200Hz. Uncoded W-CDMA, Tx AA: 4 antennas, flat fading, STPR: 2 antennas, 4 paths………..65
Figure 5.12 Performance of the STD, flat fading channel, 2 transmitter antennas, fdm=200Hz, coded W-CDMA………..66
Figure 5.13 Comparison of STD, Tx AA and Space-time pre-RAKE, 2 transmitter antennas, 4 paths, fdm=200Hz. Coded W-CDMA………...67
Figure 6.1 BER of user 1 in AWGN Channel With and Without Precoding. 4 Users, uncoded…...……….73 Figure 6.2 BER of user 1 in flat fading channel with and without precoding. 4 users,
uncoded………75 Figure 6.3 Pre-RAKE Multiuser Precoding with CSI Dependent Decorrelation………..83 Figure 6.4 Pre-RAKE Multiuser Precoding with CSI Independent Decorrelation……...86 Figure 6.5 Block diagram of Space-Time Pre-RAKE multiuser precoding………..91 Figure 6.6 BER of user 1 in 2 path 8 users system with 16 chip spreading. Perfect CSI.
A1/A2=1………..100 Figure 6.7 BER of user 1 in 4 path 8 users system with 32 chip spreading. Perfect CSI.
A1/A2,3,4=1………..101 Figure 6.8 BER of user 1 in 2 antenna, 2 path, 2,8 user system.
Perfect CSI. A1/A2=1……….102 Figure 6.9 BER of user 1 in 2 path 2 users system with 8 chip spreading. A1/A2=1.
Chapter 1
Introduction
1.1 Background
For the past decade, the demand for personal communications services has been increasing dramatically. Wireless systems provide the most promising means of telecommunications. Currently, three channel access schemes are mostly considered: Frequency Division Multiple Access (FDMA), Time Division Multiple Access (TDMA) and Code Division Multiple Access (CDMA). There has been much interest in CDMA techniques as an alternative to both TDMA and FDMA methods in wireless communications systems. Among the advantages of CDMA is its ability to combat multipath fading of the radio link due to the frequency diversity offered by the wideband nature of its signal. CDMA offers potential capacity increases over the narrowband techniques. This capacity increase is mainly due to the fact that CDMA performance is interference-limited whereas narrowband systems are bandwidth-limited.
offers increased capacity and coverage, variable and high speed data rates, both packet and circuit switched services and multiple simultaneous services. W-CDMA supports Adaptive Antenna Arrays (AAA) by employing pilot symbols per connection in the downlink. The inclusion of the pilot symbols enables accurate estimation of the channels associated with each antenna at the mobiles, hence future channel state information (CSI) prediction via feedback.
Transmitter diversity in the downlink using multiple transmitter antennas provides similar performance gains as for the mobile station (MS) receiver diversity without the complexity of a second MS receiver antenna. Transmitter based methods enable to shift signal processing to the transmitter where power and computational complexity are more abundant, thus simplifying receiver units. It was shown in [23,29-38] that transmitter diversity at the base station (BS) will increase downlink capacity with only minor implementation at the mobile terminal implementation. Furthermore, in some cases, the complexity of the MS can be reduced by eliminating the RAKE receiver but still obtaining the multipath diversity via pre-RAKE filtering [29-31,37]. The proposed transmitter diversity techniques include Space-Time Coding [30], Delay Diversity, Orthogonal Transmit Diversity (OTD), Time-Switched Transmit Diversity (TSTD), Selective Transmit Diversity (STD), Transmit Adaptive Array (Tx AA) [31-34] and Space-Time pre-RAKE Transmitter Diversity (STPR) [31,37,48].
OTD) do not require feedback from the MS. For open-loop techniques, a pre-determined algorithm of antenna/coding usage is employed. For example, transmission is switched sequentially between N antennas at the rate of R for TSTD. Closed-loop techniques achieve better performance than the open-loop techniques, because the CSI enables more efficient use of the available power and spectrum. For example, in the case of the STD, the CSI is used to calculate the power of the channels associated with each antenna at the instant of transmission. Switching to the antenna with the highest channel power reduces fading and increases the received signal-to-noise ratio (SNR) at the MS.
Direct sequence CDMA (DS/CDMA) technology is designed to support simultaneous high data rate users. However under severe channel conditions (i.e. multipath), the multiple access interference (MAI) becomes the major source of performance degradation. This is because of the loss of orthogonality between the spreading codes used by each user due to the multipath channel effects. To overcome this problem, many receiver based multiuser detection (MUD) techniques have been proposed [4-13]. These techniques demand high computational complexity, power and knowledge of spreading codes of all users. As a result, in the downlink of a CDMA system it is not feasible to employ such methods at the MS.
pre-RAKE combining and MAI cancellation are separated. Thus the MAI cancellation matrix does not depend on rapidly time-varying fading coefficients.
Transmitter diversity and multiuser precoding can be combined to further improve performance. Multiuser precoding preserves the multipath diversity while removing the MAI. Extending multiuser precoding to multiple antennas results in space diversity in addition to multipath diversity [49].
To implement adaptive transmission and precoding methods in practice, the CSI for the upcoming transmission interval must be available at the transmitter. The CSI can be estimated the receiver and sent to the transmitter via a feedback channel. Thus, feedback delay and overhead, processing delay and practical constraints on modulation, coding and/or antenna switching rates have to be taken into account in the performance analysis of adaptive transmission methods. For very slow fading channels (pedestrian or low vehicle speeds), outdated CSI is sufficient for reliable adaptive transmission. However, for faster fading that corresponds to realistic mobile speeds, even small delay will cause significant degradation of performance since the channel variation increases with the mobile speed. As a result, the channel profile is quite different at the time of transmission when compared to the outdated CSI. To enable performance improvement using these adaptive methods, the CSI at the instant of transmission should be reliably predicted, based on the outdated CSI feedback from the mobile.
1.2 Outline of the Thesis
The goal of this thesis is to investigate and compare the performance of several transmitter diversity and multiuser detection/precoding methods for Rayleigh fading channels, with the application of LRP. The thesis outline is as follows:
Chapter 2 describes the multipath fading channels and the fading models. Flat and frequency-selective fading channels are introduced. Jakes and tapped delay line fading models are presented.
In Chapter 3, we introduce the DS/CDMA system and compare between the different multiuser receiver structures. We assume the synchronous model and describe the uplink and downlink system with K users and L-path frequency-selective fading. Then the CDMA receiver structures for single and multiuser systems with or without fading are presented. The chapter is concluded with the key characteristics of the W-CDMA system.
Chapter 4 describes the LRP algorithm. The principles of LRP are outlined. The application of LRP to W-CDMA systems is discussed and performance bounds associated with this algorithm are presented.
Chapter 2
Fading Mobile Radio Channels
2.1 Fading Channel Characterization
Fading is the rapid fluctuation of the amplitude of a radio signal over a short period of
time or travel distance [1,2]. Fading is caused by interference between two or more versions of the transmitted signal, which arrive at the receiver at slightly different times. These waves, called multipath waves, combine at the receiver antenna to give a resultant signal, which can vary
widely in amplitude and phase, depending on the distribution of the intensity and relative propagation time of the waves and the bandwidth of the transmitted channel. These multipath
signals are superposed either constructively or destructively at the receiver. Depending on the relation between the signal parameters (such as bandwidth, symbol period etc.) and the channel parameters (such as Doppler spread), different transmitted signals will undergo different types of
fading. Multipath in the radio channel causes:
• Rapid changes in signal strength over a small travel distance or time interval.
• Random frequency modulation due to varying Doppler shifts on different multipath signals and time.
• Time dispersion (echoes) caused by multipath propagation delays.
Due to the relative motion between the mobile station and the base station, each multipath wave experiences a shift in frequency called the Doppler shift given by [2]:
θ
θ cos
cos dm
c
n f
c v f
where fc is the carrier frequency, v is the vehicle speed, c is the speed of light, θ is the incident
radio wave angle with respect to the motion of the mobile and fdm is the maximum Doppler
frequency shift. The complex envelope of the flat fading signal at the receiver is:
∑
=
+
= N
n
t f j ne n
A t
c
1
) 2 ( )
( π φ (2.2)
where N is the number of scatterers, and for the nth scatterer, An is the amplitude, fn is the
Doppler frequency shift in (2.1), and φ is the phase. Doppler spread BD is a measure of the
spectral broadening caused by the time rate of change of the mobile radio channel and is defined as the range of frequencies over which the received Doppler spectrum is essentially non-zero. If the baseband signal bandwidth is much greater than BD, the effects of Doppler spread are
negligible at the receiver. Then this is a slow fading channel. Otherwise, the channel is a fast fading channel.
The bandwidth of the multipath channel can be quantified by the coherence bandwidth, which is related to the specific multipath structure of the channel. The coherence bandwidth is a measure of the maximum frequency difference for which signals are still strongly correlated in
amplitude. When the bandwidth of the channel is less than the coherence bandwidth, the received signal will undergo flat fading. The spectral characteristics of the transmitted signal are
preserved at the receiver, however the strength of the received signal changes in time. When the bandwidth of the channel is greater than the coherence bandwidth, the received signal will undergo frequency-selective fading. The received signal includes multiple versions of the
transmitted waveform, which are faded and delayed in time. Frequency-selective fading is due to time dispersion of the transmitted symbols within the channel. Thus the channel induces
2.2 Flat Rayleigh Fading Channel
There are several probability distributions that can be considered in attempting to model the statistical characteristics of the fading channel. When there is a large number of scatterers in
the channel that contribute to the signal at the receiver, application of the central limit theorem leads to a Gaussian process model for the channel impulse response [1-3]. If the process is zero
mean (no line of sight components), then the envelope of the channel response at any time instant has a Rayleigh probability distribution and the phase is uniformly distributed in the
interval (0,2π). The complex Gaussian fading coefficients are given by ,
where and are real Gaussian processes and the envelope is given by
) ( ) ( )
(t C t jC t
C = r + i
) (t
Cr Ci(t)
) t ( )
(t C2
r = C2(t)+ i
r . If the variance of Cr(t)and is Ci(t) σ
2, then the average channel power is
given by E
( )
C(t)2 =2σ2 and E(⋅)is the expectation operation.• The power spectrum density (PSD) of the random envelope is given by:
d d d f f f f f f ≤ − = Ψ , | | ) / ( 1 1 1 ) ( 2
π (2.3)
• The probability distribution function (PDF) is given by:
0 )
( 2/2 2
2 ≥
= r e− r
r
p r σ
σ (2.4)
• The PDF of the phase of the process is uniform.
π θ π θ = | |≤ 2 1 ) (
p (2.5)
• The autocorrelation functionR(τ)of the process is [3]:
) 2 ( )
(τ σ2 π τ
d o f
J
R = (2.6)
2.3 Jakes Model for Rayleigh Fading Channel
As described above, while the Rayleigh fading can be modeled as a complex Gaussian
process, it can also be approximated by the sum of a finite number of complex sinusoids. This technique was introduced by William Jake [3] for the simulation of fading mobile radio
channels. According to this model, the Gaussian process can be approximated by:
∑
=+
= N
n
t f
j dm n n e
N t
c
1
) cos 2 ( 2 )
( π α φ (2.7)
where N is the total number of plane waves arriving at uniformly spaced angles αn. Jakes model
is a stationary model that doesn’t take into account the change in the time varying factors such as the number and location of the scatterers, the vehicle speed and the acceleration etc. The model
assumes these factors stay constant. The shape of the autocorrelation of the generated fading process only depends on the number of the scatterers and the maximum Doppler shift. However, this stationary model is sufficient for applications at which the parameters don’t change
significantly over short time intervals. The number of sinusoids in the set must be large enough, so that the PDF of the resulting envelope provides an accurate approximation to the Rayleigh
PDF. In this thesis, nine-oscillator Jakes model is used to generate the Rayleigh fading channels in the simulations.
Typical signal fading power and autocorrelation functions are shown in Figures 2.1 and
2.2 for maximum Doppler shifts of 100Hz and 400Hz. Figure 2.1 is generated using nine-oscillator Jakes model and equation (2.6) is used for Figure 2.2. As seen in Figure 2.1, the power
The same conclusion could be drawn from Figure 2.2, where higher Doppler frequency results in a faster changing autocorrelation function.
2.4 Tapped-Delay-Line Model for Frequency Selective Fading Channel
For wideband transmissions, the multipath delay is often non-negligible relative to the
symbol interval. In this case, the received signal consists of several replicas of the same signal delayed with different durations. The number of resolvable multipath components depends on the bandwidth of the signal compared to the coherence bandwidth of the channel. CDMA
technology is designed to take advantage of this multipath channel and diversity is obtained. For the computations and the simulations provided in this thesis, we assume that each multipath
component of the channel fades independently and arrival delays occur at integer multiples of the chip rate of the CDMA signal. Each path is also assumed to have independent identically distributed (i.i.d.) Rayleigh fading characteristics.
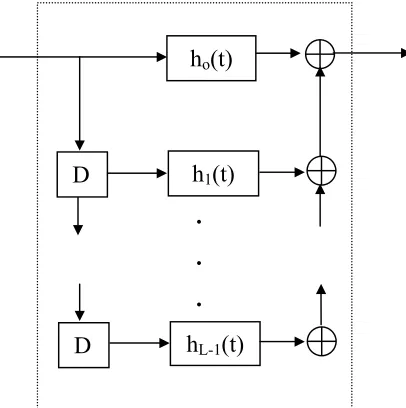
A frequency-selective channel can be modeled as a Finite Impulse Response (FIR) filter implemented with the tapped delay line (TDL) [1]. This TDL model consists of evenly spaced
tap coefficients, each representing one resolved multipath. To model the Rayleigh fading in the multipath channel, each tap coefficient has a complex valued gain with Rayleigh statistics. Tap coefficients are assumed to be fading independently, since the paths are i.i.d. A typical TDL
model is given in Figure 2.3. We assume that there are L resolvable paths and D represents a delay of Tc (the chip interval).
Based on this model, the impulse response of the channel is given by:
) (
)
( 1
0 c
L j j
jT t h t
h =
∑
− −=
where the impulse response of the jth path is given by hj(t)=hjδ(t)and is the complex
Gaussian fading coefficient corresponding to the j
j
h
th path.
D D
hL-1(t)
h1(t)
.
.
.
ho(t)Chapter 3
Direct Sequence Code Division Multiple Access System
In this chapter, we describe the Direct Sequence Code Division Multiple Access system
(DS/CDMA) and compare between the different multiuser receiver structures.
3.1 Synchronous DS/CDMA System Model
The synchronous assumption is often made to simply the analysis of CDMA detectors.
In most cases, the conclusions obtained for the synchronous case can be extended to the
asynchronous case. Throughout this thesis, the CDMA system of interest will be assumed a
synchronous DS/CDMA system for both the uplink and the downlink. In the downlink, the
spreading codes associated with each user are generated to be orthogonal to each other and the
transmission is synchronous. The uplink signal is often asynchronous in practice. However, in
this thesis we use the uplink model primarily for performance comparison with the proposed
downlink multiuser precoding methods, so the synchronous assumption is sufficient. For the
multipath DS/CDMA channel, the delay spread is on the order of several chip intervals, and
Tc<<Tb. Thus, ISI and the MAI due to adjacent symbol intervals are negligible. As a result, the
MAI and self-interference are due only to the effects of the multipath in the current symbol
interval.
In a CDMA system, each user is assigned a unique signature sequence (i.e. spreading
code/waveform) and all users transmit with the same carrier frequency. Let sk(t) denote the kth
user’s signature waveform. We assume that the signature waveforms are normalized and have
duration Tb, i.e. ( ) 1
0 2
=
∫
bT
i t dt
s . Let bk denote the information bit with amplitude Ak for the kth
that bk є {-1,1}. The passband energy of kth user’s bit is given by Ek=Ak2/2. Since the information
bit sequence for each user is assumed to be i.i.d. equiprobable and independent of other users, we
may consider only one bit interval without loss of generality. Assume we have K active users.
The downlink system model is given in Figure 3.1 and the uplink system model is given in
Figure 3.2. Additive White Gaussian Noise (AWGN) for the downlink is given by nk(t) k=1..K,
with variance No. We assume that nk(t) are i.i.d. The AWGN for the uplink is given by n(t) with
variance No.
Base Station Channel Mobile Stations
b1
1 ˆ
b
2 ˆ
b
K bˆ
.
.
Receiver K nK(t)
Receiver 2 n2(t)
Receiver 1 n1(t)
.
.
hK(t)
h2(t)
h1(t)
AKsK(t)
bK
.
.
A2s2(t)
b2
A1s1(t)
Mobile Stations Channel Base Station
A1s1(t)
b1 bˆ1
2 ˆ
b
K bˆ
.
.
n(t)
Receiver
.
.
hK(t)
h2(t)
h1(t)
AKsK(t)
bK
.
.
A2s2(t)
b2
First, consider the downlink system with K active users. Then the transmitted signal x(t)
at the BS in one bit interval will be:
∑
= = K k k k kb s tA t x 1 ) ( )
( (3.1)
Equation (3.1) can be expressed in vector notation as follows:
Ab sT t
x( )= (3.2)
where is the diagonal amplitudes matrix, b is the vector of the data
bits of K users, and is the vector of signature waveforms. Assume the AWGN
channel between the BS and each MS. Then the received signal at the k
KxK k A diag( ) = A = s T K b b.. ] [ 1 = T K t s t
s( ).. ( )] [ 1
th MS is given by:
) ( ) ( )
(t x t n t
rk = + k (3.3)
Consider extension of this model to the frequency-selective fading channel. If there are L
resolvable paths, the impulse response of the kth user’s channel is given by:
) ( ) ( 1 0 c L l kl
k t h t lT
h =
∑
− −= δ
(3.4)
where hklis the time varying complex Gaussian fading coefficient corresponding to the lth path of the kth user. The received signal at the kth MS is given by:
) ( ) ( ) ( 1 1 0 t n lT t s h b A t
r K k
j L l c j kl j j
k =
∑∑
− += −
=
(3.5)
Now consider the uplink system with K active users. The transmitted signal xk(t) at the
kth MS in one bit interval will be:
) ( )
(t Ab s t xk = k k k
(3.6)
Assuming the AWGN channel between the BS and each MS, the received signal at the
) ( ) ( )
( 1
t n t x t
r K k
k +
=
∑
=
(3.7)
If each channel between the BS and MS’s is frequency selective with L resolvable
multipath components as in (3.4), the received signal at the BS is:
1
K L−
) ( ) ( )
(
1 0
t n lT t s h b A t
r
k l
c k
kl k
k − +
=
∑∑
= =
(3.8)
3.2 DS/CDMA Receiver Structures
3.2.1 The Conventional Detector for AWGN Channels
The simplest form of detector is the conventional detector. To obtain the decision
statistics for the desired user, the received signal is filtered by a matched filter matched to the
signature waveform of the desired user and followed by a sampler.
Consider the received signal given in (3.3). The output of the filter matched to kth user’s
signature waveform at the kth MS, followed by the sampler is given by:
∫
=Tb k k
k r t s t dt y
0
) ( )
( k=1..K (3.9)
Combining K outputs into a single vector y=[y1(t) y2(t) . . yK(t)]T yields:
n RAb
y= + (3.10)
where R is the crosscorrelation matrix with elements Ri,j defined as:
∫
=Tb i j
j
i s t s t dt R
0
, ( ) ( ) k,j =1..K (3.11)
and nKx1 is a white Gaussian random vector with zero mean and covariance matrix IKNo, denoted
by where n~ N(0(K,1),IKNo) 0(K,1) is the vector of K zeros and IK is the KxK identity matrix.
Consider the received signal given in (3.7). The output vector of the bank of filters
matched to the users’ signature waveforms at the BS, followed by samplers is given by:
n RAb
y= + (3.12)
where . In this case, the filtered noise at the output of the matched filters is
colored since R is not an identity matrix. )
, (
~ N 0(K,1) RNo
n
The decision for the kth user is given by:
) sgn( ) ( ˆ
k k t y
b = (3.13)
In vector form, this equation is given by . The conventional detector, although
simple, performs poorly when a large number of users are active in the system, since the MAI is
treated as additive noise. Weaker users also suffer from the “near-far” problem, unless power
control is employed. The near-far problem arises when mobiles transmit at the same power but at
different distances from the BS. Due to different propagation losses, the transmissions can arrive
with very different received powers. The mobiles near the BS, which have high received signal
powers, greatly interfere with the distant mobile, which may not be detected. )
sgn(
ˆ y
b=
3.2.2 The Maximum-Likelihood Detector
The maximum-likelihood receiver gives the lowest achievable Bit Error Rate (BER) by
selecting the most likely vector b given the observations, which corresponds to maximizing the
likelihood metric [4]:
) 2
( max ˆ
} 1 , 1
{ y b b RAb
b
b
T T
K −
=
−
∈ (3.14)
It has been shown in [4] that the complexity of this detector is exponential in the number
of users. Therefore, alternative solutions have been proposed that approach the BER performance
3.2.3 The Decorrelating Detector for AWGN Channels
In [4], Lupas and Verdu propose a family of linear detectors whose complexity is also
linear in the number of users. Assume that the output of the bank of matched filters is given in
(3.12). The decorrelating detector uses the decision rule:
) sgn(
) sgn(
ˆ R 1y Ab R 1n
b= − = + − (3.15)
where R-1 is the inverse of the crosscorrelation matrix R. As seen in (3.15), the decorrelator
doesn’t require the knowledge of user energies, which provides near-far resistance. For the case
of unknown user energies, this decorrelator is equivalent to the maximum-likelihood detector [4].
The only requirement of the decorrelator is that the signature waveforms are linearly
independent, so that R is invertible. The MAI is eliminated at the expense of increased noise
power. The enhanced noise variance for the kth user is given by σk2=No(R-1)kk, where (R-1)kk is
the k,kth element of the matrix R-1. The probability of error associated with this receiver for user
k is given by:
= −
o kk k k
N A Q
P
)
( 1
2
R (3.16)
where Q(⋅)is the error function defined as
∫
∞ −
=
x
t dt
e
x 2/2
2 1 ) (
π
Q .
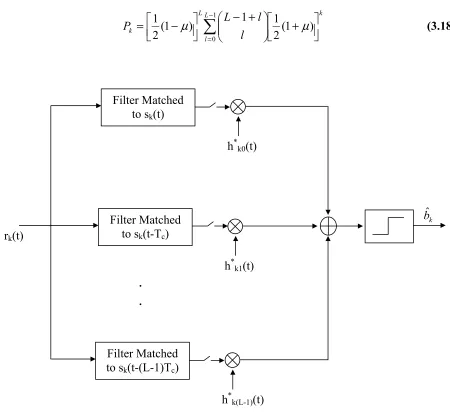
3.2.4 The RAKE Receiver
Assume that the users in a CDMA system experience frequency-selective fading. In this
case, time delayed versions of the original signal arrive at the receiver. A RAKE receiver
combines these time delayed signals in order to improve the signal to noise ratio (SNR) at the
receiver. The time-shifted versions of the original signal are collected by providing a separate
diversity receiver designed specifically for CDMA systems. It was shown that diversity
techniques can be used to improve the error performance of systems experiencing fading [1]. The
performance of the RAKE receiver is based on the design of the spreading sequences. Viewed in
the time domain, the multipath resistance properties are due to the fact that the delayed versions
of the transmitted signature waveform will have poor correlation with the original signature
waveform and will thus appear as another uncorrelated user, which is ignored by the receiver. In
a multiuser system, the multipath destroys the original orthogonality of the spreading sequences.
As a result, the performance of the RAKE receiver is limited by the cross-correlation of the
spreading sequences, as well as by the auto-correlation. The RAKE receiver utilizes multiple
correlators that are matched to a specific delayed version of the original signal. The outputs of
each correlator are weighted by the conjugate of the complex gain of the corresponding path.
Then the resulting signals are summed to achieve the decision metric. As a result, the received
signal is procesed in an optimum manner to collect the signal energy from all of the received
signal paths. The block diagram of the RAKE receiver at the kth MS is given in Figure 3.3.
We assume that there are K active users with L resolvable paths. The received signal is
given by equation (3.5). Assume that that the spreading waveform sk(t) of kth user has the ideal
autocorrelation, that is, E[(sk(t)sk(t-τ)]=0 when τ≠0. Furthermore, assume that there is no MAI
(i.e. Spreading waveforms and their delayed versions have zero cross-correlation). Then the
average SNR of the desired signal is given by:
0 1
0 2
N E h E SNR
k L
l
kl
=
∑
−
The BER performance of this ideal RAKE system is equivalent to the optimal diversity
case, i.e. Maximal Ratio Combining (MRC) with the order of L. The probability of error for the
kth user is given by [1]:
∑
−=
+
− +
−
= 1
0
) 1 ( 2 1 1 )
1 ( 2
1 L
l
k L
k
l l L
P µ µ (3.18)
Filter Matched to sk(t)
h*k0(t)
Filter Matched to sk(t-Tc)
h*k1(t)
k
bˆ
Filter Matched to sk(t-(L-1)Tc)
.
.
rk(t)
h*k(L-1)(t)
Figure 3.3 RAKE receiver with MRC at the kth mobile station
where
p p
γ γ
µ = +
1 and γpis the average SNR per path, which is assumed to be identical for all
) | (| 2 kl o k p N E h
E
=
γ (3.19)
As mentioned above, the multipath channel results in the loss of orthogonality between
the spreading waveforms and causes self-interference and MAI. To overcome this problem,
interference cancellation methods can be employed.
3.2.5 The Multipath Decorrelating Detector
This linear multiuser detector (MUD) proposed in [12], consists of a bank of filters
matched to delayed versions of the users’ signature waveforms followed by a linear
transformation that decorrelates the multipaths of each user. The decorrelated signals for a given
user are then whitened and optimally combined.
∫b T dt 0 ) ( ∫− + − c b c T L T T L dt ) 1 ( ) 1 ( ) ( ∫b T dt 0 ) ( ∫− + − c b c T L T T L dt ) 1 ( ) 1 ( ) ( 1 ˆ b K bˆ yKL yL+1 yL y1 . . Whitener& Combiner K Whitener& Combiner 1 R-1
r(t) .
.
. .
sK(t-(L-1)Tc) sK(t)
. .
s1(t-(L-1)Tc) s1(t)
This receiver is suboptimal but low-complexity. It alleviates the near-far problem while
preserving the multipath diversity gain. Performance loss is due to the zero-forcing nature of the
algorithm that increases with the number of paths. Refer to Figure 3.4 for the block diagram of
this demodulation technique. Since the knowledge of all users’ spreading waveforms is required,
this detector is suitable for the uplink. The received signal r(t) given in (3.8) is passed through a
bank of KL filters matched to the delayed signature waveforms of the users.
The outputs are sampled at the intervals Tb+lTc (l=0,..,L-1) and the resulting vector is given by:
T KLx KL y y1.. ] 1 [
= y
n RACb
y= + (3.20)
where, 1 .. 0 )] ( ).. ( [ )] ( ).. ( [ 1
1 = −
= +
∫
t t t t dt l LKLxKL lT T lT T K T T T K T c b c s s s s R (3.21)
[ 1 ( )... (T)] (3.22)
L K T
L A
A
diag 1 1
A=
KLxKL (3.23)
T K T t t diag([h1( )...h ( )])
C= T KLx T L K T L b
b1 ( )... ( )] 1
[ 1 1
b= (3.24)
) , (
~ N 0(KL,1) RNo
n (3.25)
where, T, , 1
c k
c k k
k(t)=[s (t)s (t−T )..s (t−(L−1)T)]
s T
L k k
k =[h,0..h, −1]
h (n) is a column of n ones,
0(m,n) is an mXn matrix of zeros. These samples are processed by the decorrelator R-1. The
resulting vector is y=ACb+n, where ( ,1), T o)
KL R− N
( ~ N
n 0 . We need to optimally combine
independently fading signals in correlated noise. The whitening filter for user k is
obtained through Cholesky decomposition
1
) ( H −
k T k H k T T = kk
-1. Maximal ratio combining is performed with h −1. The resulting decision metric is
k H kT
( )
[ ]
( ( 1) 1: )1 1 Lk k L H k k H
k − +
−
− T y
T
h . The bit error rate of user k associated with this decorrelator
conditioned on the fading coefficients is:
) k h j t
k( )=h
n Ab+ ) ( ( ) ( 1 ] [ 2 | o kk H k k k N A Q e P k M h h − = (3.26)
Averaging this error probability over the distribution of fading coefficients, we get:
∑
− = + − = 1 0 1 1 2 ) ( L j j j k e P γ γ β (3.27)whereγj =λjAk2/No,
j
λ are the distinct eigenvalues of the matrix (( ) 1)
] [kk − k M
Σ , is the
covariance of , and .
k
Σ
) (t
k
h βj =
∏
iL=−01,i≠jλj/(λj −λi)3.2.6 The RAKE Decorrelating Detector
This is a receiver based zero-forcing decorrelating technique proposed in [13]. It is based
on the general arguments given in [4-5] for a BPSK linear multiuser detector but the received
signal is matched to a bank of combined responses h T k t k K
ks ( ) =1.. . Refer to Figure 3.5
for the block diagram of this technique. The matched filter output vector can be written as:
R
y= (3.28)
) ( * 1 t h ∫b T dt 0 ) ( ∫b T dt 0 ) ( 1 ˆ b K bˆ ) ( * t hK 1 − R yK y1
r(t) .
.
where,
(
)
i j Kdt t h t h KxK j j i H i T j i j i b .. 1 , ) ( ) ( [, ] 0 *
, =
∫
= h R h =R (3.29)
R and hkare defined in the section above and is the i,j
k A ])
] , [i j
R th LxL block of R.
, b ,
KxK A
diag([ 1.. =
A
(
[ 1... ]T)
Kx1K b b
= n~ N(0(K,1),RNo). The decorrelator output is given by y=R−1y=Ab+n, where n~ N(0(K,1),R−1No). The instantaneous bit error rate of user k associated with this decorrelator conditioned on the fading coefficients is:
= − o kk k h k N A Q e P k ) ( ) ( 1 2 |
R (3.30)
To get the unconditional probability of error, (3.30) should be averaged over the
distribution of (R−1)kk, which will be presented with numerical results. This probability of error
is simply that of the conventional Gaussian channel BPSK detector operating in a single user
environment and whose SNR is scaled by 1/(R−1)kk. This is analogous to the noise enhancement
factor of a Gaussian MUD.
RDD requires the inversion of a KxK matrix, which is dependant on the channel
coefficients for each symbol interval. MDD requires a KLxKL matrix inversion, but the matrix is
not dependant on the channel and the inversion is performed only once. However, there is a
complexity-performance trade off between the methods. Although both methods are zero forcing
and suboptimal in the maximum likelihood sense and they don’t require the knowledge of user
energies, RDD provides the optimum performance over all linear multiuser detectors for
3.3 Wideband CDMA (W-CDMA) System
Wideband DS/CDMA is emerging as the predominant radio access technology for the
next-generation regional and global wireless standard. CDMA technology was introduced in US
with the IS-95 standard and this technology has paved the way for possible future deployment of
a more refined system.
The requirements for a future wireless communication system include:
• High quality service (e.g. toll quality speech, data services with BER less than 10-6).
• High data rate communication services and asymmetric data transmission.
• Support for both packet and circuit switched services, such as Internet traffic and video
conference.
• New charging mechanism, data volume vs. time.
• Higher network capacity, enhanced spectrum efficiency.
• Support for numerous and simultaneous connections.
The proposed W-CDMA system offers:
• Increased Capacity and Coverage:
W-CDMA uses wider channels (5 MHz-15 MHz). Wider bandwidth improves frequency
diversity effects, reduces fading. Coherent modulation in the uplink provides 2-3 dB
demodulation gain. Due to less fading, power control accuracy is improved. Fast power control
in both links combats fading effects and reduces average power level, increases capacity. Field
test results show that 5Mhz WCDMA carrier can handle up to 8 times more traffic compared to a
narrowband 1.25Mhz CDMA channel.
W-CDMA supports both low and high bit rates. Rates up to 384 kbps with full mobility
and 2 Mbps in local area supports different communication requirements from voice to
multimedia data. Variable data rates are achieved by using variable orthogonal spreading codes
and adaptation of the transmitted output power.
• Both Packet and Circuit Switched Services:
W-CDMA has an optimized packet mode. User pays only for the amount of data
transmitted. Both fast packets for infrequent packets and large or more frequent packets are
supported. This is important for remote LAN and wireless Internet access. High speed circuit
switched services for real time applications such as video conferencing are also supported.
• Multiple Simultaneous Services:
Each W-CDMA terminal can use several services such as be connected to LAN and
receive a voice call.
• Other System Improvements:
W-CDMA supports Adaptive Antenna Arrays (AAA) which gives possibility to use the
spectrum more efficiently and increases the capacity. W-CDMA uses pilot symbols per
connection in downlink that enables AAA. Base stations are not required to have GPS
synchronization since W-CDMA has an internal system for synchronization. W-CDMA supports
Hierarchical Cell Structures by introducing a new hand-off method between CDMA carriers
called Mobile Assisted Inter-Frequency Hand-off. The mobile stations scan numerous CDMA
carriers and enable the deployment of hot spot micro cells. W-CDMA also supports multiuser
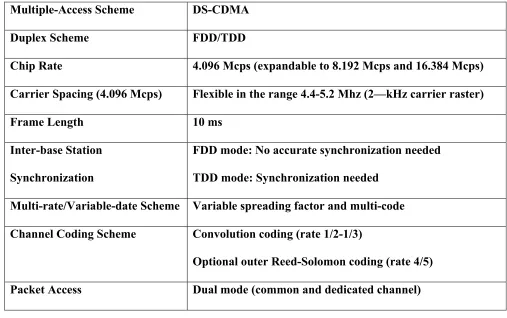
Key Technical Characteristics for UMTS α-concept:
Multiple-Access Scheme DS-CDMA
Duplex Scheme FDD/TDD
Chip Rate 4.096 Mcps (expandable to 8.192 Mcps and 16.384 Mcps)
Carrier Spacing (4.096 Mcps) Flexible in the range 4.4-5.2 Mhz (2—kHz carrier raster)
Frame Length 10 ms
Inter-base Station
Synchronization
FDD mode: No accurate synchronization needed
TDD mode: Synchronization needed
Multi-rate/Variable-date Scheme Variable spreading factor and multi-code
Channel Coding Scheme Convolution coding (rate 1/2-1/3)
Optional outer Reed-Solomon coding (rate 4/5)
Packet Access Dual mode (common and dedicated channel)
Table 1. Key characteristics of W-CDMA
System Description:
• Two physical channels: Data Channel and Control Channel.
• Convolutional coding only for BER=10-3 (standard).
• Additional outer Reed-Solomon coding for BER= 10-6 (high quality).
• Spreading with channelization codes with factors 4 to 256.
• Uplink scrambling with VL-Kasami sequences of length 256 for multi-user detection
receivers else with 10ms Gold code of length 241-1.
• QPSK with root-raised cosine pulse shaping filter.
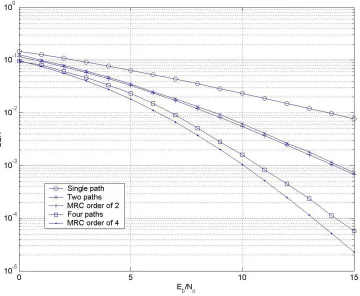
3.4 Simulation and Numerical Results
The Wideband CDMA system described in section 3.3 is used to evaluate the
performance of various receiver structures. The spreading codes are created using the orthogonal
tree structure. Simulation and numerical results are given in Figures 3.6-3.10. For all plots,
perfect CSI is assumed. MRC gives the optimal performance with the order of diversity equal to
the number of paths.
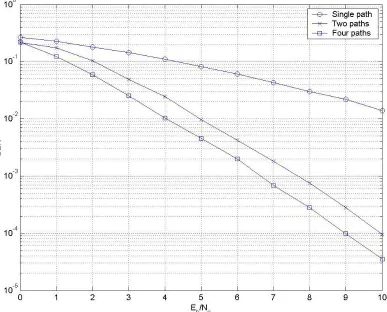
Figure 3.6 and 3.7 demonstrate the diversity achieved by employing the RAKE receiver
for a single user for two and four paths. As the number of paths increase, the BER performance
of the system improves. In Figure 3.7, coded results are plotted. For W-CDMA, half rate,
constraint length of nine convolutional coding is used. Decoding is performed using the Viterbi
algorithm. It is shown that coding improves the performance significantly.
Since the spreading waveforms used with W-CDMA are not ideal, introduction of other
users degrade the BER of all users. Besides the MAI, the multipath also destroys the
self-orthogonality of the spreading codes, resulting in ISI. The multiuser techniques introduced in
section 3.2 are used to remove the MAI and the results are given in Figures 3.8-3.10. It is
observed that these techniques improve the BER significantly.
The MAI depends on the number of users, number of paths, spreading factor and the
characteristics of the spreading codes. More users, more paths and small spreading factor
increase the MAI. The RAKE receiver does not remove the MAI, so its performance degrades
performance by removing the MAI. The resulting system approaches the optimal case of MRC.
RDD performs slightly better than MDD. As mentioned before, RDD is the optimal decorrelator
for the signals of unknown energy and MDD is suboptimal.
Figure 3.6 Bit Error Rate for single antenna single user. Single,
two and four path fading channels. fdm=200Hz, uncoded, 32 chip
Figure 3.7 Bit Error Rate for single antenna single user. Single, two and
Figure 3.8 Bit Error Rate of user 1 for single antenna. Two users,
Figure 3.9 Bit Error Rate of user 1 for single antenna. Four users, two
Figure 3.10 Bit Error Rate of user 1 for single antenna. Eight users, four
Chapter 4
Long Range Prediction of Rayleigh Fading Channels
As mentioned in the introduction, accurate knowledge of the future CSI is very
important in application of transmitter diversity and multiuser precoding techniques. These
methods (except OTD and TSTD) are closed-loop methods, i.e. they require feedback from
the receiver (MS). However, because of the time-varying nature of the channel, this feedback
is outdated when it arrives at the transmitter (BS). For very slow fading channels (pedestrian
or low vehicle speeds), outdated CSI is sufficient for reliable adaptive system design.
However, for faster fading that corresponds to realistic mobile speeds, even small delay will
cause significant degradation of performance since channel variation due to large Doppler
shifts usually results in a different channel at the time of transmission than at the time of
channel estimation. For W-CDMA channels, channel estimation at the MS is performed at
every slot (0.625 ms). Simulation results show that when the outdated CSI is used, significant
performance degradation occurs. The objective of the LRP is to forecast the future CSI of the
time-varying fading channel so that we can improve the performance of the diversity and
multiuser detection techniques.
4.1 Linear Minimum Mean Squared Error Prediction of the Rayleigh Fading Channels
Several adaptive channel estimation methods have been described in the literature
[14-17]. However, many of these techniques are better suited for very short range prediction
or require very large computational complexity. Thus, there is a need for adaptive, low
complexity, long range prediction technique that meets the accuracy requirements for
The LRP algorithm that is being employed to enable the techniques of interest in this
thesis have been extensively studied and developed in [18-24]. This algorithm characterizes
the fading channel using the autoregressive (AR) model and computes the Minimum Mean
Squared Error (MMSE) estimate of a future fading coefficient sample based on a number of
past observations. Assume we sample the channel at a rate , where ,
is the maximum Doppler shift. The channel is assumed to be complex Rayleigh fading
process c(t) as described in Chapter 2. Let . Our aim is to predict c
s s T f =1/
ij
R =
dm s f f ≥2
] * j n− dm f ) ( s
i c iT c =
[ *
i n n i E c c r = +
n based on p
(AR model order) previously observed channel samples cn-p,cn-p+1,…,cn-2,cn-1 . We compute
the (pxp) autocorrelation matrix R with coefficients and (px1)
autocorrelation vector r with coefficients . Then the minimum mean square
error prediction of c
[cn ic E −
]
n is :
(4.1)
∑
= − = p i i n i n d c c1
ˆ
where , i=1..p and . The observation interval can be significantly reduced
and matrix inversion can be avioded if adaptive long range prediction is used [24]. The
resulting MMSE is given by: }
{di
d = d =R−1r
∑
− = + − = 1 02] 1 ( )
| ) ( [| p i s ir jT d
e
E τ τ (4.2)
The superior performance of this algorithm relative to conventional methods is due its
low sampling rate (on the order of twice the maximum Doppler shift and much lower than
the data rate). Given a fixed model order, the lower rate results in longer memory span,
permitting prediction further in the future. The autocorrelation function
)] ( * ) ( [ )
(τ =E c t c t+τ
) 2 ( )
(τ Jo πfdmτ
r = (4.3)
where is the zero-order Bessel function of the first kind. This autocorrelation function
has large sidelobes. For a given model order p and sampling rate f )
(⋅
o J
(
r
s, the memory span is
defined as (p-1)/fs, which measures the observation interval used for prediction in (4.1). As
the sampling rate changes, the portion of the autocorrelation function captured by the
samples τ + jTs) changes. When the channel is sampled at a high rate, a small portion of the sidelobes is captured, resulting in high MMSE. However when the sampling rate is low,
the observation samples are spaced much further apart and result in a large memory span.
This keeps MMSE small and reliable prediction is achieved for long ranges.
The plot of the autocorrelation function for fdm=200Hz is given in Figure 4.1. For a
fixed model order, as the sampling frequency increases, the memory span decreases. For
example, it is observed from the figure that for p=50 and fs=16 kHz, the memory span is
3.0625 ms. The range of values of the autocorrelation function samples along this interval is
small. As τ increases (prediction far ahead), these autocorrelation values become small, and
MMSE increases. Now consider the case when p=50 and fs=1.6 khz. In this case, the memory
span is 30.625 ms. The autocorrelation values used in prediction vary significantly over this
interval. Due to the large sidelobes of the autocorrelation function, some of these values are
large enough to keep the MMSE from getting large and reliable long range prediction can be
achieved even when the prediction range is much greater than the coherence time τo
Figure 4.1 Theoretical autocorrelation of the Rayleigh fading channel and the memory span of the MMSE prediction for fdm=200 Hz.
For W-CDMA, the sampling rate fs is chosen as the slot rate of 1.6kHz. This results
in 0.625 ms delay for calculating the CSI. The prediction algorithm described above is used
to obtain predicted values of the current and future channel coeffients given the delayed
channel samples. The transmitter diversity and multiuser precoding methods, which will be
discussed in the following chapters, require the CSI. In most cases, predicting one step ahead
is not enough (e.g. STD 400Hz). Prediction algorithm estimates the CSI at the channel
sampling rate, however for some cases, CSI at the rate of the fading is required (e.g.
Space-Time pre-RAKE). In those cases, predicting several steps ahead and interpolation are
4.2 Performance Bounds of Long Range Prediction
To analyze the performance of the LRP algorithm in diversity systems, we apply
results of [40,41] as follows. The lower bound on the BER of a BPSK system with M i.i.d.
Rayleigh fading diversity branches, MRC combining and imperfect MMSE channel
estimates is:
∑
−=
− +
− +
−
= 1
0
, (1 )
2 1 1 )
1 ( 2
1 M
k
k
e M
e order
M
est k
k M
P
µ
µ
(4.4)where
p
e γ
µ
/ 1 1
1 +
Γ −
= and Γ is the normalized estimation error variance for each branch,
defined by:
} | {|
} | {|
2 2
i i c E
e E
=
Γ (4.5)
where ei=ci-ĉi and ĉi is the MMSE estimate of the branch weight ci. Figure 4.2 demonstrates
the BPSK BER for perfect vs. MMSE predicted CSI with single user, single path Rayleigh
fading. The Doppler shift is 200Hz, p=50, 200 samples are used in calculating the
autocorrelation function of cn. The data rate is 128 kbps and the channel sampling rate is 1.6
kHz. A delay of 0.625ms is assumed and three step prediction is performed. CSI at the data
rate is found by low-pass interpolation based on these predicted values. The estimation error
Γ is calculated from the simulation. The bound in the figure is found by evaluating equation
(4.4) with this Γ.
The key element in using the formulas above is to be able to have a good estimate of
the average error figure i.e. Γ. For the simulations of Chapter 5, Γ is obtained directly from
Practically the errors for different branches are different because of the finite simulation
interval. However averaging over all branches gives a good estimate of the prediction error.
Chapter 5
Transmitter Diversity Techniques
The uplink (from MS to BS) capacity of the CDMA systems can be enhanced by
various techniques including multi-antenna (diversity/antenna array) reception and multiuser
detection (MUD). The techniques that increase the downlink (from BS to MS) capacity have
not been developed with the same intensity. However, it is understood that the capacity
demand imposed by the projected data services (e.g. Internet) burdens more heavily the
downlink channel. Hence, it is important to find techniques that improve the capacity of the
downlink channel. Bearing in mind the strict complexity requirements of terminals, and the
characteristics of the downlink channel, an application of advanced detectors with multiple
receive antennas is not seen as the desired solution to the downlink capacity problem.
Transmitter diversity in the downlink using multiple transmitter antennas provides similar
performance gains as for the MS receiver diversity without the complexity of a second
receiver antenna. Transmitter based methods enable to shift signal processing to the
transmitter where power and computational complexity are more abundant, thus simplifying
receiver units. Different solutions have been proposed suggesting that multiple antennas (or
transmit diversity) at the BS will increase downlink capacity with only minor increase in
terminal implementation. CDMA technology is designed to exploit the multipath
characteristics of the channel. However, the RAKE receiver is required to achieve multipath
diversity gain. For the downlink, this requirement increases the complexity and power