V A L I D A T I O N OF D E C O N V O L U T I O N M E T H O D O L O G Y F O R SSI A N A L Y S E S
Jagdish Bhatt ~), Greg Mertz 2), Fredrick Loceff 2)1) Bechtel Savannah River Incorporated 2) Westinghouse Savannah River Company ABSTRACT
While performing Soil-Structure-Interaction (SSI) analyses, it is possible to overstrain the soil column when deconvolving broadened surface design spectra. Overstraining the soil can potentially overestimate the soil damping and underestimate the SSI frequency, which in turn could lead to erroneous structural response.
A case study is presented for a deep soil site that compares the high-strain soil properties for both convolved and deconvolved ground motions on a statistical basis. These results confirm that deconvolving of design surface time histories will overstrain the soil column resulting in larger soil damping and lower shear modulus, than if motions were convolved from bedrock. However, for the site studied, the variance in these high-strain soil properties due to convolution or deconvolution is not nearly as significant as the inherent variability in soil properties between individual soil columns. The magnitude of overstraining observed in this study does not significantly impact the structural response.
The deconvolved high-strain soil properties developed using consensus design procedures given in ASCE 4-98 are also compared with the convolution results and the ASCE 4-98 approach is shown to provide a reasonable estimate of high- strain soil properties and conservative in-layer spectra for use in SSI analyses.
INTRODUCTION
The response of a structure during an earthquake depends on the ground motion, the stiffness of the surrounding soil, the embedment, and effects of adjacent structures and on the dynamic characteristics of the structure. Soil-Structure- Interaction analysis considers the coupling between the soil and structural stiffness, and modifies the free field input motion to include embedment effects. Coupling the dynamic soil and structural stiffness generally reduces the natural frequency of the structure and modifies its damping. SSI analysis of embedded structures includes the variation in ground motion spectral intensity with depth and the kinematic effects of exciting the structure at different levels with various ground motions.
The dynamic stiffness of the soil is a function of soil material properties and structural geometry. Soil material properties are based on the low-strain in-situ soil properties at a site, as determined through in-situ and laboratory testing. Soil stiffness and damping are generally nonlinear functions of strain and these soil properties degrade during a seismic event. An accurate estimate of the amount of degradation is necessary to choose appropriate high-strain soil properties for use in the SSI analysis. Errors in the soil material properties used in the SSI analysis can lead to an inaccurate prediction of the natural frequency, damping, and response of the structure.
Seismic motions in an SSI analysis can be defined at the soil surface, base of the soil column or at an intermediate soil layer. Convolution and deconvolution are used to transfer the seismic motion up and down the soil column. Both convolution and deconvolution are dependent on the geometry (height) of the soil column and on the high-strain soil properties. If the amount of straining in the soil column is overestimated then the convolution process could underestimate the motion in higher layers. Alternately, if the amount of straining in the soil column is overestimated then the deconvolution process could overestimate the motion in lower layers. Thus, errors in the soil material properties used in the SSI analysis can lead to inaccurate input motions and inaccurate structural response.
Site response studies are often used to convolve the bedrock motion from bedrock to the surface. Variability in soil properties is usually addressed by convolving the motion through a suite of individual soil columns. Variability in input motion may be addressed by convolving multiple time histories representing local, intermediate and distant events. Each convolution uses a unique set of high-strain soil properties and results in a separate surface spectrum. The resulting suite of surface spectra are combined statistically and smoothed to determine a mean surface design spectrum. This mean surface spectrum may be further broadened to yield a surface design spectra.
The broadened surface design spectra have more energy than the mean surface spectra generated during the site response study. It has been postulated that deconvolving the broadened surface design spectra will overstrain the soil column, which could lead to erroneous SSI results. The purpose of this paper is to determine the extent of overstraining of the soil column due to deconvolving the broadened surface design spectra through the soil column. Additionally, the deconvolved response spectra at the base of an embedded structure will be compared to the corresponding convolved motion spectra to determine if the input to embedded structures is conservative.
SMiRT 16, Washington DC, August 2001 Paper # 1584
B A C K G R O U N D AND STATISTICAL C O N V O L U T I O N STUDY
The Savannah River Site covers about 310 square miles and has a soil depth of between 600 to 1500 feet overlaying either a Crystalline or Triassic basement. A portion of the site with 800-1000 feet of soil over a crystalline rock is examined in this paper.
The variability of soil properties across this portion of the site is represented with a suite of 30 soil columns having a depth between 800 and 1000 feet. The upper 400 feet of the mean low-strain soil column is shown in Figure 1. The coefficient of variation (COV) on the shear stiffness ranges from 14% to 54% depending on the soil layer and has a weighted average of 24%.
A v e r a g e Medi m~Sheal" Shear Sti tfi~es s D e p t h L a y e r T h i c k n e s s Stilfiless Coiefficient
(It) (ft) o fVariati on
oll
~ { ~ ; ~~ Upland 28
i ~ l
5 o ~ I
l ~ l Vob.~o 7 6
SS'~:{'S!;'-~,~ Road
~
Shallow Clay 6Santee 54
15
FOUl" M i l e 20
200 ~ Snapp 20
Fou r
Mi le 87
2 5 ~ Shall ow
~
Sand3 0 0 ~ h a i i o w Clay 10
I ~ ' 1
eep Sand 54 35 0 [ ~ ! ] D e e p ..:,~,., CI ay 15
I::::'i:/:lDeep Sal.J 30
400 I I
~/~-)
274 1 0.47
1893 0.36
1791 0 . 3 8
165 7 0 . 3 2
205 0 0.33
2083 0.30
2209 0.24
2297 0.24
2580 0.2 l
2754 0.18
2556 0.18
Figure 1 Mean Low-Strain Soil Column
A suite of probabilistic rock outcrop motions representing different earthquake magnitudes and epicenter distances were considered along with deterministic ground motions. For this study only a uniform hazard rock spectrum corresponding to a 2000-year seismic event is considered. The surface motion is determined by convolving the uniform hazard rock motion through each of 30 soil columns.
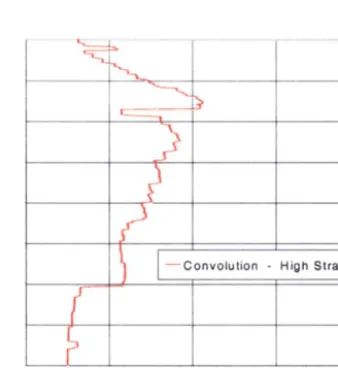
Median shear wave velocity is shown in Figure 2a for both the low-strain and high-strain material properties.
-50
-100
~- -150
(D
"r" -200 I - n uJ O -250
-300
-350
-400
c°nv°u'°n H°h S'ranl
- - C o n v o l u t i o n - L o w S t r a i n)00 2 0 0 0 3 0 0 0 4 0 0 0
S H E A R W A V E V E L O C I T Y , V s ( F e e t / S e c . )
~ - - ' ~ - , ~ _ _ ~
3
_I" [-
F
I - - C o n v o l u t i o n - High Strain I . . . . J
0.02 0.04 0.06
DAMPING Ratio
0.08
Figure 2a Median Shear Wave Velocity Figure 2b Median Damping
Depending on the layer, the median shear wave velocity degrades between 0% and 18% from the low-strain to the high-strain material properties. Similarly, the high-strain material damping is shown in Figure 2b. Note that for most of the structures on this deep site, the material damping is negligible compared to the SSI radiation damping.
The mean surface response spectra obtained from the 30 convolutions are shown in Figure 3 along with the uniform hazard spectra for the 2000-year return period basement motion. Amplification of the basement motion between the basement and surface is due to the dynamic characteristics of the soil column. Note that the soil column has natural frequencies at about 0.6, 1.3, 2.3 hertz, which are evident as spikes on the surface spectra. Also shown on Figure 3 are the surface response spectra resulting from the seismic hazard studies and the broadened design spectra. Note that the broadened design spectrum has peak displacements, velocities and accelerations that are 100%, 25% and 5% larger, respectively, than the mean convolved ground motion. It is this difference between the design and convolved spectra that are postulated to cause soil overstraining.
0 . 4 0
A
0 . 3 0 ._o
0 . 2 0 <
13 0 1 0 Q. O9
0 .00
I
X
0 . 1
L,
t Z
.... i
1 1 0
F r e q u e n c y ( H z )
,%
I
1 0 0
~ C o n v o l u t i o n -
M e a n
-"- D e s i g n
- ",-" H a z a r d S t u d i e s
~ B e d r o c k U H S
Figure 3 Response Spectra
STATISTICAL DECONVOLUTION STUDY
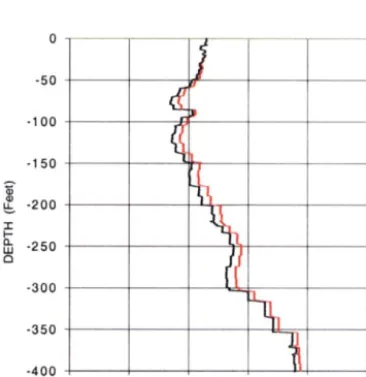
A time history was generated to fit the design spectra shown in Figure 3 and this motion is deconvolved through each of the 30 soil columns. The resulting median high-strain shear wave velocities and damping are shown in Figure 4a and 4b and compared to the corresponding median convolution high-strain values.
- 5 0
- 1 0 0
- 1 5 0
U_ - 2 0 0
-1- I- n W - 2 5 0 a
- 3 0 0
- 3 5 0
- 4 0 0
or
... ]
0 5 0 0 1 0 0 0 1 5 0 0 2 0 0 0 2 5 0 0
S H E A R W A V E V E L O C I T Y , V s ( F e e t / S e c . )
rg
0 . 0 2 0 . 0 4 0 . 0 6 0 . 0 8
D A M P I N G R a t i o
C o n v o l u t i o n M e d i a n
~ D e c o n v o l u t i o n M e d i a n
The median high-strain shear wave velocities from the deconvolution analysis in Figure 4, are between 2 and 8% smaller than the convolution analysis values. In an SSI analysis the natural frequency of a rigid structure on a flexible soil system, fso~l, referred to as the rigid body frequency, is proportional to the shear wave velocity. A lower bound estimate of the natural frequency of the SSI system, fssi, can be determined with Dunkerley's equation given the fixed base frequency of the structure, fStructure, and the rigid body frequency:
1 1 1
- + ( 1 )
f 2 f2 f2
SSI Soil Structure
Solving Eq. 1 for various ratios of
fSoil
tofStructure
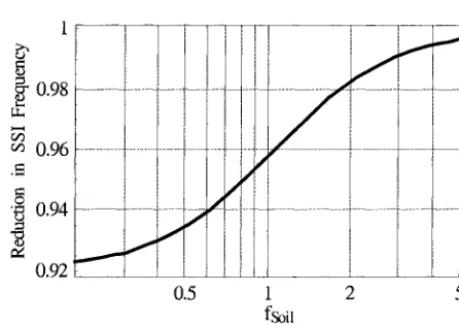
yields the SSI frequency. Solving again with 92% of fl~ yields a reduced SSI frequency. The ratio of these two frequencies is compared in Figure 5 which indicates that at the most an 8% reduction in shear wave velocity results in an 8% reduction in SSI frequency. However, interaction between the soil and structure is strongest when the rigid body and structural frequencies are about equal. The frequency shift for this case is less than 5%. For reference, ASCE 4-98 requires a minimum coefficient of variation in shear modulus of 50%, which corresponds to a variation in rigid body soil frequency f o r m 4 1 / 1 . 5 = 0.81 to ~-~ = 1.22 of the mean rigid body soil frequency, which is much larger than the 8% difference in mean rigid body frequency.1
~r 0.98
0.96
'~ 0.94
0.92
/ / I y
0.5
/
/
/
1 fSoil fStructure
i
1
I
2 5
Figure 5 Reduction In SSI Frequency Due To An 8% Reduction In Median Shear Wave Velocity
The median damping for the convolution and deconvolution cases is also compared in Figure 4b. The deconvolved motion typically has 40% to 50% more material damping than the convolved ground motion. However, for most structures on a deep soil site the difference between 4% and 6% material damping is not significant because radiation damping dominates the solution.
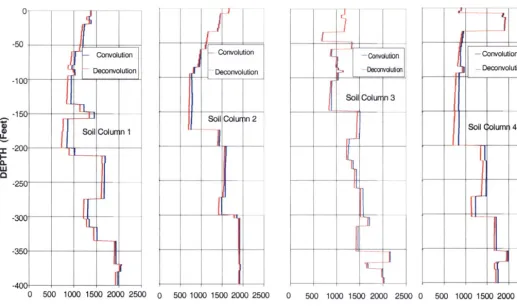
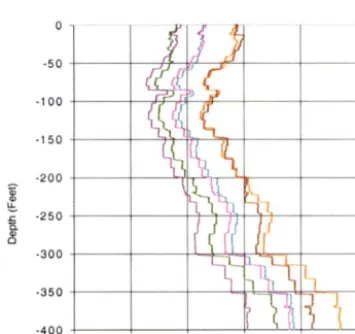
The shear wave velocity for the top 400 feet of the first four individual soil columns is compared in Figure 6. These figures are fairly representative of all 30-soil columns. Note that for a given soil column, the variation between convolved and deconvolved shear wave velocity is usually less than 10% and occasionally as large as 15%. Thus, the difference in high-strain shear wave velocity whether the soil column was convolved or deconvolved is relatively small.
However, there is a substantial difference in shear wave velocity between different soil columns. A given layer may be soft in one soil column with a low shear wave velocity while the same layer may be hard in a second soil column with a high shear wave velocity yielding differences in shear wave velocity in a given layer larger than 100%. Comparing the variation within a soil column between shear wave velocities derived by convolution or deconvolution to the variation between soil columns indicates that the variation within the soil column is much less than the variation between soil columns. In an SSI analysis, the soil within some effective depth below the base of the foundation influences the response of the foundation. The effective depth is usually expressed as one to two times the effective diameter of the structure. One simple procedure to address layered sites with varying material properties is to average the properties over the effective depth. Table 1 contains averaged shear wave velocities for effective depths of 50 feet and 200 feet. The convolution and deconvolution columns in Table 1 illustrate the variability between each of the 30 soil columns with COV ranging from about 10% to 20%. The deconvolution+convolution column illustrates the variability within a given soil column due to the
two different methods is less than 2%. Thus, the variability between the different soil columns is more than five times the variability due to either convolving or deconvolving the ground motion.
Given that:
(1) the difference in median shear wave velocity and damping between convolution and deconvolution methods resulted in less than an 8% shift in natural frequency which is much less than the frequency shift required by ASCE 4-98; and
2) the variation in shear wave velocity between different soil columns is much greater than the variation in shear wave velocity due to using either convolution or deconvolution;
then, for the case studied, there is no practical difference in soil stiffness between convolving and deconvolving the ground motion.
A
11
"I" 1- 111 0
0 500 1000 1500 2000 2500
Vs (Feet/Sec.)
3
j Convolution
- Deconvolution
Soil Colunln 2
'1
0 500 1000 1500 2000 2500
Vs (Feet/See.)
_J_
Convolution
--Deconvolution
Soil~Colurrn 3
]]
1-
0 500 1000 1500 2000 2500 0
Vs (Feet/See.)
i
Convolution
Deconvolution
Soil (;olumr 4
d
500 1000 1500 2000 2500
Vs (Feet/See.)
Figure 6 High-Strain Shear Wave Velocity Profiles
Table 1 Shear Wave Velocity Statistics for 30 Soil Columns (fps)
Minimum Average Maximum
Standard Deviation COV
50 foot Effective Depth
Convolution
702 1142 1623 214 0.19
Deconvolution
714 1135 1616 208 0.18
D e c o n v o l u t i o n C o n v o l u t i o n
0.974 0.995 1.019 0.012 0.012
200 foot Effective Depth
Convolution
768 1047 1458 153 0.15
Deconvolution
872 1074 1220 106
0.099
D e c o n v o l u t i o n C o n v o l u t i o n
0.928 , - , ,
In-layer motions are used in SSI analyses to define the acceleration at the base of an embedded structure. The mean seismic input at the base of a 40 feet deep embedded structure is shown in Figure 7 corresponding to convolution of the base motion and a deconvolution of the broadened surface design response spectra. Note that both the convolved and deconvolved motions have a dip in the spectra near 7 Hz. The natural frequency of the dip, fDip, corresponds to the natural frequency of the 40 foot soil column above this layer or
Vs 1142
= - = 7.2hz (2)
fDip 4H 4(40)
Where Vs is the shear wave velocity which is approximated by the value for a 50 foot effective depth in Table 1 and H is 40 feet. As seen in Figure 7, the deconvolved response spectrum is always greater than the convolved response spectrum. Recall from Figure 3 that the design surface spectra are larger and broader than an envelope of the convolved surface spectra. Thus, the deconvolved motion starts out larger than the convolved motion. As shown in Figure 4, the deconvolved motion has slightly lower shear wave velocities and larger damping. However, the spectral amplification factors (surface spectra/layer spectra) of the deconvolved ground motion is almost identical to the corresponding spectral amplification factors for the convolved motion up to 11 Hz, as shown in Figure 8. Figure 8 also shows that spectral amplification factors are higher for convolved motions for frequencies above 11 Hz. This shows that on a relative basis, use of the deconvolved surface motion is conservative.
0 . 4 0
,,.-,,,
o~ 0 3 0
8 0 . 2 0
O
<
o . ~ o co
0 . 0 0
lt'
'/Y/I'""
0 . 1
\
,.i
1 0 1 0 0 F r e q u e n c y ( H z )
Figure 7 In-Layer Response Spectra at 40 Feet Depth
C 0 n v o lu t i o n ~ D e c o n v o l u t i o n
D e s i g n
~ H a z a r d S t u d i e s
2 . 5
2 . 0
1.5
1 . 0
0 . 5
0 . 0
0.1 1 0 1 0 0
F r e q u e n c y (H z)
D e c o n v o l u t i o n - - - C o n v o l u t i o n
ASCE 4-98 D E C O N V O L U T I O N
ASCE 4-98 is a consensus standard that contains seismic analysis criteria for nuclear structures. This standard specifies a minimum coefficient of variation on shear modulus of 50% to account for uncertainty in a SSI analysis. This approach leads to three SSI evaluations with Lower Bound (LB), Best Estimate (BE) and Upper Bound (UB) soil properties. A deconvolution of the broadened surface design spectra was performed with each of these three sets of material properties and the resulting shear wave velocities and damping are compared to the convolution values in Figure 9.
As seen in Figure 9a, the LB shear wave velocity is approximately equal to or lower than the convolution median minus one standard deviation (Sigma) shear wave velocity. Similarly, the median convolution shear wave velocity is roughly equal to the BE shear wave velocity and the median plus one standard deviation convolution shear wave velocity is roughly equal to or lower than the UB shear wave velocity. Therefore, the results of ASCE 4-98 analyses bound the convolution results, except in upper 40 feet. As seen previously, deconvolving the broadened surface spectra results in shear wave velocities that are between 0% and 18% lower than the convolved values. Given these reduced shear wave velocities and the relationship in Figure 5, then it is evident that significant rigid body frequencies will be between 0% and 10% lower than the complementary frequencies calculated using the convolved ground motion. Note that this variation is small when compared to the range of fixed base frequencies calculated using LB and UB soil properties, which are roughly +20% of the mean frequency.
Damping values for the LB, BE and UB deconvolution cases are shown in Figure 9b along with the convolved damping values. The damping for deconvolution ranges from 0% to 137% greater than the convolved damping. However, as stated previously, the radiation damping will govern most structures on this deep site and the difference between approximately 4% and 7% in material damping does not have a significant impact on the structural response.
The LB, BE and UB deconvolved spectra at a depth of 40 feet are shown in Figure 10 along with the mean convolved spectra.
- 5 0
- 1 0 0
- 1 5 0
- 2 0 0
- 2 5 0
- 3 0 0
- 3 5 0
- 4 0 0
0 5 0 0 1 0 0 0 1 5 0 0 2 0 0 0 2 5 0 0
V s ( F e e t / S e c . )
Figure 9a High-Strain Shear Wave Velocity
0 0 02 0 04 0 0 6 0 . 0 8
D a m p i n g R a t i o
. . . . 0
Figure 9b High-Strain Damping
~ L B - D o c o n v o l u t i o n
. . . ( M e d i a n - S i g m a ) C o n v o l u t i o n
- - - B E - D e c o n v o l u t i o n
-- M e d i a n - C o n v o l u t i o n U B - D e c o n v o l u t i o n
. . . ( M e d i a n + S i g m a ) C o n v o l u t i o n
0 . 4 0 . . . - . . . .
0 . 3 0
o = ca
"~ 0 2 0
0 . I 0
0 . 0 0 i
0 . 1 1 0
I
!
F r e q u e n c y ( H z )
0 0
~ B E ~ U B
- - - - L B D e s i g n
- - C o n v o l u t i o n
The average shear wave velocity for the upper 40 feet of the LB, BE and UB soil columns is 894, 1132 and 1415 fps respectively, yielding 'dip' frequencies of 5.6, 7.1 and 8.8 hertz respectively, which are consistent with the dips observed in Figure 10. Recall that the 'dip' in the mean convolution spectra was about 7 to 7.2 hertz which matches the BE 'dip'. Note that one or more of the LB, BE or UB spectra is always greater than the convolved spectra. Thus, use of the LB, BE and UB spectra is always conservative compared to the mean convolved spectra.
SUMMARY AND CONCLUSION
It has been postulated that deconvolving the broadened surface design spectra will overstrain the soil column, which could lead to erroneous SSI results. The effect of this overstraining was evaluated for a specific deep soil site by statistically comparing the response parameters for (1) a base case which consists of a uniform hazard spectrum convolved from bedrock through a suite of 30 soil columns; (2) the broadened surface design spectra deconvolved through a suite of 30 soil columns; and (3) the broadened surface design spectra deconvolved through lower bound, best estimate and upper bound soil columns specified by ASCE 4-98.
High-strain shear wave velocity was the primary soil response parameter examined. This parameter was chosen because of its strong influence on the natural frequency of the soil-structure system. For the site and broadened surface design spectra studied, there is no practical difference in high-strain shear wave velocity or natural frequency for the three methods examined. Any variability between the three methods was observed to be much less than the natural variability in material properties between the different soil columns. The simplified method specified by ASCE 4-98 yielded satisfactory high-strain shear wave velocities.
Soil damping was also examined because damping affects both the responses of the structure and the soil transfer function. Radiation damping at this deep soil site is typically 1 to 1.5 orders of magnitude larger than the material damping. Thus, while the material damping was larger in the deconvolution analyses its effect on the combined radiation and material damping is negligible. Material damping does have a significant effect on the transfer function used to convolve or deconvolve motions from one layer to another. In a deconvolution analysis the transfer function is reduced by overestimating damping. If the transfer function is reduced then the reduction in spectral acceleration from the surface to a lower elevation is underestimated and the acceleration at the lower elevation is overestimated. Thus, overestimating damping in a deconvolution analysis also leads to overestimating the in-layer response spectra. Using a larger in-layer response spectra as input to an embedded structure is conservative.
In-layer response spectra for a 40 feet deep embedded structure were also evaluated. Recall that the broadened surface design spectra have more energy at the surface than the convolved surface spectra. Then if the convolution and deconvolution analyses have identical transfer functions the deconvolved in-layer motion will be larger than the corresponding convolved in-layer motion. As seen in the damping discussion, the deconvolution transfer function is underestimated, which results in the deconvolution analysis having an even larger in-layer response spectra. Thus, deconvolution results in conservative in-layer response spectra.
The ASCE 4-98 approach of performing the SSI analysis with lower bound, best estimate and upper bound soil columns provides an additional degree of conservatism as these different soil column stiffness cause the 'dip' in the in-layer response spectra to shift. The resulting spectral envelope is much more conservative than the convolution analysis indicates.
Based on the results of this study, the approach given by ASCE 4-98 is recommended for typical deep layered sites, such as Savannah River Site, because it is conservative and relatively economical to implement.
ACKNOWLEDGEMENTS
The information contained in this paper was developed during the course of work done under the funding from the U.S. Department of Energy.
REFERENCES
1) WSRC Report WSRC-TR-97-0085, Revision 0, "SRS Seismic Response Analysis and Design Basis Guidelines", March 1997.
2) User's Manual for SHAKE91, November 1992.