Transactions, SMiRT-25 Charlotte, NC, USA, August 4-9, 2019
Division VII
UNCERTAINTIES RELATED TO STRUCTURAL MODEL OUTPUTS AS
A FUNCTION OF THE ENGINEERING DEMAND PARAMTER AND OF
THE COMPUTATIONAL MODEL
Alessandro Stocchi1, Benjamin Richard2
1 Post Doc, ENS Cachan, Paris, France ([email protected])
2 Head of the Structural Performance Modeling and Analysis Laboratory, IRSN, 31 avenue de la Division
Leclerc, 92260, Fontenay- aux-Roses, France ([email protected])
ABSTRACT
Fragility curves express the failure probability of a structure, or of a critical component, as a function of a seismic intensity measure, for a given failure criterion. The failure criterion is often based on the difference between a structural response parameter level and a threshold, which can be either deterministic or probabilistic. Within a probabilistic context, structural response parameters are random variables and therefore subjected to a certain variability mostly depending on the structural typology and the assessment method. When engineers have to make a decision to choose appropriate engineering demand parameters to be considered, they need to know how sensitive it will be. The study reported in this paper attempts to bring answers to this question. More precisely, the sensitivity of some engineering demand parameters is quantified and discussed as a function of the structural typology (beam-column or wall-based structures) and of the considered assessment method. The final output is a correlation matrix linking (i) the coefficient of variation of specific engineering demand parameters, (ii) the structural typology and (iii) the adopted modeling technique.
INTRODUCTION AND ANALYSIS PROCESS
The seismic Probabilistic Risk Assessment (PRA) methodology has become highly used in the nuclear industry for the estimation of the seismic risk of Nuclear Power Plants (NPPs), EPRI (2013). In the PRA approach, fragility curves are computed as conditional probabilities of failure of structures, or critical components, for given values of a seismic Intensity Measure (IM). The nature of the IM, the type (force, displacement, etc.) of quantity y and the value of y0 are chosen by the user. Hence, the fragility curve
charge of developing structural models will be able to take benefits from the expected variability of the output quantities to select the appropriate EDP.
The work carried out by Kwon and Elnashai (2006) studied the weight of uncertainties related to the ground motion and to the material parameters. The authors concluded on the importance of the uncertainties related to the ground motion but did not consider the influence of the structural typology or of the assessment method. The work presented in this paper is in continuity with the work by Kwon and Elnashai (2006), Lopez-caballero and Modaressi-Farahmand-Razavi (2010). Considering the ground motion as deterministic, the uncertainties related to the model parameters can be propagated and their resulting influence on the EDPs can be quantified, as a function of the structural typology and the modeling technique.
The probabilistic analysis conducted to study the sensitivity of the selected EDPs is described. It is composed of three steps. The first one consists in defining the random model. The variables to be considered as random are selected and the associated PDFs are chosen. The second step lies in propagating the uncertainties through the deterministic mechanical model, which is assumed to be consistent (at least in mean) with the physics involved in the problem. Based on the results of the second step, the last step consists in computing the selected EDPs.
Five random variables are selected. Their physical meaning and the associated PDFs are described in table 1. We can notice that log-normal PDFs were chosen, which is quite common when the support of the random variables must stay positive due to physical considerations. In the present study, no correlation is assumed between variables. In accordance with the objectives of the present study, the ground motion is assumed to be deterministic. That is to say a unique set of accelerograms has been considered for each case-study (BANDIT and SMART 2013) to describe the seismic loading.
Table 1: Statistical parameters and PDFs of the random variables. CD = case-dependent, COV = coefficient of variation.
Variable Meaning Distribution Unit Mean COV (%)
𝐸 Young’s modulus Log-normal 𝑃𝑎 CD 15 𝐺𝑓 Fracture energy Log-normal 𝐽. 𝑚−3 CD 30 𝑓𝑡 Tensile strength Log-normal 𝑃𝑎 CD 30 𝜎𝑒 Yield stress Log-normal 𝑃𝑎 CD 5
𝜉 Damping ratio Log-normal − CD 20
With the aim to study the effects of both the structural typology, and the modeling technique, five different mechanical models have been defined. More precisely, two structural typologies were selected: a Reinforced Concrete (RC) beam-column structure and a RC shear-wall-based structure. In case of the beam-column structure, three modeling strategies were considered. The main difference between them is the type of Finite Element (FE) used: Timoshenko’s multifiber beam elements on the one hand and mutilayer shell elements and solid elements on the other hand. In case of the RC shear-wall-based structure, only two modeling strategies were considered. Regarding the uncertainties propagation technique, a current Monte Carlo Simulation Method (MCSM) has been used.
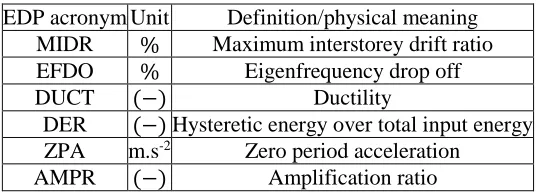
damage index. Safety margin estimation and damage thresholds based upon the use of this index have been recently proposed, Richard et al. (2016a), Richard et al. (2016b). The DUCTility (DUCT) index is defined as the ratio between the overall maximum displacement and the maximum displacement in the elastic domain. This quantity is often used in the context of structural assessment to verify that the structure is able to withstand to a given action (classically not taken in to account at design stage). Less classical than the other indices, the Hysteretic EneRgy over total input energy (DER) is useful to estimate the ratio of the energy which is dissipated by the constitutive materials themselves. It is defined as the ratio between the hysteretic energy over the total input energy. The Zero Period Acceleration (ZPA) is defined as the pseudo-acceleration estimated either when the period is null or when the frequency tends to infinity. For some methodologies mainly devoted to equipment assessment, the ZPA allows for the load determination. The last selected EDP is the AMPlification Ratio (AMPR). It is defined as the ratio between the maximum pseudo-acceleration over the ZPA.
Table 2: Definition of the selected EDPs.
EDP acronym Unit Definition/physical meaning MIDR % Maximum interstorey drift ratio EFDO % Eigenfrequency drop off
DUCT (−) Ductility
DER (−)
Hysteretic energy over total input energy
ZPA m.s-2 Zero period accelerationAMPR (−) Amplification ratio
STRUCTURAL CASE-STUDIES: EXPERIMENTAL SETUP AND MODELING STRATEGIES
eigenfrequencies of the RC specimen. A mean damping ratio equal to 2% was chosen. The nonlinear dynamic problem has been solved with the finite element software CAST3M ( using a Newmark’s integration scheme the numerical parameters of which have been set to ensure unconditional stability, i.e. with constant average acceleration). In addition, the time step is equal to 9.76 10−4 s and the convergence criterion based on the quadratic modulus of the residue vector is equal to 10-4.
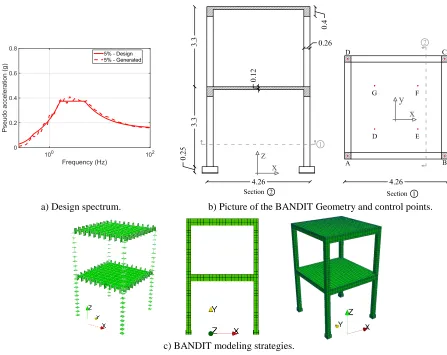
a) Design spectrum. b) Picture of the BANDIT Geometry and control points.
c) BANDIT modeling strategies.
Figure 1: Design spectrum, picture, and geometry of the BANDIT specimen - dimensions in meters.
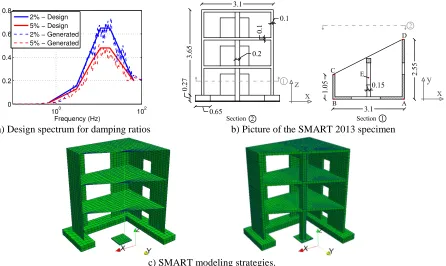
latter element has been meshed with three-dimensional FEs. The column is described by Timoshenko’s beam elements. Indeed, because this structural element does not have critical structural function, a rough description of its behavior has been judged as sufficient. In Figure 2 c), the full three-dimensional mesh used in the 3D modeling strategy is also shown. The constitutive laws used to represent the mechanical behavior of concrete and steel are the same as ones used in case of the BANDIT specimen, see Vassaux et al. (2015), Menegotto and Pinto (1977), for concrete and steel respectively). It can be noticed that the slabs are considered elastic for the same reasons as the ones exposed in case of the BANDIT case-study. The material parameters of each constitutive laws were identified according to the results of the mechanical tests performed on concrete and steel specimens, see Richard et al. (2016b). Similarly to the case of BANDIT specimen, additional dissipation has been included in the model by considering the Rayleigh damping model. The viscous damping ratio considered in case of SMART 2013 is equal to 2.8%.
a) Design spectrum for damping ratios b) Picture of the SMART 2013 specimen
c) SMART modeling strategies.
Figure 2: Design spectrum and picture of the SMART 2013 specimen, geometry and finite element mesh - dimensions in meters.
RESULTS AND DISCUSSION
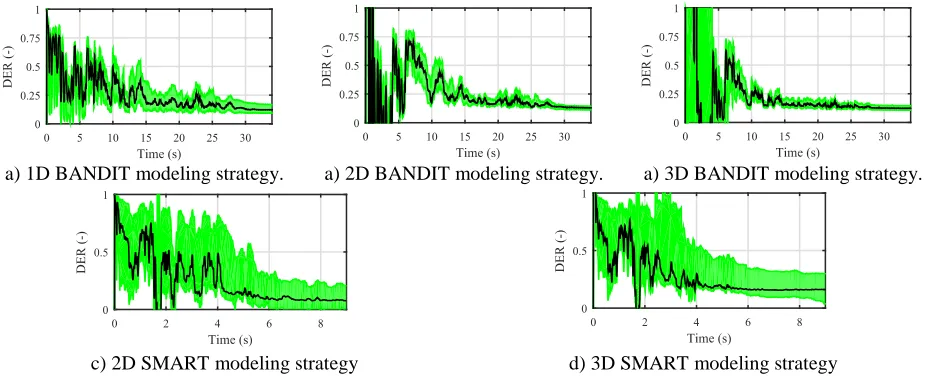
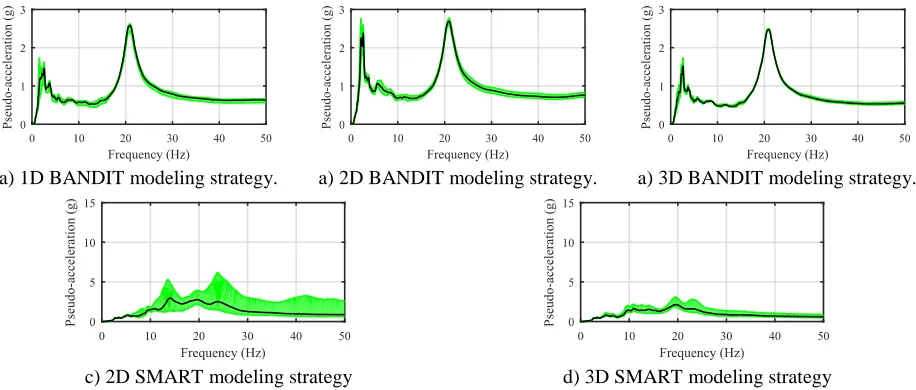
a) 1D BANDIT modeling strategy. a) 2D BANDIT modeling strategy. a) 3D BANDIT modeling strategy.
c) 2D SMART modeling strategy d) 3D SMART modeling strategy
Figure 3: Time evolution of the DER - 90% confidence interval is depicted in green.
Sensitivity of MIDR Among the EDPs selected in this work, the MIDR is one of the most used EDP in the engineering community. The time evolution of the MIDR are shown in Figure 4 a) –c) and d) –e) for the BANDIT and SMART 2013 specimens respectively. Regarding the case of the BANDIT specimen, the width of the confidence interval is almost the same for all the modeling strategies used. In addition, one can notice that the results obtained with the 2D strategy and shown in Figure 4 b) exhibit a higher frequency content than the other ones. This may be explained by the fact that the 2D assessment approach, by nature, does not take into account out-of-plane effects. These effects might have appeared during the shaking table experiment. Not taking them into account may lead to a stiffer structural response. Regarding the case of SMART 2013 specimen, the width of the confidence interval is higher than in case of the BANDIT specimen. This trend is similar to the one observed in Figure 3.
a) 1D BANDIT modeling strategy. b) 2D BANDIT modeling strategy.
c) 3D BANDIT modeling strategy.
d) 2D SMART modeling strategy. e) 3D SMART modeling strategy.
Sensitivity of ZPA; The ZPA is used in many conventional assessment methodologies. One of the inputs of the method is the equivalent pseudo-static force, which is computed as the product between a mass term and the ZPA. The time evolutions of the ZPA are shown in Figure 5 a) –c) and d) –e) for the BANDIT and SMART 2013 specimens respectively. Regarding the BANDIT specimen, Figures 5 a), b), and c) show similar trends: the mean responses are consistent as well as the width of the confidence intervals. On the contrary, the results related to the SMART 2013 specimen show a higher sensitivity to the material parameter uncertainties, especially in case of the 3D modeling approach.
a) 1D BANDIT modeling strategy. a) 2D BANDIT modeling strategy. a) 3D BANDIT modeling strategy.
c) 2D SMART modeling strategy d) 3D SMART modeling strategy
Figure 5: Time evolution of the ZPA - 90% confidence interval is depicted in green - SMART 2013.
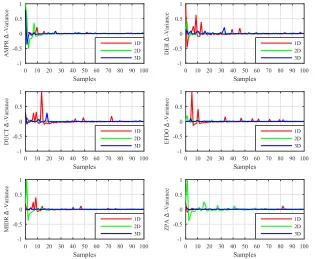
The statistical convergence is assessed by computing the gap between two variance estimations as a function of the sample number. This computation has been carried out considering each structural typology, modeling strategy and the selected EDP. Given a structural typology and assessment technique, the following quantity has been computed for all the selected EDPs.
Δ𝑖(𝑛) =
𝑽𝒂𝒓(𝒚𝑖)𝑛+1−𝑽𝒂𝒓(𝒚𝑖)𝑛
𝒎𝒂𝒙
0≤𝑝≤𝑛(𝑽𝒂𝒓(𝒚𝑖)𝑝)
(2)
𝑽𝒂𝒓(𝒚𝑖) =
∑𝑛𝑗=1(𝑦𝑖𝑗−𝜇(𝒚𝑖)) 2
𝑛−1
(3)
where Δi(n) stands for the convergence index for n realizations of the ith EDP, μ(yi) is the statistical
Figure 6: Consecutive gaps between two variance estimations - BANDIT.
In order to quantify the sensitivity of all the selected EDPs, their associated COV were estimated. The results are shown in Figures 7 a) and 7 b) for the BANDIT and the SMART 2013 specimens respectively. For both cases, one of the most sensitive EDP is the ZPA even though it should be noted that the range of variation of this index is not the same for both cases. On the other hand, for both cases, the least sensitive index is the AMPR. According to the definition of the AMPR, this observation means that the effects of the uncertainties on the ZPA are somehow balanced by the variations of the maximum spectral acceleration. In addition, results clearly show that the EDPs computed in case of the SMART 2013 specimen are more sensitive, than the ones computed in case of the BANDIT specimen. This trend is consistent with the ones identified in the analysis of specific EDPs, previously exposed. Regarding the effect of the assessment methodology, a general trend is not easy to identify. In case of the BANDIT specimen, the 1D modeling strategy leads to the most sensitive EDPs, whereas in case of the SMART 2013 specimen, it is the 3D approach. However, in both cases, the 2D modeling approach appears as being less sensitive to the material parameter uncertainties than the other ones.
a) BANDIT specimen. a) SMART 2013 specimen.
CONCLUSIONS, RECOMMENDATIONS AND OUTLOOK
In this study, the effects of material parameter uncertainties on selected EDPs are analyzed and quantified, as a function of the structural typology and the assessment methodology. To support this analysis, two shaking table experiments have been selected, namely the BANDIT and SMART 2013 experimental campaigns. Even though many studies have allowed to establish a consensus on the fact that uncertainties on the seismic input ground motions are usually higher than the ones on material parameters, the consequences of considering them as random variables were never fully investigated. To this end, the seismic input ground motion was assumed to be deterministic. In this way, conclusions on the effects of material parameter uncertainties could be drawn. Despite the fact that only one structure for each structural typology has been analyzed in this study, first trends could be identified. In accordance with the results presented in this paper, the following conclusions have been reached:
a shear-wall-based structure exhibit more sensitive responses than a beam-column one;
1D and 3D modeling approaches lead to structural response which are more sensitive than the 2D modeling approach;
the amplification ratio is the least sensitive EDP, whereas the ZPA is the most sensitive one.
The results of this study can be expressed in a pragmatic manner as short recommendations to the structural engineering community. Figure 8 shows a sensitivity matrix for the two structural typologies and for all the considered assessment methods. This matrix may help engineers in choosing the best EDP to apprehend the sensitivity of the structural responses for the structure they need to study. More precisely, let us assume that a fragility curve is represented by a median capacity Am and a standard
deviation β. If engineers use a given modeling strategy and EDP(s) that is(are) not sensitive to the uncertainties related to the input parameters, the resulting uncertainties level should be decreased. Therefore, the confidence interval associated to the fragility curve should be narrower and the median capacity should be lower (if we considered that the slope of the fragility curve at Pf = 0.5 is mainly driven
Figure 8: Covariance matrix. ACKNOWLEDGEMENTS
The work carried out under the SINAPS@ project has benefited from French funding managed by the National Research Agency under the program Future Investments (SINAPS@ grant No. ANR-11-RSNR-0022).
REFERENCES
EPRI. (2013). “Seismic probabilistic risk assessment implementation guide, ” Tech. rep., Electric Power Research Institute EPRI, Palo Alto, CA, report 1002989 (2013).
Fox M. J., Sullivan T. J., Beyer K. (2015). “Evaluation of seismic assessment procedures for determining deformation demands in rc wall buildings, ” Earthquakes and Structures, 9 (EPFL-ARTICLE-213147) 911– 936.
Garcia R., Hajirasouliha I., Guadagnini M., Helal Y., Jemaa Y., Pilakoutas K., Mongabure P., Chrysostomou C., Kyriakides N., Ilki A., et al., (2014). “Full-scale shaking table tests on a substandard rc building repaired and strengthened with post-tensioned metal straps.”, Journal of Earthquake Engineering, 18 (2) (2014) 187–213. Ile N., Nguyen X.-H., Kotronis P., Mazars J., Reynouard J. M. (2008), ”Shaking table tests of lightly rc walls:
Numerical simulations,” Journal of Earthquake Engineering, 12 (6) (2008) 849–878.
Kennedy R. P., Cornell C., Campbell R., Kaplan S., Perla H. (1980). “Probabilistic seismic safety study of an existing nuclear power plant, ” Nuclear Engineering and Design, 59 (2) 315–338.
Kwon O.-S., Elnashai A. (2006). „The effect of material and ground motion uncertainty on the seismic vulnerability curves of rc structure,” Engineering structures 28 (2) 289–303.
Lallemant D., Kiremidjian A., Burton H. (2015). “Statistical procedures for developing earthquake damage fragility curves. ” Earthquake Engineering & Structural Dynamics, 44 (9) 1373–1389.
Lopez-Caballero F., Modaressi-Farahmand-Razavi A. (2010). “Assessment of variability and uncertainties effects on the seismic response of a liquefiable soil profile.” Soil Dynamics and Earthquake Engineering, 30 (7) 600–613.
Menegotto M., Pinto P. E. (1977). “Slender rc compressed members in biaxial bending.” Journal of the Structural Division, 103 (3).
Noh H. Y., Lallemant D., Kiremidjian A. S. (2015). “Development of empirical and analytical fragility functions using kernel smoothing methods. ” Earthquake Engineering & Structural Dynamics, 44 (8) 1163–1180. Porter K. A. (2003). “An overview of peer’s performance-based earthquake engineering methodology.” Proceedings
of ninth international conference on applications of statistics and probability in civil engineering,
Richard B., Martinelli P., Voldoire F., Chaudat T., Abouri S., Bonfils N. (2016a), “Smart 2008: Overview, synthesis and lessons learned from the international benchmark.” Engineering Structures,106 (2016) 166–178.
Richard B., Cherubini S., Voldoire F., Charbonnel P.-E., Chaudat T., Abouri S., Bonfils N. (2016b) “Smart 2013: Experimental and numerical assessment of the dynamic behavior by shaking table tests of an asymmetrical reinforced concrete structure subjected to high intensity ground motions,” Engineering Structures, 109 (2016) 99–116.
Shinozuka M., Feng M. Q., Lee J., Naganuma T. (200). “Statistical analysis of fragility curves.” Journal of engineering mechanics, 126 (12) 1224–1231.
Xu H., Gardoni P. (2016). “Probabilistic capacity and seismic demand models and fragility estimates for reinforced concrete buildings based on three-dimensional analyses.” Engineering Structures, 112 200–214.
Vassaux M., Richard B., Ragueneau F., Millard A. (2015). ”Regularised crack behaviour effects on continuum modelling of quasi-brittle materials under cyclic loading, ” Engineering Fracture Mechanics, 149 (2015) 18– 36.