P R O C E E D I N G S
Open Access
Incorporating predicted functions of
nonsynonymous variants into gene-based
analysis of exome sequencing data:
a comparative study
Peng Wei
1,2*, Xiaoming Liu
1,2, Yun-Xin Fu
1,2From
Genetic Analysis Workshop 17
Boston, MA, USA. 13-16 October 2010
Abstract
Next-generation sequencing has opened up new avenues for the genetic study of complex traits. However, because of the small number of observations for any given rare allele and high sequencing error, it is a challenge to identify functional rare variants associated with the phenotype of interest. Recent research shows that grouping variants by gene and incorporating computationally predicted functions of variants may provide higher statistical power. On the other hand, many algorithms are available for predicting the damaging effects of nonsynonymous variants. Here, we use the simulated mini-exome data of Genetic Analysis Workshop 17 to study and compare the effects of incorporating the functional predictions of single-nucleotide polymorphisms using two popular
algorithms, SIFT and PolyPhen-2, into a gene-based association test. We also propose a simple mixture model that can effectively combine test results based on different functional prediction algorithms.
Background
Despite the great success of genome-wide association studies (GWAS) in identifying hundreds of loci harbor-ing common sharbor-ingle-nucleotide polymorphisms (SNPs) that are associated with complex diseases, most com-mon SNPs identified to date have small effect sizes and the proportion of heritability explained is at best modest for most traits. Thus investigators have become inter-ested in low-frequency or rare variants (minor allele fre-quency [MAF] < 1%) that may contribute to genetic risk [1]. Recent advances in next-generation sequencing technologies have made it possible, at a relatively low cost, to extend association studies to low-frequency and rare variants, particularly in targeted resequencing of candidate genes or the whole exome.
The statistical power to detect disease association with an individual rare variant is limited, partly because of the
small number of observations for any given variant and partly because of the high frequency of sequencing errors. In response to this challenge, several new and powerful statistical methods have been proposed recently, includ-ing the combined multivariate and collapsinclud-ing (CMC) method of Li and Leal [2], the weighted-sum method of Madsen and Browning [3], and the variable threshold (VT) approach of Price et al. [4]. Despite different statisti-cal models, a common strategy adopted by these methods is to group the variants according to function, such as genes and pathways, and compare the group counts or distributions rather than the counts for each variant in the group. The rationale behind this grouping strategy is that if many different mutations in a group affect disease risk, then it may be beneficial to focus on the group rather than on each variant individually.
The VT method of Price et al. [4] is of particular interest because, in contrast to a prespecified threshold for defining rare variants in the CMC method, it allows the allele frequency threshold to vary and thus adapts to properties of individual genes. It is motivated by the fact * Correspondence: [email protected]
1
Division of Biostatistics, University of Texas School of Public Health, 1200 Herman Presser Drive, Houston, TX 77030, USA
Full list of author information is available at the end of the article
that some genes may harbor functional alleles at higher frequencies, whereas other genes may have only private functional variants. Another feature of the VT method is that it can incorporate computational predictions of the functional effects of nonsynonymous variants (e.g., by PolyPhen-2 [5]) into the association test, thereby avoiding the loss of power that results from combining both functional and nonfunctional alleles, as in previous grouping methods. The VT method is more powerful than the CMC and the weighted-sum methods for ana-lyzing simulated and empirical sequencing data.
We note that Price et al. [4] used and studied only functional predictions from PolyPhen-2. However, sev-eral other algorithms are available for computationally predicting functions of nonsynonymous variants, such as the“sorting tolerant from intolerant” (SIFT) algorithm of Kumar et al. [6], MutationTaster of Schwarz et al. [7], and the“screening for nonacceptable polymorphisms” (SNAP) algorithm of Bromberg et al. [8]. It is yet unclear how the results of different functional predic-tion-algorithm-based VT tests compare with each other. The objective here is to use the Genetic Analysis Work-shop 17 (GAW17) simulated mini-exome data to com-pare the results of the VT test incorporating predicted functions of nonsynonymous variants from two popular algorithms, PolyPhen-2 and SIFT. Although previous investigators have compared the accuracy of the two algorithms in predicting deleterious mutations (e.g., Fla-nagan et al. [9] and Adzhubei et al. [5]), we are the first, to our knowledge, to study the effects of incorporating functional predictions based on different computational algorithms in the context of association tests of sequen-cing data. In addition, we propose a simple mixture model to combine the test results based on different functional prediction algorithms.
Methods Data description
We analyze the simulated mini-exome data set provided by GAW17. This data set consists of a collection of 697 unrelated individuals and their genotypes and pheno-types. The subjects are from the 1000 Genomes Project (http://www.1000genomes.org). There are 24,487 SNPs, among which 13,572 are nonsynonymous, mapped to the exons of 3,205 genes. Two hundred replicates of the phenotype simulation were carried out based on some simulating model, and three quantitative traits and a qualitative trait were available. See Blangero et al. [10] for simulation details. In this study, we analyze only the qualitative trait, that is, disease status, from replicate 1. There were 209 case subjects and 488 control subjects. Because we focus on a gene-based association test, we restrict our analysis only to genes with at least two
SNPs, resulting in 1,979 genes and 23,261 SNPs, among which 13,086 are nonsynonymous. The summary statis-tics of the number of SNPs that each of the 1,979 genes has are as follows: minimum = 2, 25th percentile = 3, median = 6, 75th percentile = 15, and maximum = 231.
SIFT and PolyPhen-2 algorithms
The SIFT algorithm is a multistep, sequence-homology-based algorithm that classifies amino acid substitutions resulting from nonsynonymous SNPs. The underlying premise for the SIFT algorithm is based on the evolu-tionary conservation of the amino acids within protein families: Highly conserved positions tend to be intoler-ant to substitutions, whereas those with a low degree of conservation tolerate most substitutions [6]. The SIFT algorithm predicts that a nonsynonymous variant will be damaging if the scaled probability score, also termed the SIFT score, is less than 0.05; otherwise, the algorithm predicts that the variant will be tolerated.
In contrast to the SIFT algorithm, which does not use the protein structure information, the PolyPhen-2 algo-rithm uses a naïve Bayes classifier to predict damaging effects of nonsynonymous variants based on eight sequence-based and three structure-based predictive fea-tures [5]. The PolyPhen-2 algorithm calculates the naïve Bayes posterior probability that a given mutation will be damaging and qualitatively predicts that it will be benign, possibly damaging, or probably damaging, corre-sponding to posterior probability intervals [0, 0.2], (0.2, 0.85), and [0.85, 1], respectively.
We obtained the predicted functional scores of all 13,572 nonsynonymous SNPs by means of the online versions of the SIFT algorithm (http://sift.jcvi.org/index. html) and the PolyPhen-2 algorithm (http://genetics. bwh.harvard.edu/pph2/). For both algorithms, we used human genome build 36 from the National Center for Biotechnology Information (NCBI) as the reference gen-ome sequence. For the PolyPhen-2 algorithm, HumDiv was selected as the classifier model because it was recommended for evaluating rare alleles at loci poten-tially involved in complex phenotypes [5].
Variable threshold test
likely to be functional than those with a MAF greater thanT.Specifically, for a given gene with mSNPs in its exons, we define thez-score for a given thresholdTas:
z T
Where xiT is an indicator variable that is equal to 1 if the MAF of SNP i is less than the threshold T and equal to 0 otherwise,Cij is the reference allele count of SNPiin subject j, πjis the phenotype of subject jequal to 0 and 1 for control subjects and case subjects, respec-tively, p is the mean value ofπjacross subjectsj, and Si is the functional prediction score of SNP i, which is between 0 and 1 (larger values indicate higher probabil-ity of damaging effect). In addition, the maximum z -score is defined as:
z z T
T
max =max ( ). (2)
The statistical significance of zmaxis then assessed by
permutations on phenotypes. In addition, the VT test has been implemented as an R function, available at http://genetics.bwh.harvard.edu/rare_variants/.
Incorporating the predicted functions of variants into the VT test
To study and compare the effects of incorporating differ-ent predicted functions of SNPs into a gene-based associa-tion test, we carried out four versions of the VT test: (1) an unweighted VT test, in which all SNPs, both synon-ymous and nonsynonsynon-ymous, were grouped (thusSiin Eq. (1) was 1 for all SNPs); (2) a binary weight VT test, in which only nonsynonymous SNPs were grouped (thusSi was 1 for nonsynonymous SNPs and 0 otherwise); (3) a SIFT-based VT test, in whichSiwas equal to (1−SIFT prediction score) for nonsynonymous SNPs and 0 other-wise; and (4) a PolyPhen-2-based VT test, in whichSiwas equal to the PolyPhen-2 score for nonsynonymous SNPs and 0 otherwise. For those nonsynonymous SNPs without a prediction score, we imputed them with the correspond-ing median scores: 0.1 for the SIFT algorithm and 0.2 for the PolyPhen-2 algorithm. For each gene, 10,000 permuta-tions were carried out to obtain thep-value.
Mixture model for combining test results
Here, we propose a simple mixture model to combine
p-values resulted from association tests based on different
functional prediction algorithms. Letpg1and pg2 be gene
g’s VT testp-values corresponding to the SIFT and Poly-Phen-2 algorithms, respectively, forg = 1,…, G. Define thez-transformation:
xgk =Φ−1(1−pgk) (3)
so that smaller p-values correspond to largerz-values, whereF−1 is the inverse cumulative distribution func-tion of N(1, 0) and k= 1, 2. We assume that (xg1, xg2)
follows a two-component bivariate normal mixture model, that is, that its density is given by:
f x( g1,xg2)=p0 0f x( g1,xg2)+ −(1 p0) (f x1 g1,xg2), (4)
wheref0and f1are two bivariate normal densities
cor-responding toz-values of non-phenotype-associated and phenotype-associated genes, respectively. The two-com-ponent normal mixture model is a simple yet powerful statistical method for genome-wide discoveries [11]. The posterior probability of geneg being associated with the phenotype is given by:
which can be used to rank genes and to estimate the false discovery rate (FDR) for a given cutoff for claiming significant genes and thus to control the FDR at a desired level, for example, 5% [12]. For simplicity, we further assume thatxg1 and xg2 are conditionally
inde-pendent given whether gene g is associated with the phenotype or not; that is,
f xl( g1,xg2)=f
(
xg1;ml1,sl21)
⋅f(
xg2;ml2,sl22)
, (6)Results
Prediction score comparison: SIFT vs. PolyPhen-2 algorithms
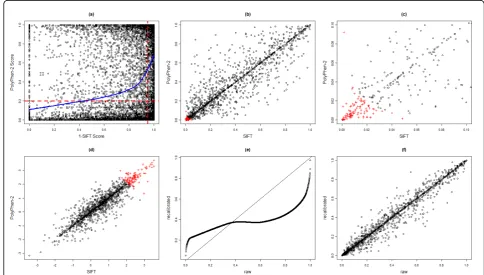
As described in the Methods section, we obtained the prediction scores of being deleterious using the SIFT and PolyPhen-2 algorithms for the 13,572 SNPs annotated as nonsynonymous in the annotation file supplied by GAW17. Nine hundred thirty-nine nonsynonymous SNPs did not have a SIFT score and 1,241 nonsynonymous SNPs did not have a PolyPhen-2 score, probably because of gene annotation errors or insufficient sequence evi-dence. Note that nonsynonymous variants with a Poly-Phen-2 score larger than 0.2 were predicted to be possibly or probably damaging, whereas those with a SIFT score less than 0.05 were predicted to be damaging. As a result, we plotted the (1 −SIFT score) against the PolyPhen-2 score in Figure 1a. The scatterplot together with the LOESS curve shows that the two scores are positively correlated, although there are quite a few SNPs with discordant prediction scores. We also assessed the correlation of dichotomous predictions from the two algorithms. Using 0.2 and 0.95 as thresholds for the
PolyPhen-2 and SIFT scores, respectively, we obtained a two-by-two table with cell counts as follows: P+ and S+ = 3,600, P−and S−= 4,492, P+ and S−= 2,403, and P− and S+ = 1,345. This resulted in an odds ratio (OR) esti-mate equal to 5 (chi-square testp< 10−16), meaning that the odds of being predicted to be deleterious using the PolyPhen-2 algorithm for variants that were predicted to be deleterious using the SIFT algorithm were five times the odds for those that were predicted to be benign using the SIFT algorithm. Similar comparison results held for the 13,086 nonsynonymous SNPs corresponding to the 1,979 genes with at least two SNPs.
Comparison of SIFT-based and PolyPhen-2-based VT tests
Figures 1b-d compare thep-values andz-values of SIFT-based and PolyPhen-2-SIFT-based VT tests. Although the two
p-values are positively correlated overall, they can be substantially different from each other. However, smaller
p-values seem to be better correlated, as demonstrated by the upper-right part of thez-value plot Figure 1d. In addition, we fitted a two-component bivariate normal mixture model to combine thep-values of the two tests,
as described in the Methods section. One hundred sixty genes were ranked 1 (i.e., the posterior probabilities of association were all equal to 1) in the combined analysis and were plotted as red plus signs in Figures 1b-d. Not only were genes with small p-values highly ranked, but genes with moderately small p-values could also be boosted to have a tied rank of 1 (Figure 1c).
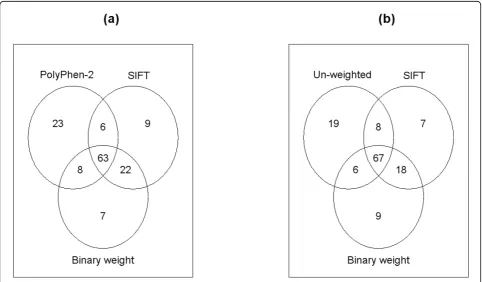
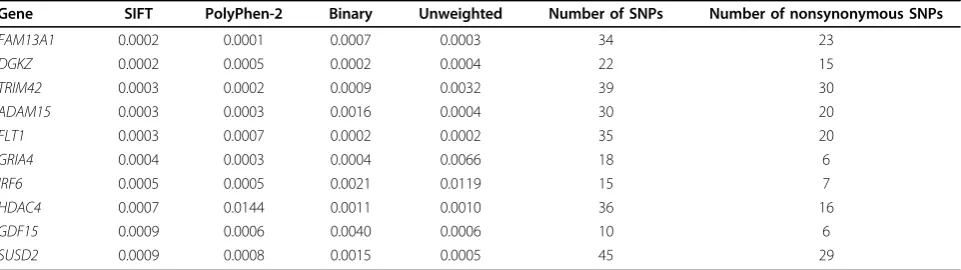
In addition to the comparison between SIFT-based and PolyPhen-2-based tests, we also performed compari-sons among all four versions of the VT test. Specifically, we looked at the overlaps among the top 100 genes by each test, as shown by the Venn diagrams in Figure 2. We can see that the SIFT-based and the binary weight-based tests share a large number of genes, whereas the PolyPhen-2-based and the unweighted tests share much fewer genes with the former two tests. This comparison also suggests, however, that association tests incorporat-ing different functional predictions could lead to quite different results. In practice, it is unlikely that one func-tional prediction algorithm will be dominantly better than the other, which necessitates a combined analysis in an effective way, such as the mixture model proposed here. In addition, Table 1 lists the top 10 genes by the SIFT-based VT test, all of which were tied at rank 1 by the combined analysis. All genes had smallp-values, as ascertained by the other three tests, as well as a large
number of SNPs sufficiently representing the corre-sponding genes.
Comparison of raw and recalibrated PolyPhen-2 scores
Price et al. [4] suggested that, to obtain optimal results, the PolyPhen-2 scores should be recalibrated before being applied to the VT test. We obtained the recali-brated PolyPhen-2 scores using the computer program provided by Price et al. [4]. Figure 1e shows the raw ver-sus the recalibrated PolyPhen-2 scores, which were cal-culated using a nonlinear monotone transformation of the raw scores. In addition, the VT test p-values based on the raw and recalibrated PolyPhen-2 scores are com-pared in Figure 1f. Although thep-values are highly cor-related with Spearman’s rank correlation coefficient equal to 0.98, they could be quite different for some genes.
Discussion
In the present analyses, we compared the raw and recali-brated PolyPhen-2 scores in the VT test. It would also be of interest to develop methods for recalibrating the SIFT scores; however, this would necessitate having available credible neutral and damaging nonsynonymous SNPs as a training set to derive the recalibration transformation. Another possible direction for future investigation is to
develop association tests that are more robust to misspe-cifications of functional predictions and can incorporate covariate effects including environmental factors.
Conclusions
Motivated by the fact that many algorithms for predicting damaging effects of nonsynonymous variants are avail-able, we performed a comparative study of the effects of incorporating different functional predictions into asso-ciation tests using the GAW17 simulated mini-exome data set. Our study reveals that, although the PolyPhen-2 and SIFT prediction scores are positively correlated over-all, they can be substantially different from each other, quantitatively as well as qualitatively. As a result, the SIFT-based and the PolyPhen-2-based VT test results can also differ. Importantly, our analyses suggest that the two-component normal mixture model proposed here provides a probabilistic approach to effectively combining the heterogeneous test results. Further refinements, including relaxing the conditional independence assump-tion to improve the goodness-of-fit, are needed.
Acknowledgments
We thank both reviewers for their constructive comments. Peng Wei was partially supported by a PRIME grant from the University of Texas School of Public Health. The analyses were performed without knowledge of the underlying simulating model. The Genetic Analysis Workshop is supported by National Institutes of Health grant R01 GM031575.
This article has been published as part ofBMC ProceedingsVolume 5 Supplement 9, 2011: Genetic Analysis Workshop 17. The full contents of the supplement are available online at http://www.biomedcentral.com/1753-6561/5?issue=S9.
Author details
1Division of Biostatistics, University of Texas School of Public Health, 1200
Herman Presser Drive, Houston, TX 77030, USA.2Human Genetics Center,
University of Texas School of Public Health, 1200 Herman Presser Drive, Houston, TX 77030, USA.
Authors’contributions
PW conceived and designed the study, performed the statistical analyses and drafted the manuscript. XL co-designed the study. All authors helped to draft the manuscript. All authors read and approved the final manuscript.
Competing interests
The authors declare that there are no competing interests.
Published: 29 November 2011
References
1. Cirulli ET, Goldstein DB:Uncovering the roles of rare variants in common diseases through whole-genome sequencing.Nature Reviews Genetics
2010,11:415-425.
2. Li B, Leal SM:Methods for detecting associations with rare variants for common diseases: application to analysis of sequence data.Am J Hum Genet2008,83:311-321.
3. Madsen BE, Browning SR:A groupwise association test for rare mutations using a weighted sum statistic.PLoS Genet2009,5:e1000384.
4. Price AL, Kryukov GV, de Bakker PI, Purcell SM, Staples J, Wei LJ, Sunyaev SR: Pooled association tests for rare variants in exon-resequencing studies.
Am J Hum Genet2010,86:832-838.
5. Adzhubei IA, Schmidt S, Peshkin L, Ramensky VE, Gerasimova A, Bork P, Kondrashov AS, Sunyaev SR:A method and server for predicting damaging missense mutations.Nat Meth2010,7:248-249. 6. Kumar P, Henikoff S, Ng PC:Predicting the effects of coding
non-synonymous variants on protein function using the SIFT algorithm.Nat Protoc2009,4:1073-1081.
7. Schwarz JM, Rodelsperger C, Schuelke M, Seelow D:Mutation Taster evaluates disease-causing potential of sequence alterations.Nat Meth
2010,7:575-576.
8. Bromberg Y, Yachdav G, Rost B:SNAP predicts effect of mutations on protein function.Bioinformatics2008,24:2397-2398.
9. Flanagan SE, Patch AM, Ellard S:Using SIFT and PolyPhen to predict loss-of-function and gain-loss-of-function mutations.Genet Test Mol Biomarkers
2010,14:533-537.
10. Almasy LA, Dyer TD, Peralta JM, Kent JW Jr, Charlesworth JC, Curran JE, Blangero J:Genetic Analysis Workshop 17 mini-exome simulation.BMC Proc2011,5(suppl 9):S2.
11. McLachlan GJ, Bean RW, Jones LB:A simple implementation of a normal mixture approach to differential gene expression in multiclass microarrays.Bioinformatics2006,22:1608-1615.
12. Sun W, Cai T:Oracle and adaptive compound decision rules for false discovery rate control.J Am Stat Assoc2007,102:901-912.
13. Wei P, Pan W:Network-based genomic discovery: application and comparison of Markov random field models.J R Stat Soc Ser C Appl Stat
2010,59:105-125.
doi:10.1186/1753-6561-5-S9-S20
Cite this article as:Weiet al.:Incorporating predicted functions of nonsynonymous variants into gene-based analysis of exome sequencing data: a comparative study.BMC Proceedings20115(Suppl 9): S20.
Table 1 Top ten genes ranked by SIFT-based VT testp-value
Gene SIFT PolyPhen-2 Binary Unweighted Number of SNPs Number of nonsynonymous SNPs
FAM13A1 0.0002 0.0001 0.0007 0.0003 34 23
DGKZ 0.0002 0.0005 0.0002 0.0004 22 15
TRIM42 0.0003 0.0002 0.0009 0.0032 39 30
ADAM15 0.0003 0.0003 0.0016 0.0004 30 20
FLT1 0.0003 0.0007 0.0002 0.0002 35 20
GRIA4 0.0004 0.0003 0.0004 0.0066 18 6
IRF6 0.0005 0.0005 0.0021 0.0119 15 7
HDAC4 0.0007 0.0144 0.0011 0.0010 36 16
GDF15 0.0009 0.0006 0.0040 0.0006 10 6
SUSD2 0.0009 0.0008 0.0015 0.0005 45 29